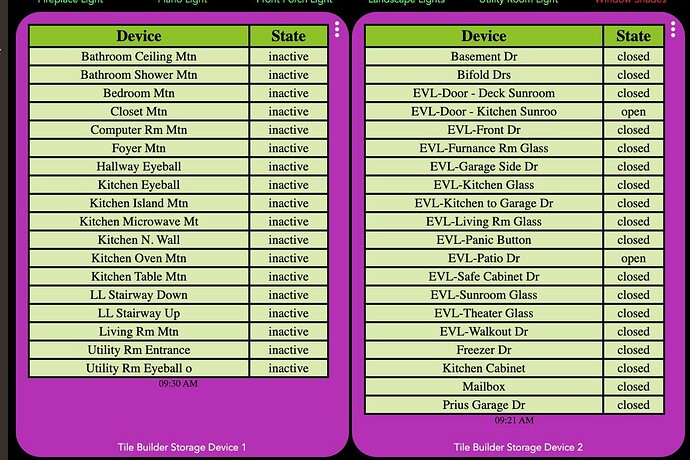
Tile Builder is a novel way of presenting data on a Hubitat® Dashboard. Rather than each tile being a single unique device, Tile Builder allows data from multiple devices to be presented on the same tile in a variety of formats.
Tile Builder has five child apps for creating different kinds of tiles.
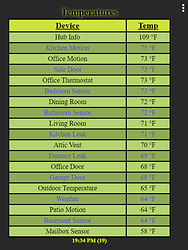
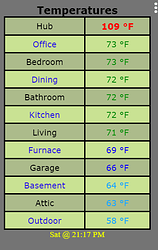
1) Attribute Monitor tiles contain any number of devices for a single attribute. In the following case it's temperature. The table can be sorted by the device name or the attribute value (text or numeric). The tile will be regenerated each time one of the monitored attribute values change so it operates in real time but has low hub impact. Attribute Monitor Help.
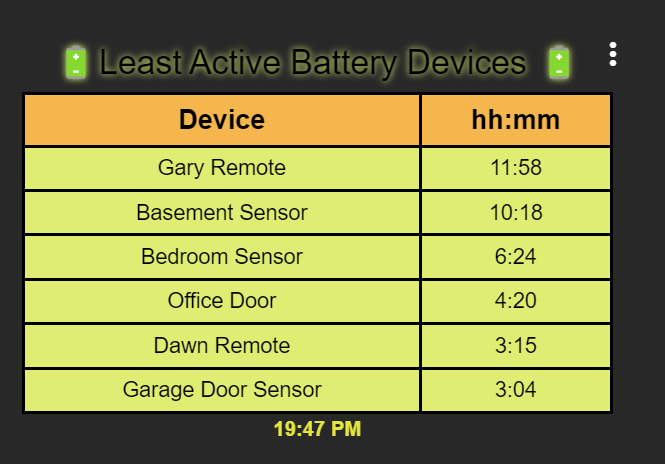
2) Activity Monitor tiles hold a table of data based on the LastActivityAt attribute. This can be useful for monitoring active or inactive devices. This table shows a list of battery devices that have not had activity in at least the past two hours. Activity Monitor tiles are refreshed on a user defined periodic basis ranging from minutes to hours. Activity Monitor Help.
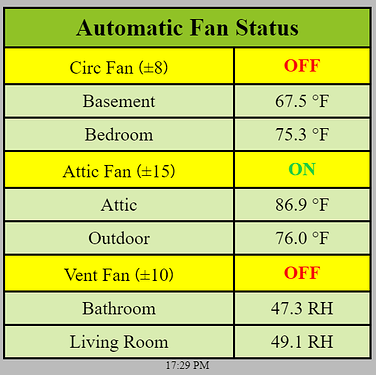
3) Multi-Attribute Monitor was released on July 17th, 2023 and allows to mix and match any combination of devices and attributes that you might be interested collating in a unified way. The example below shows switches, temperature and humidity values all on the same tile.
Multi Attribute Monitor Help File.
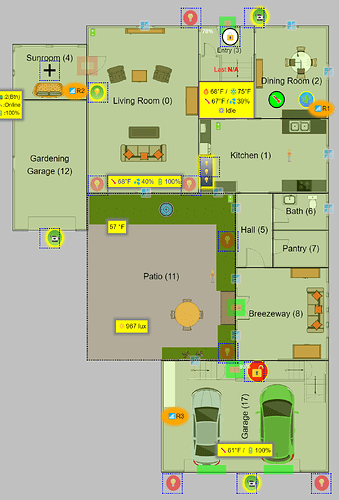
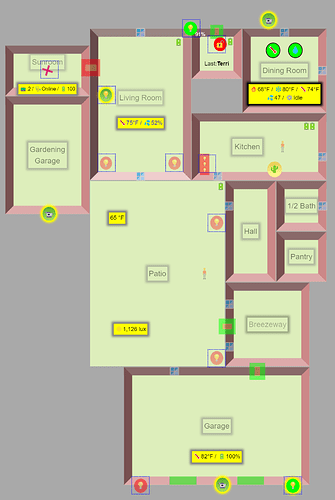
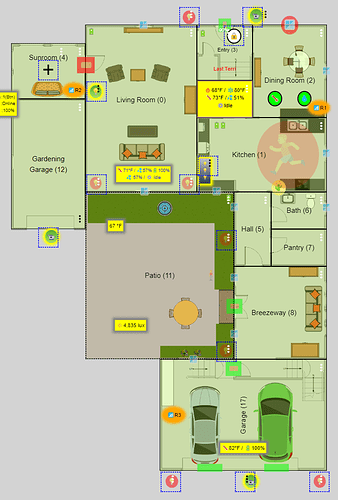
4) Rooms was released on September 6th, 2023 and uses icons arranged on a grid to represent the layout of devices within a room. As devices change state\value, so do the icons\values to give a real time overview of a room. Multiple rooms can be connected together to for a whole house plan.
Rooms Quick Start Guide.
Rooms Help File.
Rooms: How to configure a background image.
Finished example with background image:
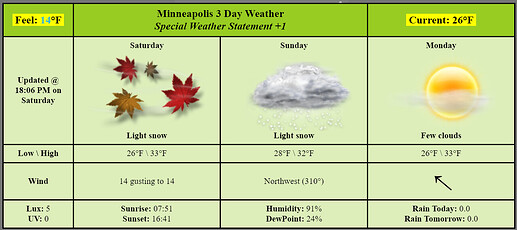
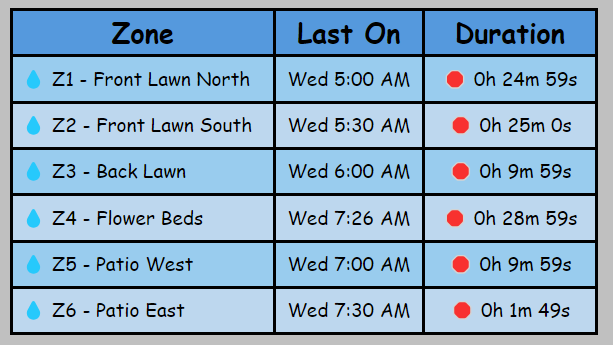
5) Grid was released on December 30th, 2023 and allows for the creation of complex tables up to 5 columns wide and 20 rows of data. Grid Help File
Grid 2.0 was released via HPM on May 18th, 2024 and adds access to device event information, Hub information and Hub variables and provides a wide range of date\time formatting options.
This table shows the last time my sprinklers ran for each zone and the duration that they ran for.
6) Thermostat was released on June 18th, 2024 and is an attractive and fully functional replacement for the native Hubitat Thermostat tile.
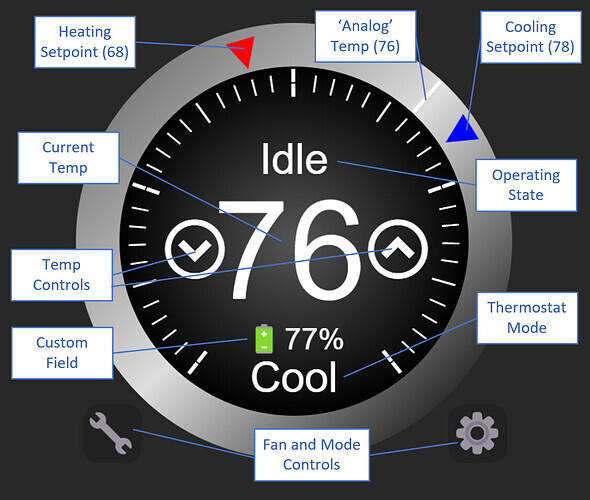
Tile Builder Thermostat Help
----- This Section Relates to Activity Monitor, Attribute Monitor, Multi Attribute Monitor and Grid ------
Video Tour
2:00 minute video, create and publish a simple tile. https://youtu.be/e-jTP3sWIZY?vq=hd1080
8:00 minute video, edit and publish a simple tile. https://youtu.be/1VEENAxY0UI?vq=hd1080
Note: There are a few minor visual differences between the videos and the final product.
Main Benefits of Tile Builder
Native solution for Hubitat® dashboards that is easy to use and looks great.
Full control over color, style and placement of tiles etc.
Data can be presented at a much higher density. Great for tablets and phones.
Does not require maintenance of a separate external platform.
Entirely local to the hub. No need to send events off to a remote system and no delays.
Everything up to this point is included in Tile Builder Standard which is free to all users.
Tile Builder Advanced
Tile Builder Advanced adds a lot of extra capabilities for a minimum $12 donation to support ongoing development. The key features are:
Filtered Lists
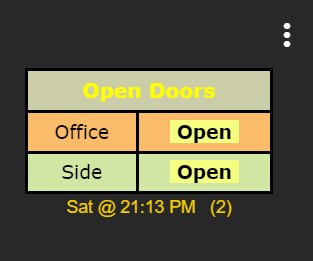
Monitor all devices in a category but only display those that meet a given criteria. In this case only open doors are displayed which is a huge space saver. The table updates as soon as a door opens or closes.
1 Minute Video of Filters. https://youtu.be/5-qB7ts8NSE?vq=hd1080
Styles
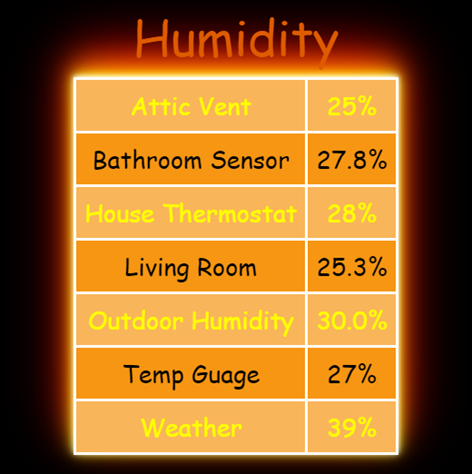
You can load and save styles to quickly apply a consistent look. Shown below is "Halloween".
3 Minute Video of Styles. https://youtu.be/zH2dhpIgkUE?vq=hd1080
You can export a style and share it via a message board for someone else to import.
Thresholds
Numeric data can be color coded based on threshold values.
3 Minute Video of Thresholds. https://youtu.be/Wnzp4zoh7wk?vq=hd1080
Keywords
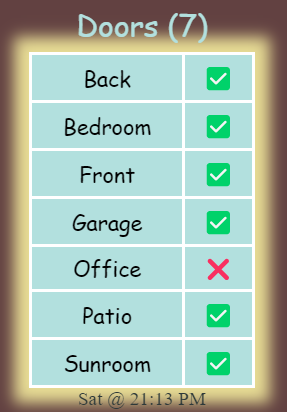
String data can be replaced to make display more interesting. In this "open" is replaced with ![]() and "closed" is replaced with
and "closed" is replaced with ![]()
2 Minute Video of Keywords. https://youtu.be/YyrBdubEpoA?vq=hd1080
Advanced\Overrides
This provides a method to customize everything about the table and is akin to a lightweight programming model. The capabilities enabled here are pretty huge and are discussed at length in the documentation which can be found here.
Remote Builder
This license is also valid for all modules of Remote Builder (including SmartGrid). You can find more information on Remote Builder here.
----- This Section Relates only to Multi Attribute Monitor ------
The formatting capabilities for Multi Attribute Monitor are very similar but do add a few unique items
Tile generated with the Standard version.
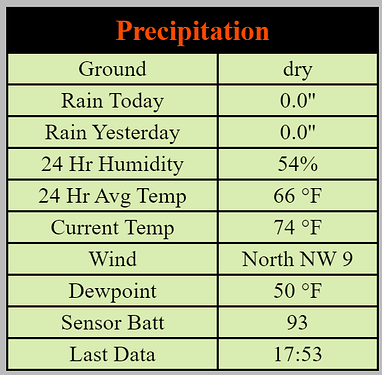
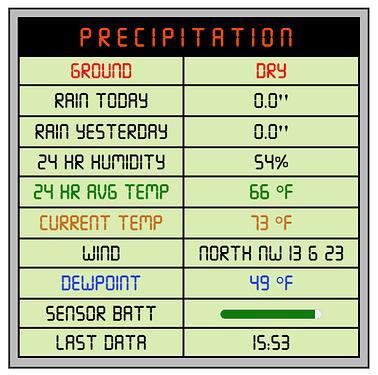
Same tile dressed up a bit with the Advanced version.
This is part of the design interface. Here you can select up to 10 device\attribute pairs and give them any name you want as well as prepending and appending text to the data, such as units.
- Item Name: You can name the device\attribute anything you want.
- Prepend: You can prepend text to the attribute including html tags (in brackets).
- Append: You can append text to the attribute, most likely units but also including html tags.
- Cleanup: Cleanup lets you apply different operations to the data to clean it up. Available operations are: None, Capitalize, Commas, 0/1 Decimal Places and Upper Case.
- Rules: This only has significance if you have TB Advanced. Here you can specify which Highlight rules apply, if any, to this particular row of data.
You can find a help file here for Multi Attribute Monitor .
----- This Section Applies to Rooms ------
Just your standard Hubitat dashboard and Tile Builder. Key points:
- Generate a plan view of your home and display devices and attributes.
- Huge amount of control over how things are displayed.
- No Maker API, external software or hardware needed.
- Works over the internet using the Hubitat App without a VPN.
- Blue dotted boxes activate the standard Hubitat UI element for switches and bulbs.
For a more realistic view you can add a background image using a drawing program.
Advanced version supports up to 10 devices placed directly in the room plus 2 Icon Bars that each support up to 5 devices. Icon Bars are mainly for displaying values and are mainly shown in the yellow boxes in the graphic.
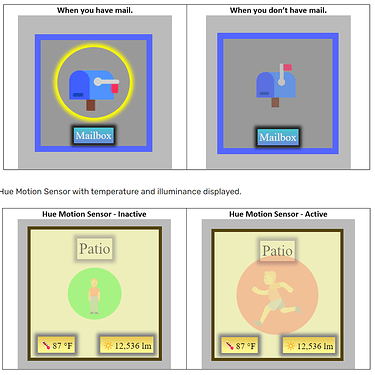
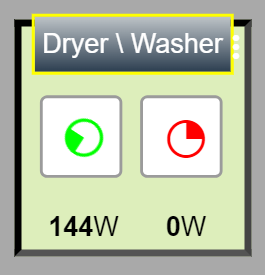
Standard version supports up to 3 devices and you can still do some pretty interesting stuff. In the image below the Active motion sensor tile is animated.
You can find a comprehensive help file for TB Rooms here.
----- This Section Applies to Grid ------
Grid has two modes of operation.
1) Device Group Mode: In this mode the user completes a single line template for a group of like devices. The table is generated using those same settings for each row. Here is a simple example.

2) Free Form Mode: In this mode the user completes each cell of a grid template with whatever information you wish to see.
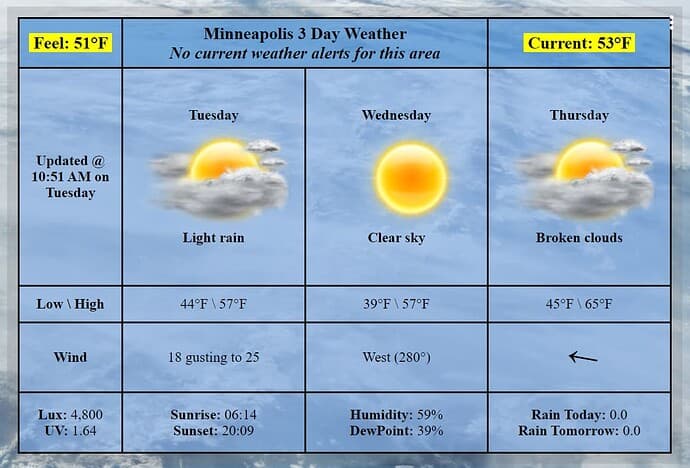
You can find the help file for TB Grid here.
----- This Section Applies to All Modules ------
Hubitat App Integration
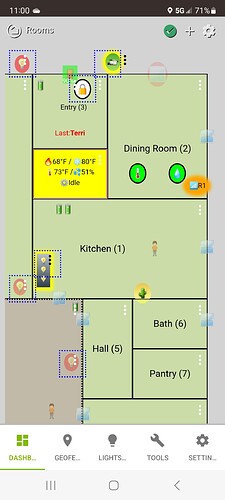
Because this is just HTML and CSS it integrates into the native app very well. Just scroll around for the rest of the dashboard.
Tile Builder is available via HPM.
I look forward to seeing what people create.
