*** BPTWorld apps are no longer being developed or maintained. Thanks ***
Introducing 'Snapshot'
Monitor devices and sensors. Easily see their status right on your dashboard and/or get a notification - speech and phone.
Features:
- See all your devices on one dashboard in REAL time, every X minutes or on demand.
- Select only the devices you want
- Everything is color coded for easy status identification
- Data is displayed in nice uniform tables
- Works with devices, contacts, locks and Temps
- Two types of reports - Regular and Priority
- Regular - Select Full report, Just On/Off/Open/Closed/Wet/Dry/locked or unlocked
- Priority - Only display devices that are not the status they should be at any given time. Also has the ability to turn on a switch if something isn't right.
- Priority - Receive priority device notifications on demand with both voice and pushover options. Great for checking the house before setting the alarm or going to bed.
- All devices are displayed in alphabetical order (by status)
- Parent/Child App structure
- Create as many child apps as needed
Apps can be found on my GitHub or by using the Hubitat Package Manager.
(HPM is highly recommended)
When reporting problems...
- Be sure you are on the latest version. I won't troubleshoot an older version.
- Turn on debug and screenshot the issue happening in the log. One line or just the error doesn't cut it. I need a log.
- Post the screenshot of the log with an explanation of the problem.
Thanks
19 Likes
Damn it... Where were you when I was setting up all my NodeRed dashboards for this very reason?! LOL
Will this include battery stats as well?
1 Like
Device Watchdog already does this
Duh. Ugh, I'm batting zero today. LOL
1 Like
Release V1.0.0 Now available! 
1 Like
New version on Github...
V1.0.1 - 03/23/19 - Major update to comply with Hubitat's new dashboard requirements.
Make sure to update both the child app and the driver.
Looks awesome on the new dashboards!
Is this the proper way to include this:
- I went to your GitHub and copied. Tried to paste as an app in my HE.
- I got the following message:
There are 3 files that need to be installed. Two are apps (S-parent.groovy and S-child.groovy) and 1 driver (S-driver.groovy). Each would need to be copied and pasted according to the instructions, also on Github.
Which file is throwing this error?
Hello.
Please forgive my question. I just didn't read the instructions thoroughly. (Part of my training as an Engineer, is that I don't read instructions that well!)
Now, my choice between SharpTools and the Hubitat Dashboard is going to be even more difficult!
1 Like
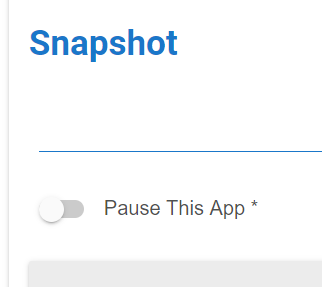
I have just started going through this app and I'm not sure I understand the function of the "App Control Switch" and the "Enable/disable switch". Could you please enlighten me?
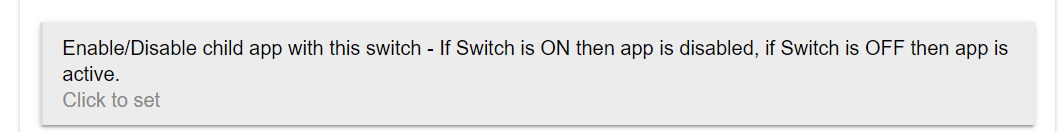
App Control Switch - In 'Real Time' and 'Every X Minutes' it's an on / off type of switch. When it's on, the app works. When it's off it doesn't. When in 'On demand', this device works more like a button, when activated it goes out and takes a Snapshot of your selected devices.
Enable/Disable is more of a global switch. When this switch is On, the app will work. When it is off, it won't. This is in most apps. So you could disable several apps at one time.
1 Like
I'm a little confused on setting this up. I am creating my first app and selected 'every x minutes', but it is also saying a control switch is required. What would a control switch do in the 'every x minutes' scenario?
Read the post right before yours. (post 12) 

Ok, thanks. My bad for not reading post 12 in detail. However is that not redundant with the slider built into the child to turn the child off?
Also, what does this do then - also feels redundant:
Feels like three ways to do the same thing. Technically pause and disable are different, but in affect are the same, are they not?
In any case, thanks knowledge transferred, looks like I need two virtual devices. One for this on/off/disable/pause control and one for the dashboard. Is that correct?
Also, should I expect an update time? To explain, I got it working, added my tiles for all my contact sensors and realized I missed a sensor. Went back to the child app and added the sensor and clicked Done.
Tried refreshing the dashboard, no updated sensor list.
Tried deleting the tiles and re-adding, no updated sensor list.
Should I expect some delay or did I miss a step somewhere to have it update?
Thanks for all your help!
I guess the answer for the delay, is 1) Yes, and 2) about 5-10 minutes. I now have the updated sensor list showing on my tiles. Cheers!
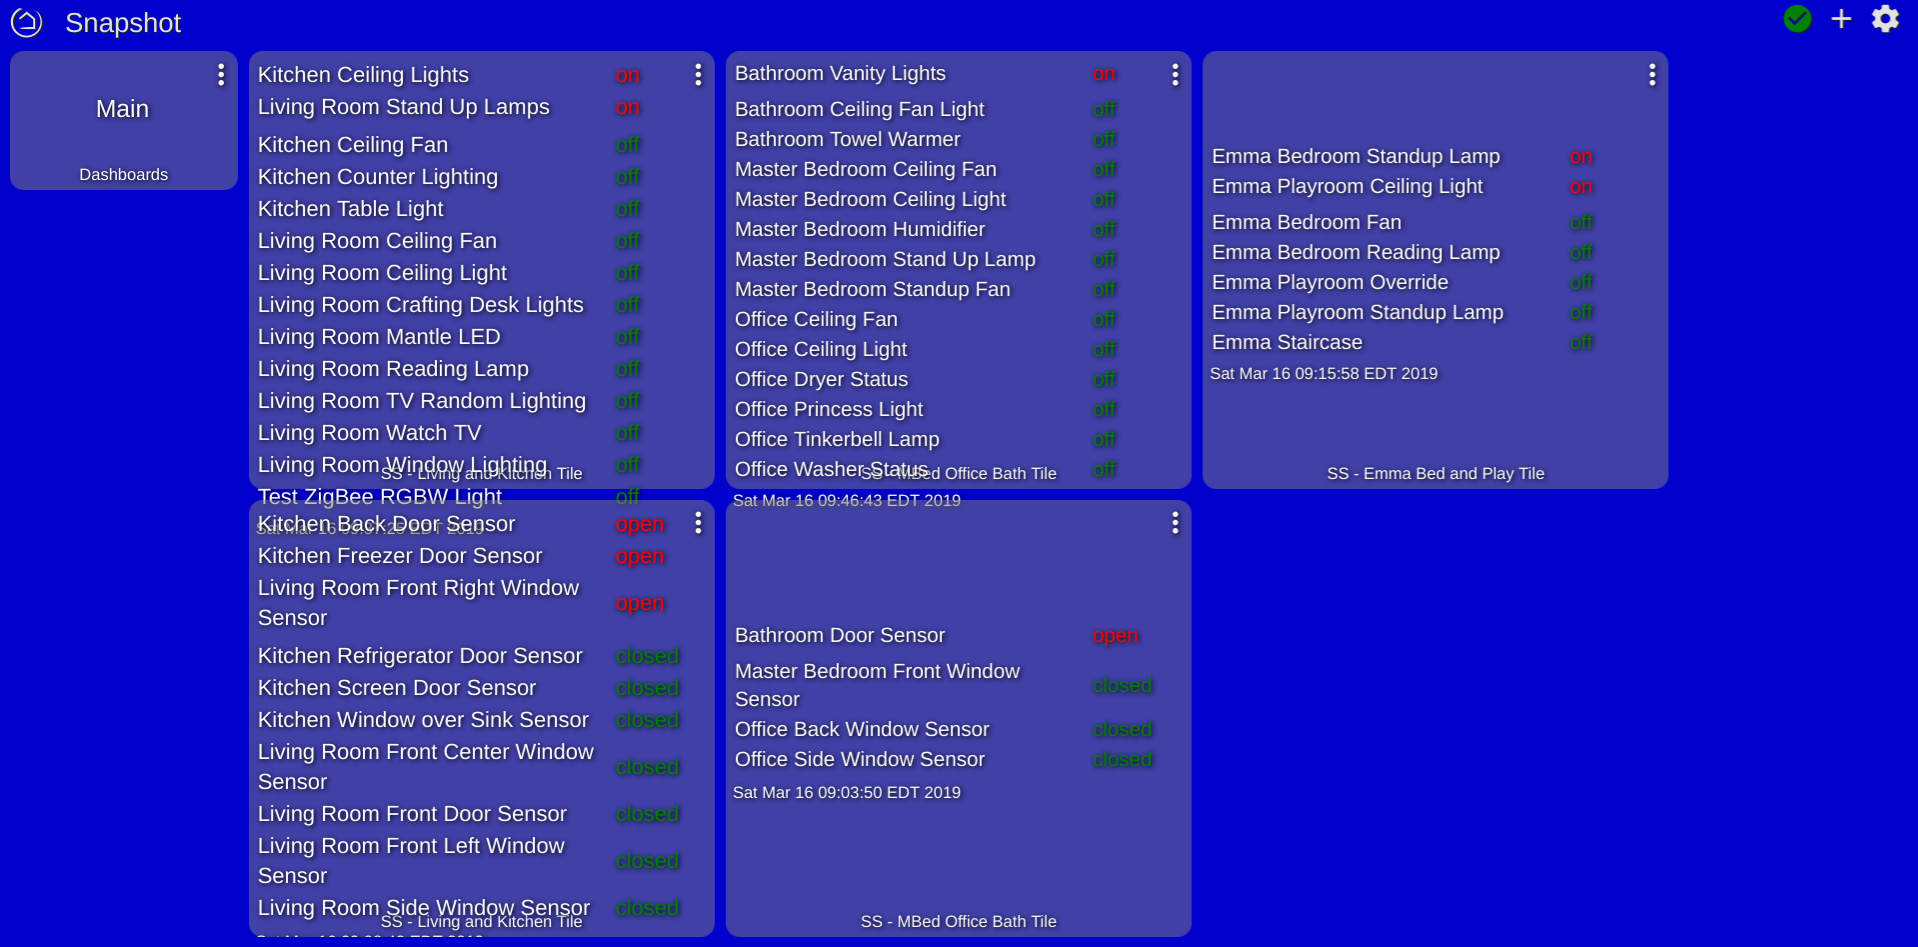
It is obvious in looking at the screen shot in post 2 and the notes in post 1, but as notes for other users, items are grouped alphabetically, but that is a secondary sort to the devices status. Note he has Kitchen and then Living Room items on, then followed by Kitchen items off.
Makes me think of a request for a feature. I mapped in about 25 sensors, thus needed about 5 tiles on my dashboard. I only really care about the OPEN state so I can shut down the house at night. Could you make options to only show items that are either OPEN or CLOSED (contacts), or ON or OFF (switches)? Then I could get this down to one tile and catch which window I missed.
Wow, where to start!? lol
You'll need one for the Control Switch, the enable/disable is optional. Then a virtual device for the tile.
Just comes down to choice and/or need. They are there for those that choose to use them.
Depends on the options chosen. 'Real Time is just that, everything happens in real time. Every X minutes will only update every x minutes. Then there is 'On demand', this device works more like a button, when activated it goes out and takes a Snapshot of your selected devices.
Was already mentioned in another post, programming is done... just doing the testing on it now. 
Thanks
4 Likes
New version on Github...
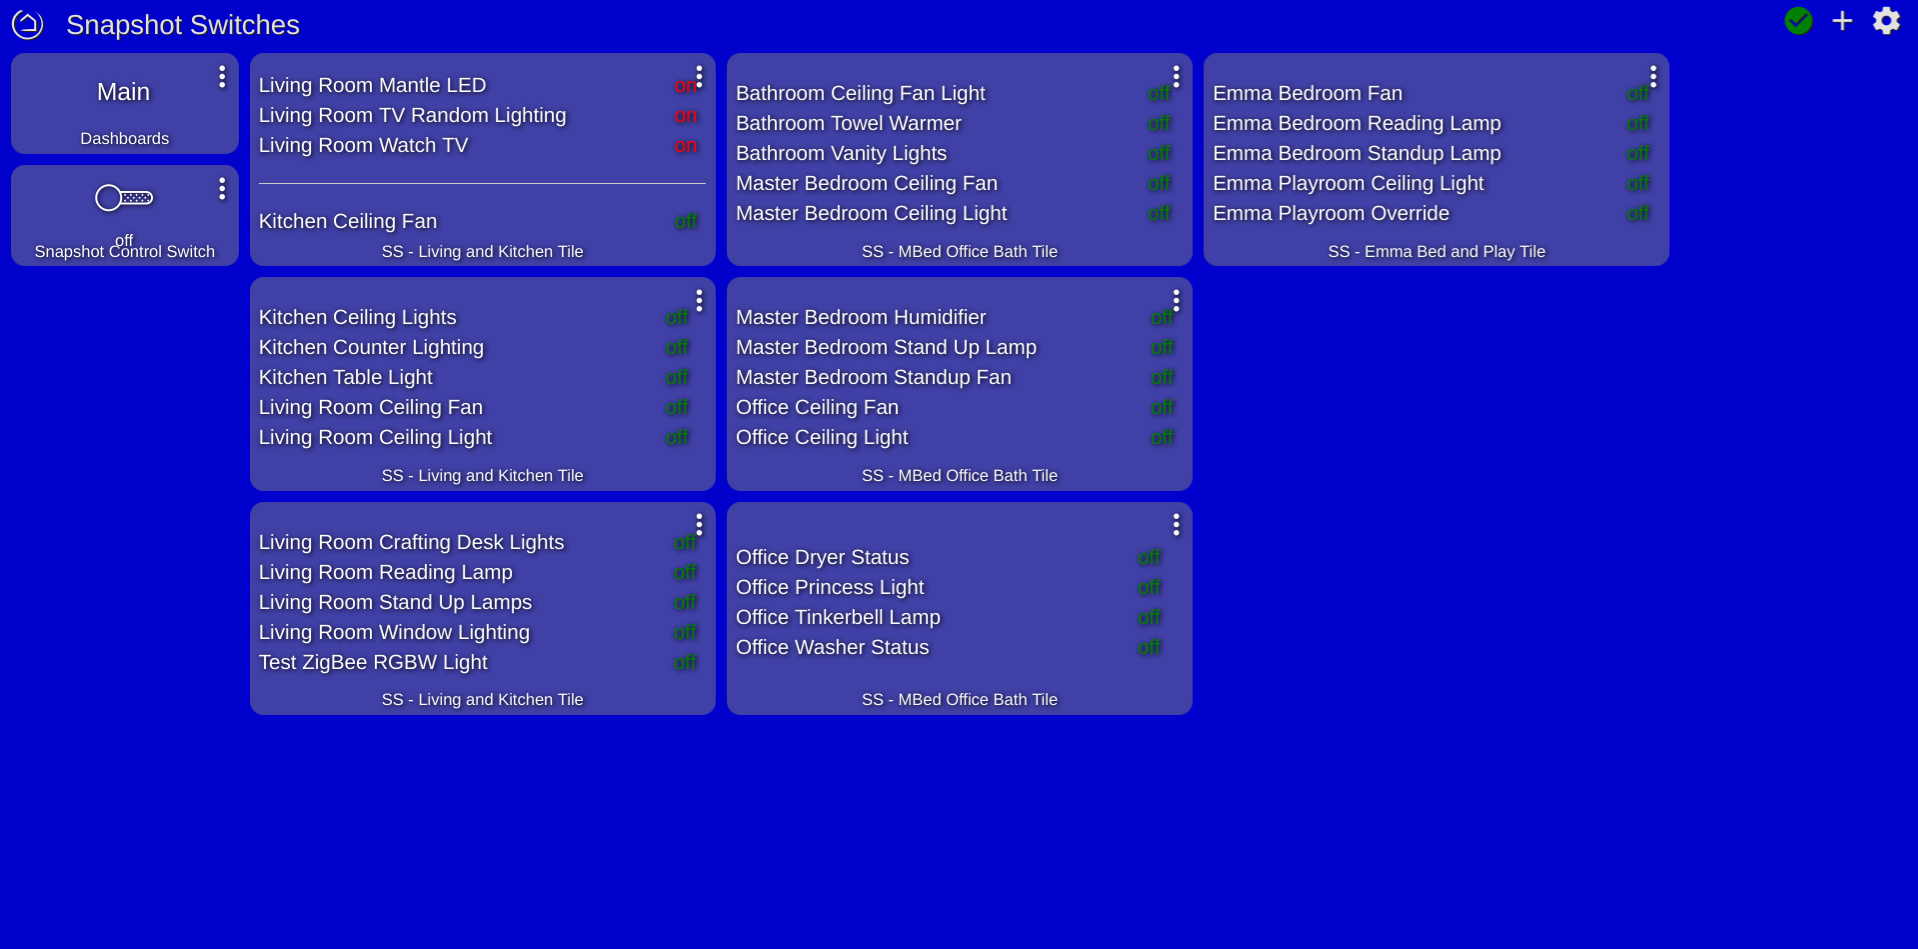
V1.0.2 - 03/30/19 - Added ability to select what type of data to report: Full, Only On/Off, Only Open/Closed. Also added count attributes.
Be sure to update both child app and driver.
Thanks
2 Likes
@bptworld I just updated Snapshot and saw the changes but I haven't investigated the options so this might be somewhat possible as things are.
What I would really like to have is, for want of a better description, a green/good to go panel. At night, I would like to just look at a dashboard, where if the important things are in the state they should be in, all the lights are green. The things that are supposed to be on are on; off are off; the things that should be open are open; that should be closed are closed etc. Anything that is in the wrong state shows up as a red light and is therefore quite obvious.
1 Like