Ready-to-Use Grafana Dashboards! - Beta Test / Feedback

Working on building these to share, to work in conjunction with the InfluxDB Logger app.
InfluxDB2 (Flux) Required by default, some are ported to work on 1.x (InfluxQL).
Data Source for Flux must be setup in Grafana using Query Language: Flux

  • Easy drop down menus at the top to configure for your setup.
  • Support for alternate device name Tags if you are not using InfluxDB Logger.
  • Supports multiple hubs being fed to same bucket.

Download info at bottom of post

How to import a dashboard: Manage dashboards | Grafana documentation


Hub Info Dashboard:

  • Designed to work with metrics from Hub Info Driver v3
  • Recommended to enable "Include Hub Name" on InfluxDB Logger
  • Can group by hub name or device name.

:warning: Requires metrics from Hub Info Driver v3: cpu15Min, cpu5Min, cpuPct, dbSize, firmwareVersionString, freeMemory (units in KB), temperature, uptime

If you want to use freeMemory units of MB in the Info Driver you can edit the two memory charts and change the unit to Data / megabytes to fix them.

Top Section is Guages, I have this setup to duplicate with multiple hubs automatically, so the example shows two. If you only have one hub this row will only show once.

Historical charts below, showing last 24hr but can be set to any range you want. I have color coded thresholds setup for the dashed lines but using the classic chart colors to support multiple hubs. For a single hub you can change the color scheme to match the thresholds if you want.


Sensors Dashboard:

  • First section is at a glance where is everything at
  • Then you have the open/close type sensors history info (presence, motion and contact)
  • Last is the historical charts, if you want to see trending over time.

:warning: Requires (from applicable devices): temperature, humidity, battery, motion, presence, contact


HVAC Dashboard

Thanks for @mavrrick58 for sharing his original design

:warning: Requires: thermostatOperatingState, coolingSetpoint, heatingSetpoint, temperature (from thermostat and/or temp sensors)


Download Link for all published Dashboards:

~ Dropbox - hubitat-dashboards - Simplify your life

  • FLUX --> Requires InfluxDB2 / Flux source
  • QL --> Requires legacy InfluxDB v1 / InfluxQL source
20 Likes

WIP / Thoughts / Ramblings

I apologize for all the words, just sort of putting my thoughts down and looking for feedback to make these the best they can be. Any feedback is welcome.

Hub Info Dashboard:

Top Section is Guages, I have this setup to duplicate with multiple hubs, so my example shows two. If you only have one hub this row will only show once, automatically.

I was also playing around with the meters on the right, having those not duplicated by row but showing them stacking in the same box. I like this better but it messes with the rest of my design because it would have to be below the other guages in a separate row.
image

The CPU chart I have setup to stick to 50% height, otherwise something with crazy spikes it would go way up. I think really not worried about anything in the green zone, so looking for spikes and this would help see that for sure. I have 5min load which is where the % is estimated from, probably not useful. Maybe I should switch it to the 15min load average?

What about the stats in the legend? Since current can be seen on the gauges easily I thought min/max (whatever is applicable) would work good there. Have not fixed the CPU chart yet apparently.

2 Likes

For clarity in this scenario.
What is hosted as a cloud service?
What is hosted on the local LAN?
What is on the Hubitat hub?

You need something on Hubitat to send the data, InfluxDB logger app can work.

From there you can have the influx database and grafana cloud or locally hosted.

2 Likes

I’m down for these dashboards… they look very useful!

2 Likes

Great job in setting up this thread, happy to contribute mine once you have something setup.

I tend to keep my dashboard's simple and instant reads and then trends. I have two hubs so I just must drop down and select the hub I am working with.

I like a spread :slight_smile: With trends...

I know i have a handful of dashboards of which really only 2 or 3 are really used much.

I have a Hub Performance dashboard, which isn't as nice as what @jtp10181 has put together.

Then there is a Home Temp Dashboards, Home Humidity dashboard, Battery Dashboards, HVAC activity dashboard (tring to emulate the Ecobee efficency graphs), Motion Activity dashboard, and then lastly the Syslog Dashboard.

The most used are by far the Hub Performance dashboard and the Home Temp Dashboard. The syslog Dashboard gets a fair amount of use when something goes off the rails.

I think one question would be what topics do we think people want to know. That has generally driven me to create the dashboards i have.

Lastly when these are shared we need to ensure we are clear on a way to describe there compability. I am going to have in my Hubitat,Influxdb, grafana thread directions to on how to create connectivity for both Influx v1 query types and Flux query connections. so that should help ensure every can use them as long as they are running a V2 database. I am also pushing v2 database in that documentation.

1 Like

Me too, hub info... info is by far the main use case in recent... years. I originally looked at Grafana to allow me to setup temperature and humidity charts like the SensorPush App. I would like to get back to using those via Grafana, embedding them in an HE dashboard.

My main Grafana dashboard also includes battery readings that I occassionally look at for things like my phone, tablets Samsung Contact Sensors and Logitech keyboard and mouse. I should add a few more item into this, but ultimately notifications on battery sensors is more the way to go.

I have also used Grafana to report similar metrics for my rpi's, sent to HE and then to InfluxDB for reporting in Grafana, mostly temperature at the moment, but other metrics would be useful as well, with the main benefit of tracking change over time more easily thank simply keeping track of the latest state and warnings off the back of that.

Internet Speed may also be useful... I have that on my main performance dashboard I posted earlier, but not something I look at regularly.

Ultimately tracking changes over time is what you would use Grafana for over charting options that show recent events / changes. Grafana will offer longer or more options for analysing the metrics you can capture for the recent past by other means. Not to say it's the only option, just that is where it sits in the group of options.

My temperature / humidity gauges charts obviously need some attention (I haven't used them in quite some time...) And I am obviously in the Southern Hemisphere... But they were a good example for me of the use of parameters and repetition based on a dimension like a device

It may also be useful to note that Grafana can do more then just graphs now as well. It can be setup for Monitoring and Alerts as well. I haven't set any up myself, but just saying it can do more then just graphs

1 Like

Yes.... I certainly agree that it is worth knowing the capabilities of a system if you start to use it... but I feel if you were using Grafana without a system like HE, then alerts are certainly a useful feature. But for those familiar with and using a platform like HE... It's a tough sell for me.... Certainly if you have other data feeding into Grafana it then offers something over and above what users have already, but if you have the data feeding into Influx / (another Grafana source), then I would suggest looking at options to feed the data into HE. That said... As I was writing that... I will admit if the source of the events i chatty and produces a large amount of data, then I can understand feeding the data directly into InfluxDB / Grafana rather than overloading HE unnecessarily... OK, I'm sold :wink:

1 Like

I am just saying it can do more. I don't use any of it either. I am sure there are times it could be good to use, but allot can be done from HE as long as it isn't resource constrained

1 Like

I added a screenshot of my Sensors dashboard (second post) as well. Open for feedback.
I will look at all the other images people have posted as well to get ideas.

I think it will be great if we can have a set of prebuilt ready to drop in dashboards for people who want to get started!

I have one more for switches, which will be last it is the least important IMO.

UPDATE

I added a link to the JSON for the Hub Info dashboard in the first post if anyone wants to play with it.

2 Likes

Exactly, wasn't meant as any kind of rebuff of your suggestion, certainly worth mentioning, just wanting to put it in perspective of what HE is also capable of. But yes, there are benefits also to lightening the load on HE and sending the data directly to Influx/Grafana.

I got your Hub Info dashboard loaded. Looks great. Only thing i noticed is that the graphs on the bottom for CPU and Temp use the same color for both hubs.

Here are a few of mine. Not as complicated, as most of the others.

HVAC Graphs.

The idea here is to allow us to see temps in the house with HVAC state.

Here is one of my early ones to show me temps in out and outside of the house

I like the graphs with multiple devices. It can be good to see correlation between them.

Here is the Syslog Dashboard i have with Grafana and INfluxDB. It also uses a device driver that listens to the HE Live Logging Web Socket and writes the data to INfluxDB. This is great for those of us that need to review logging data from the hub. It really makes it easy to dig through with the filtering it has.

All of mine use INfluxQL instead of FLUX though so it is a strange mis mash of INfluxDBv2 database, with grafana using a connection setup to enable legacy InfluxQL to simplify the queries

2 Likes

Along this same lines guys if you have any input for the documentation thread I have created, please feel free to dm me with your input. I want to make it pretty straight forward to get folks into this stack.

1 Like

Yes I have been wanting to do that. I tried overlaying it on the temp graph before but had issues. The on/off state is nice and simple. I was trying to get the actual set temp on there but maybe if I do a separate HVAC dashboard both could work nice.

Could probably integrate the thermostat / indoor / outdoor temps into that same dashboard as well, at the bottom.

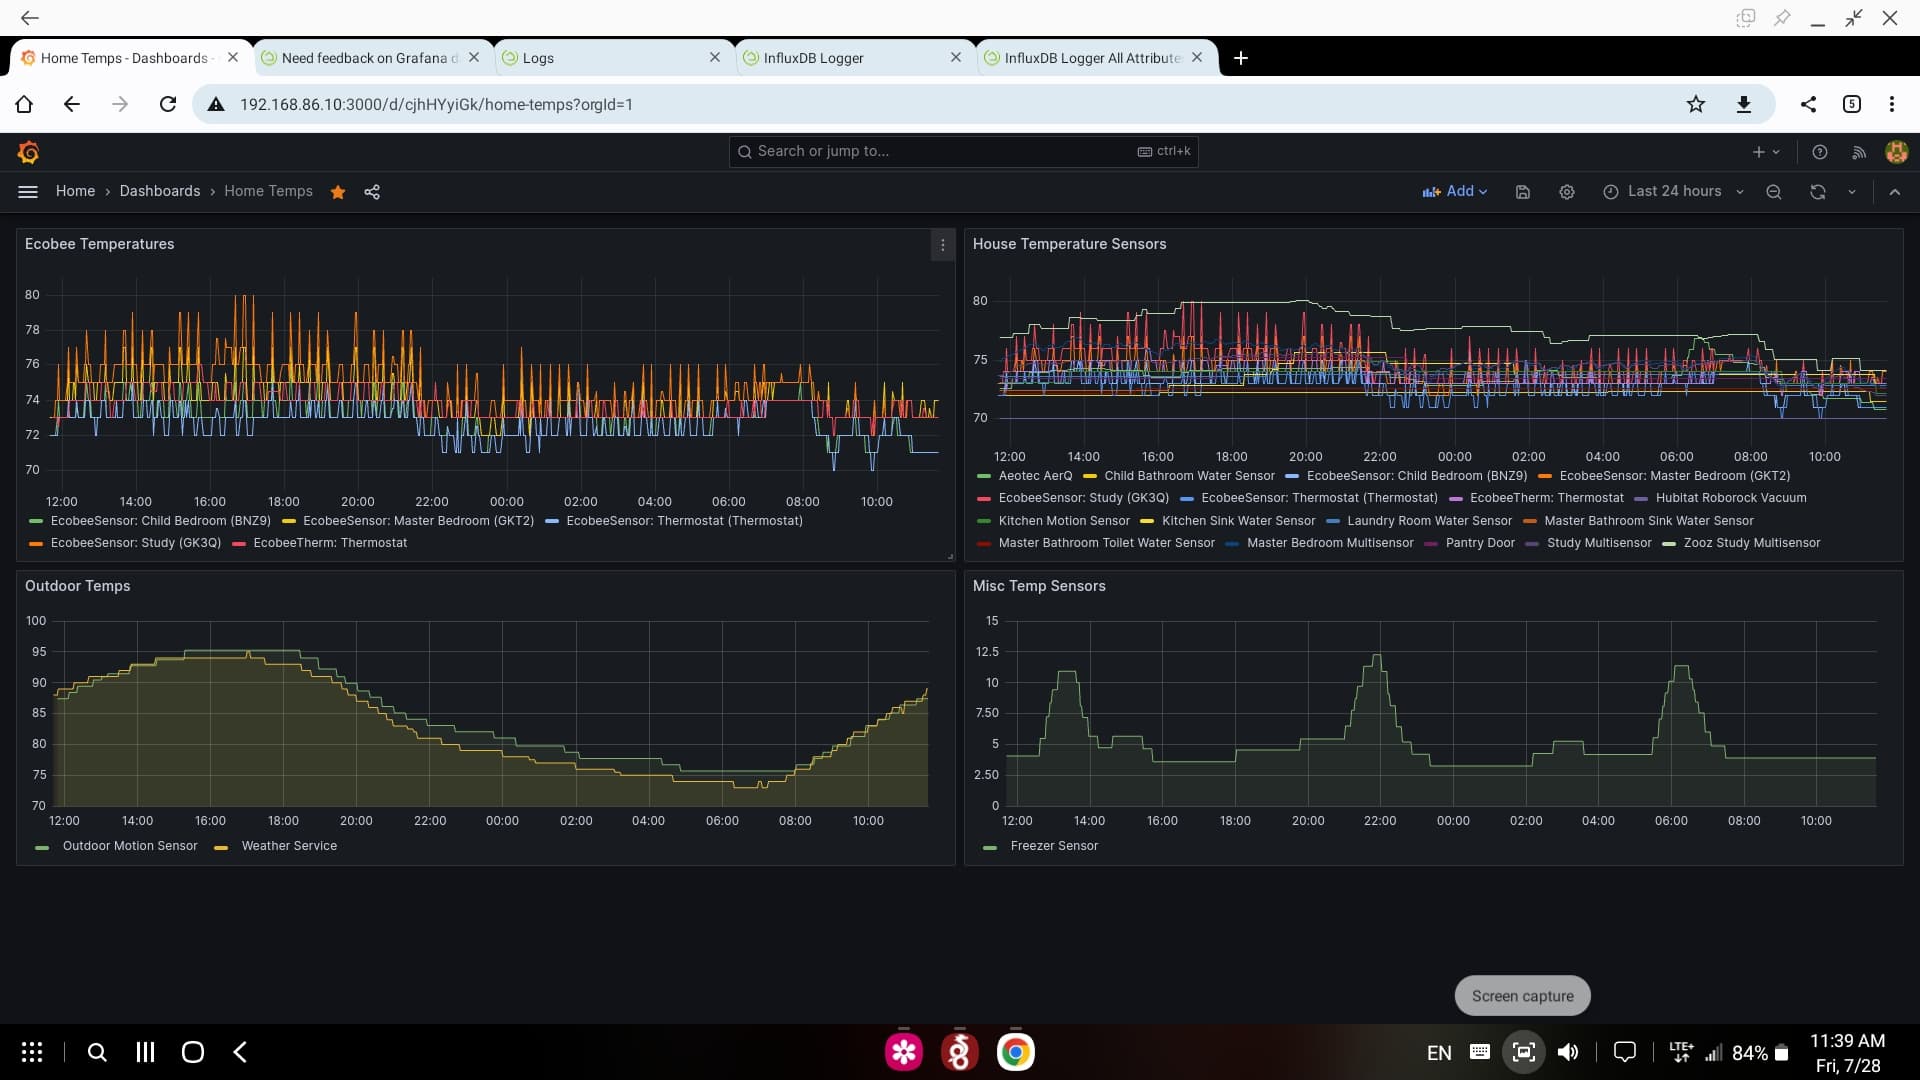
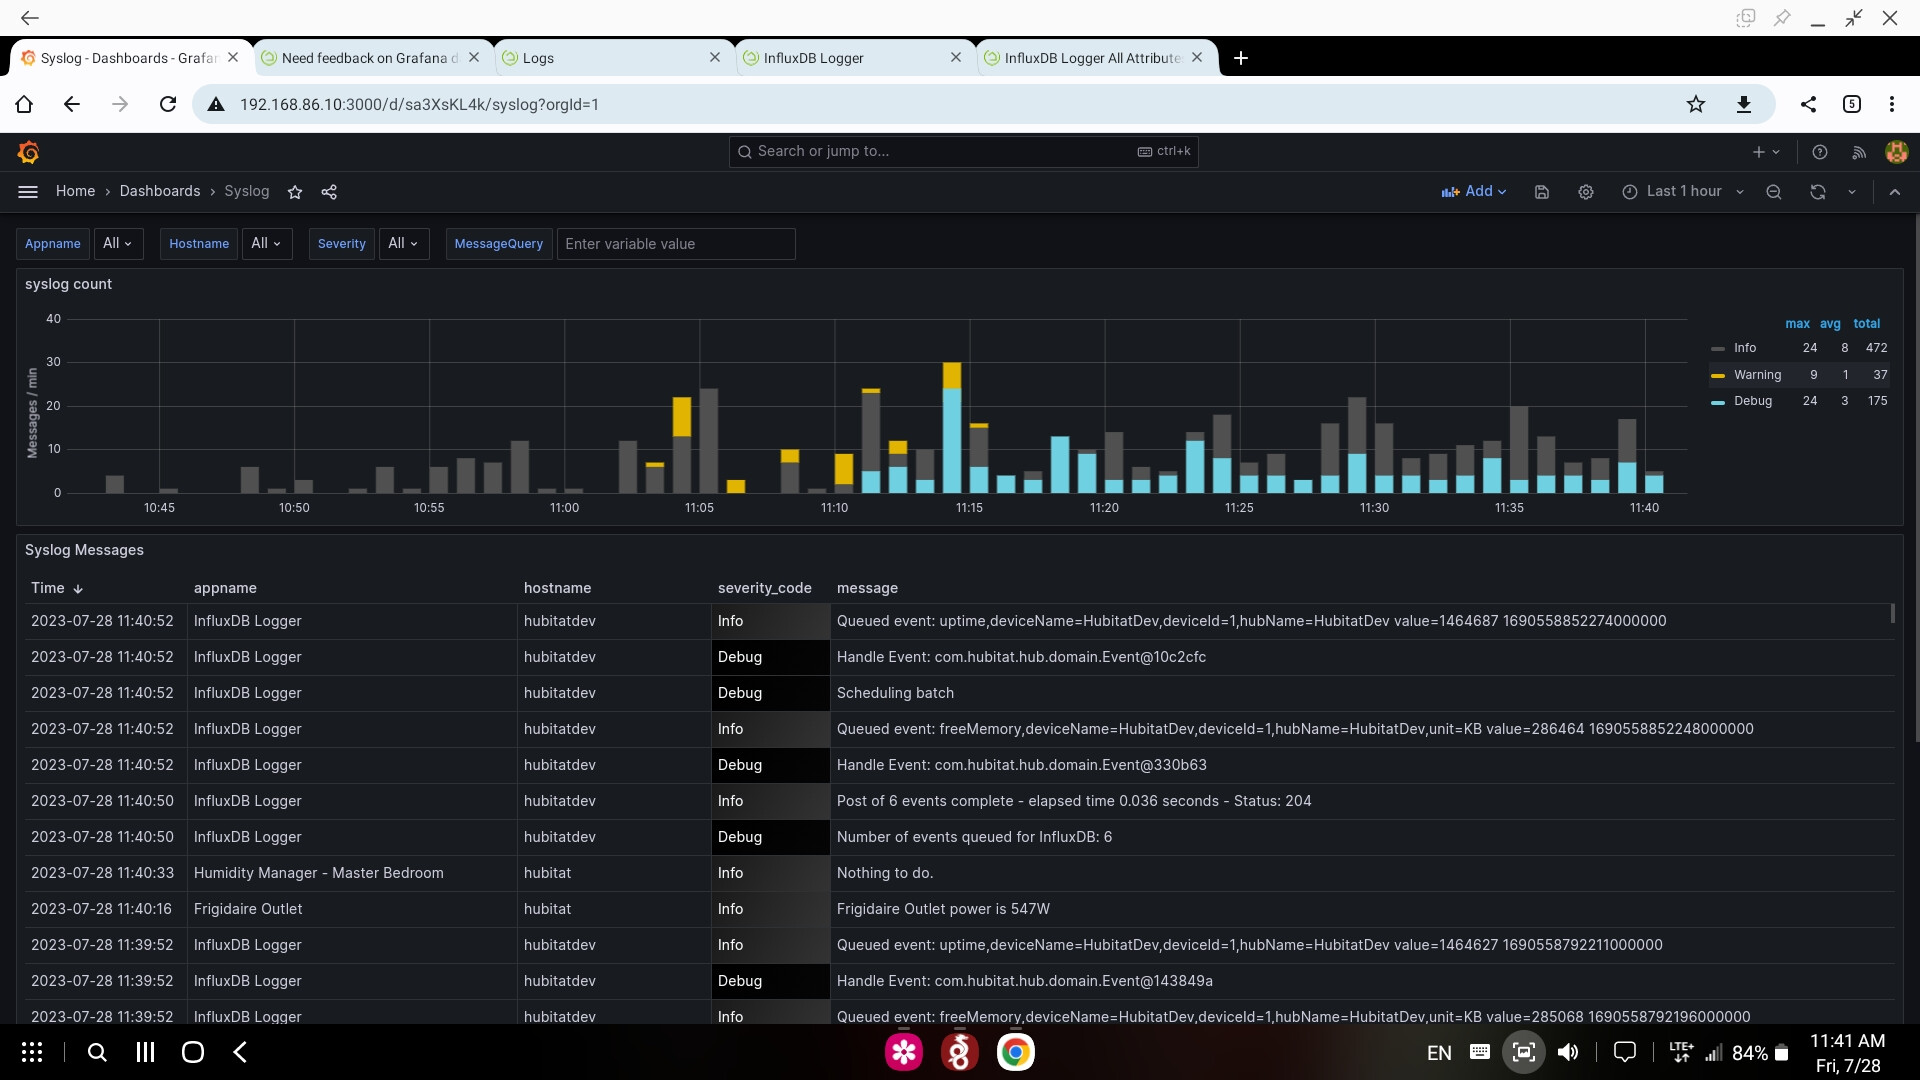
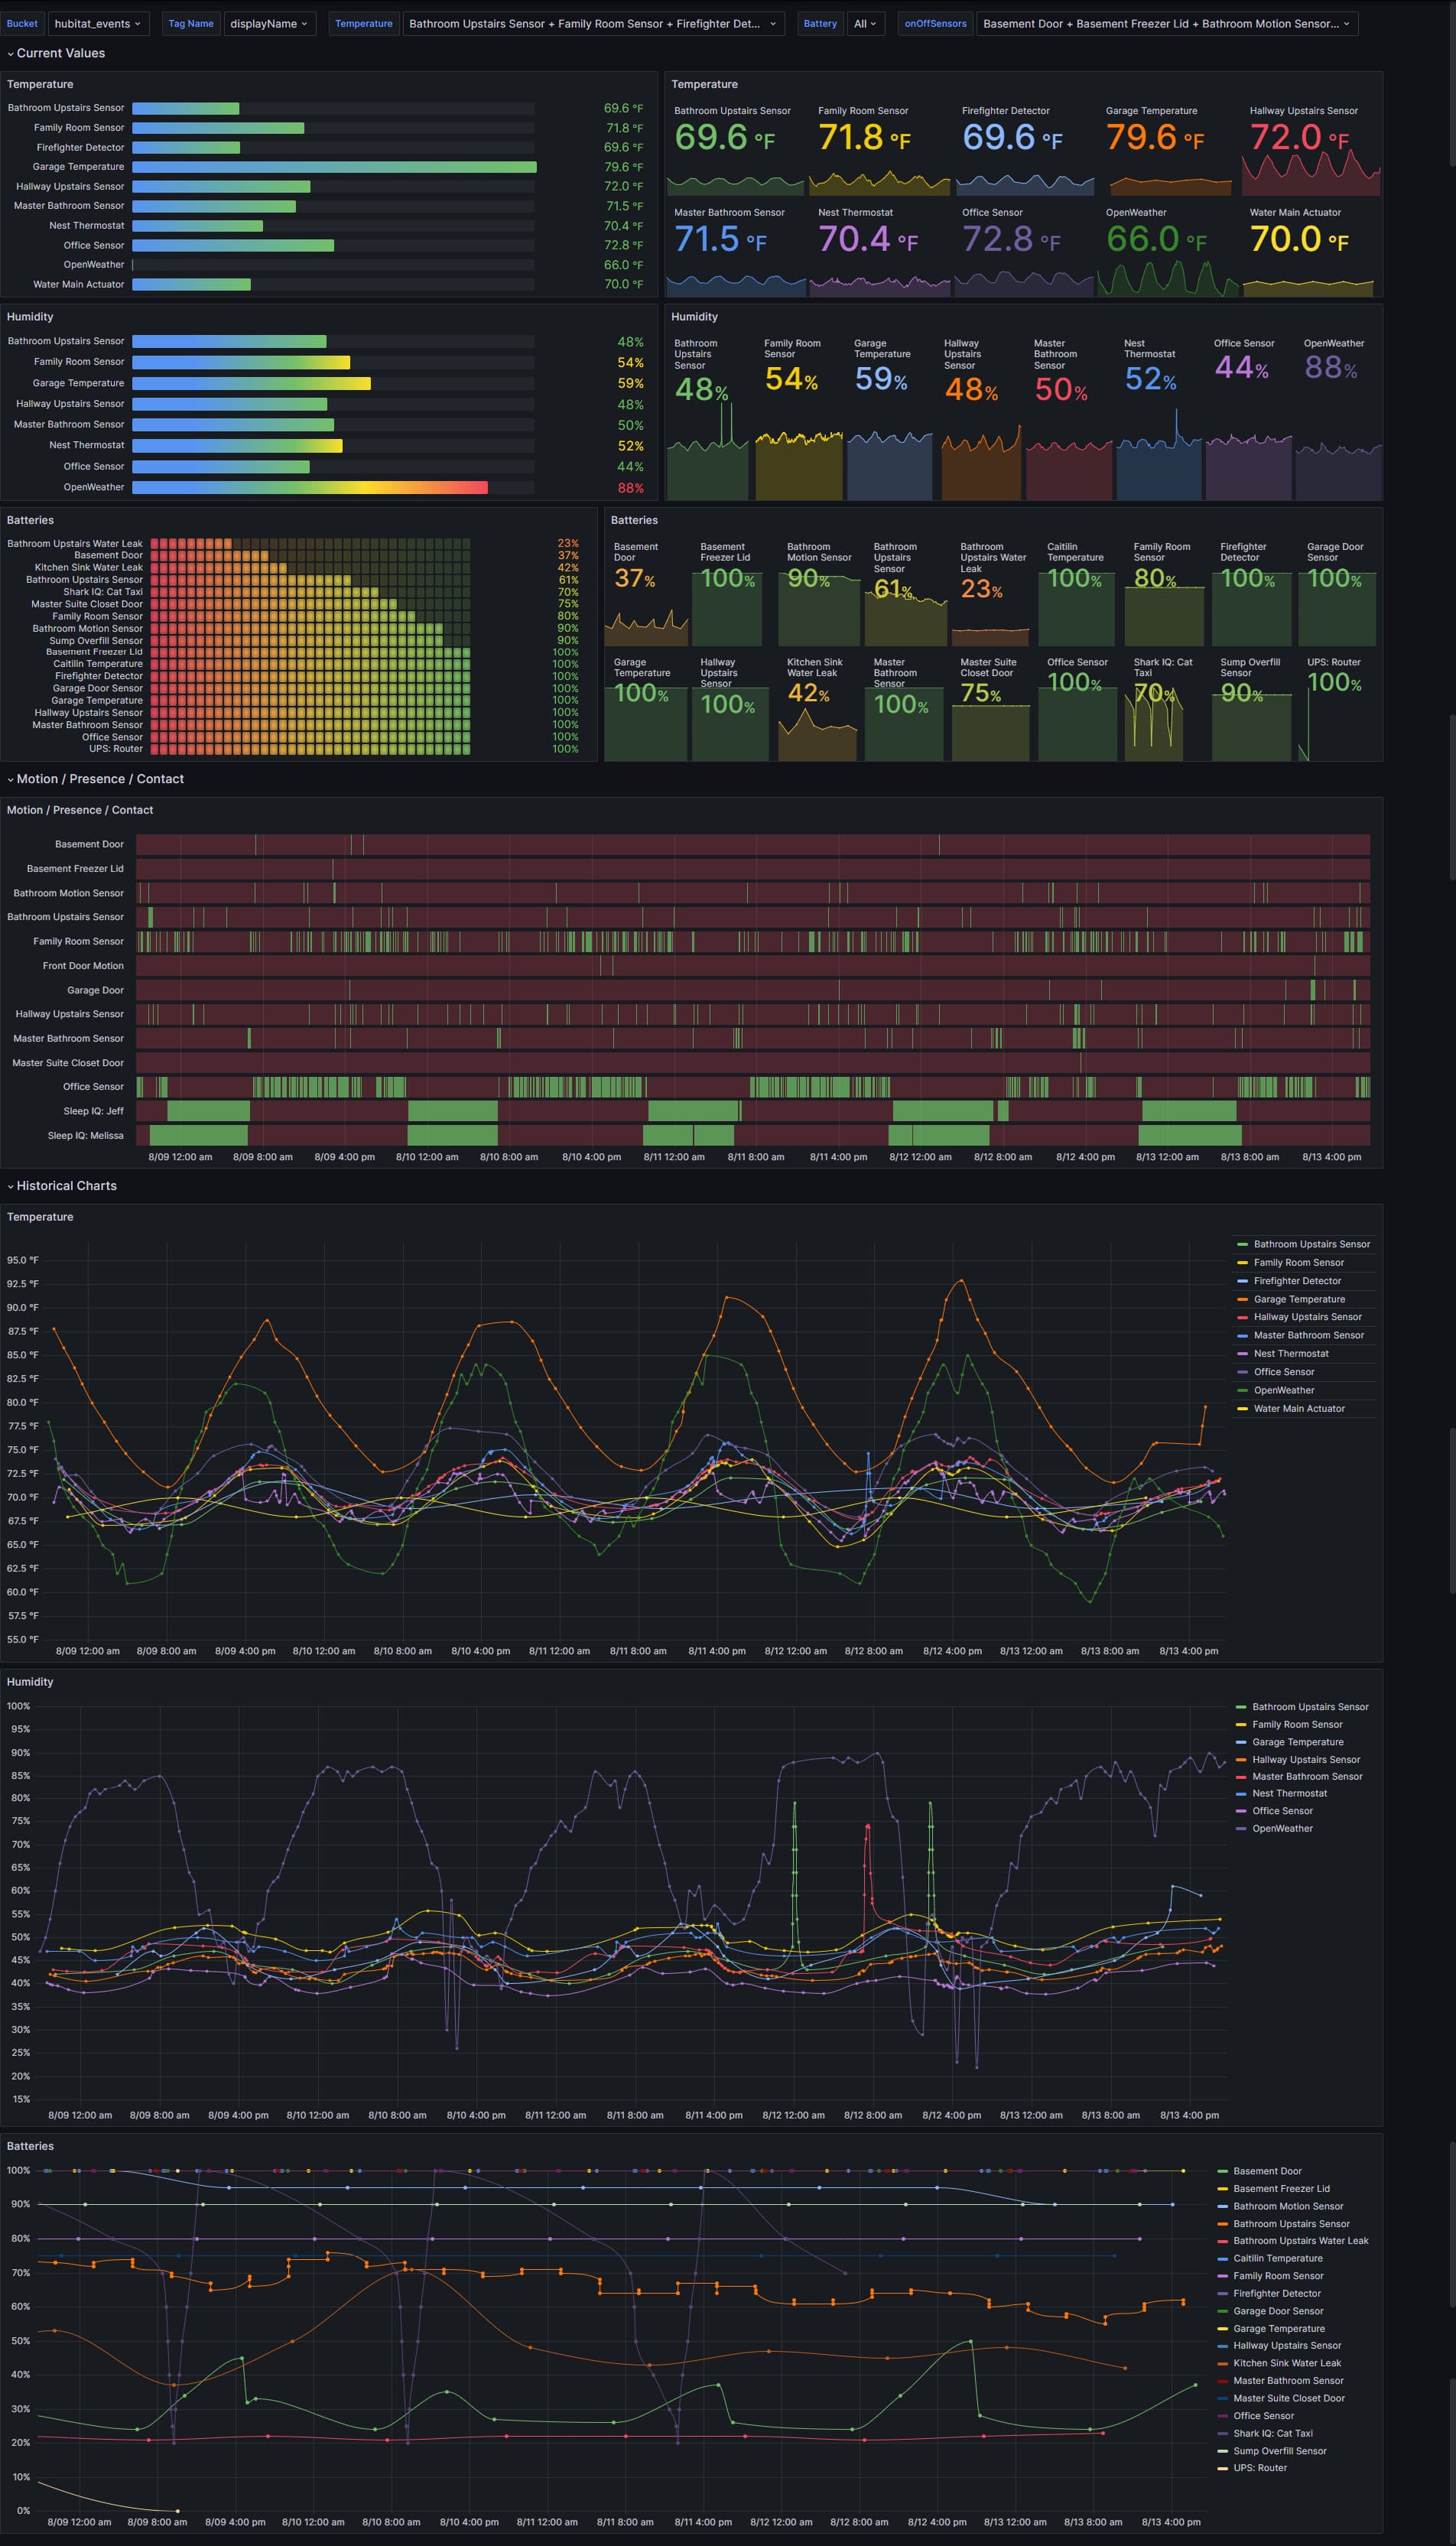
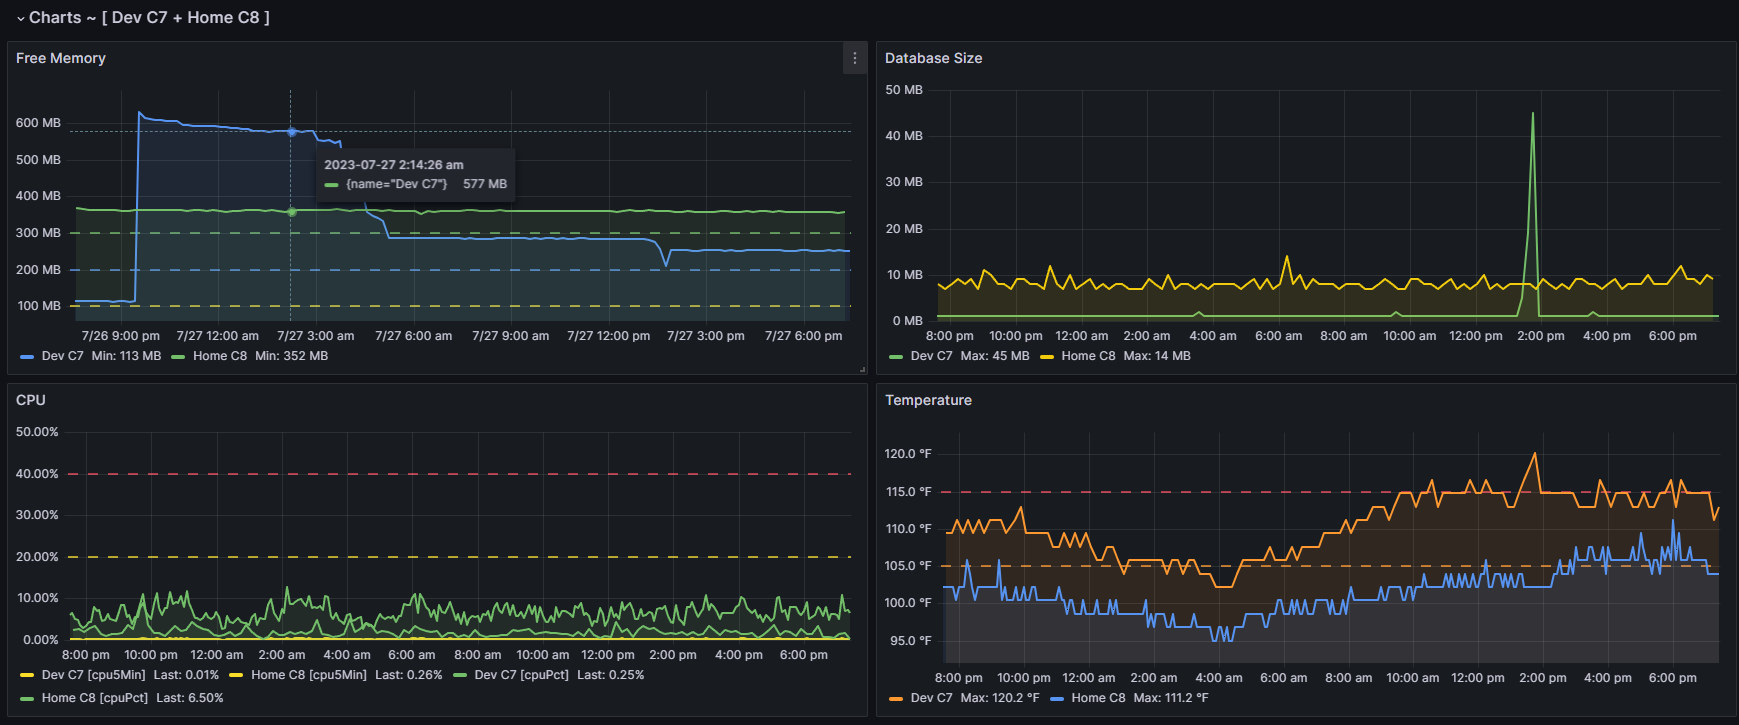
You have encouraged me to dig into setting up variables in InfluxQL in grafana. This morning I was able to set it up on a few of them.

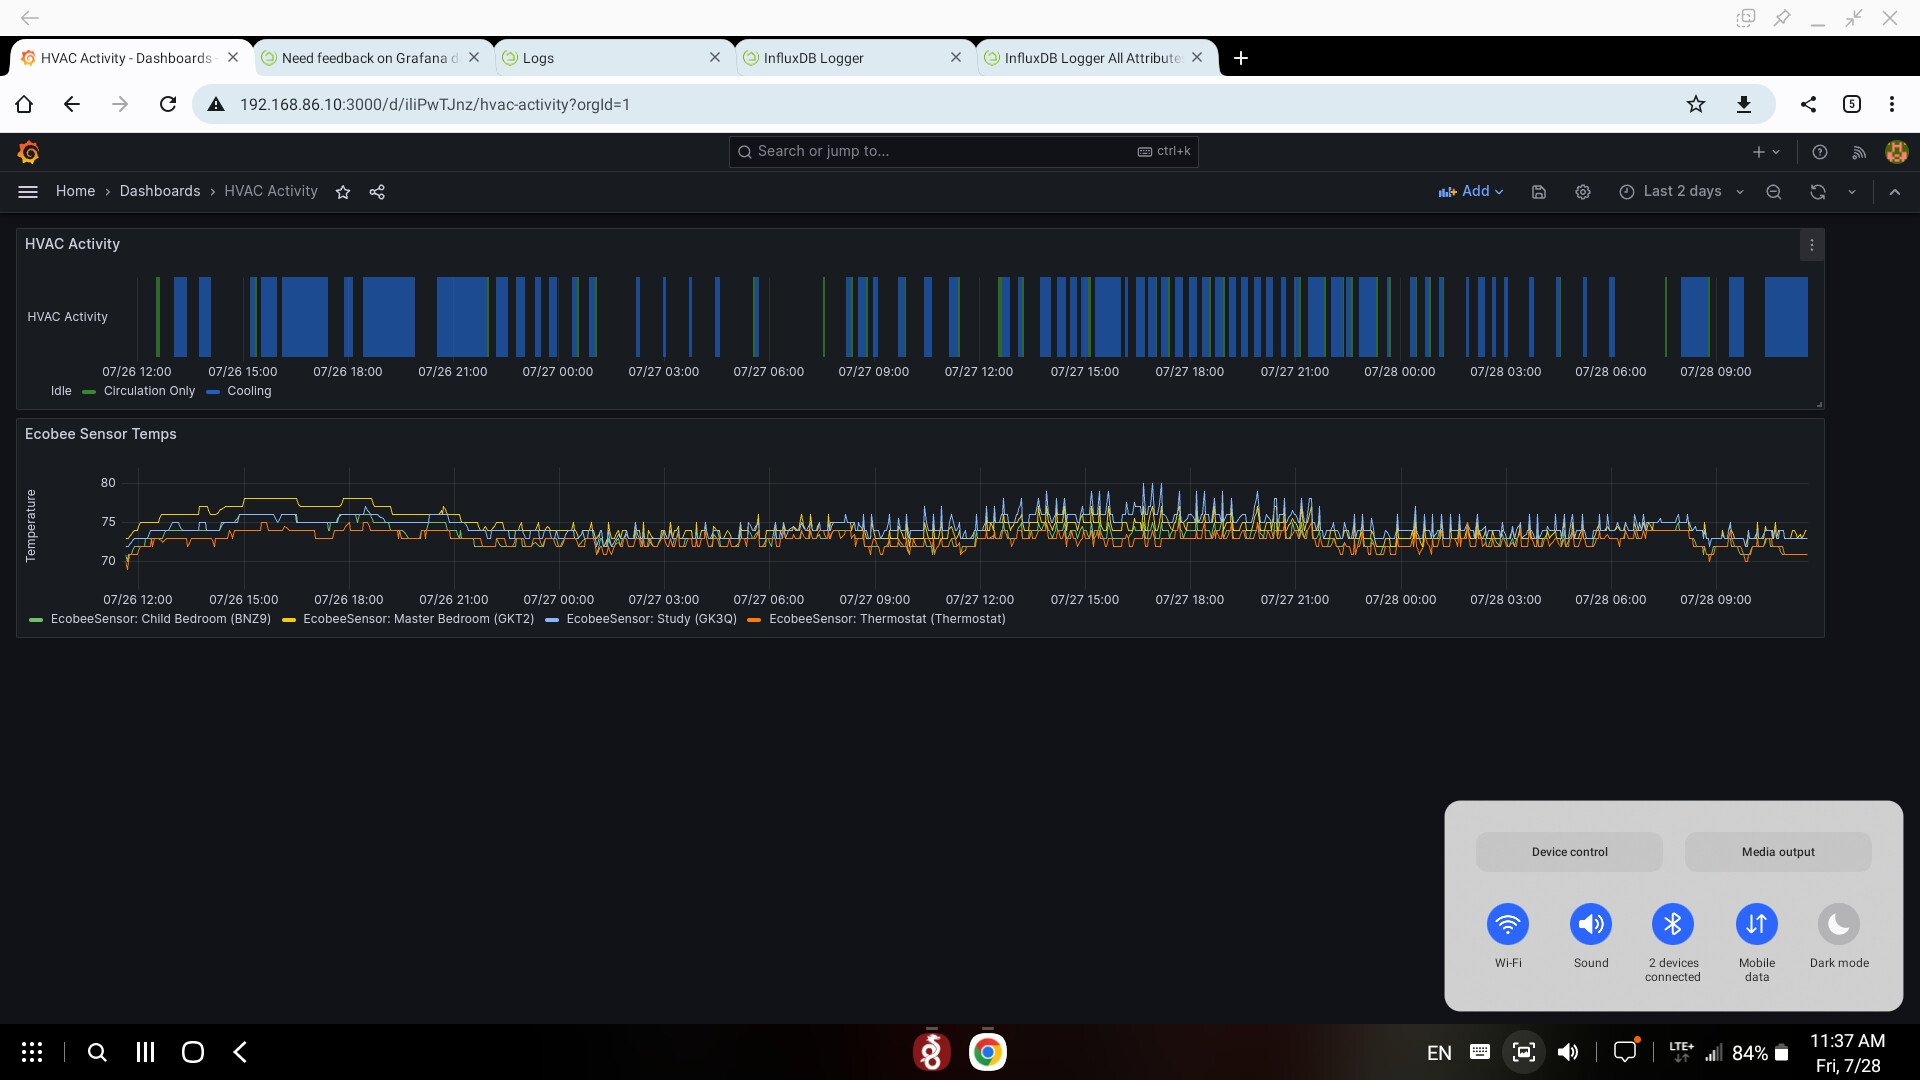
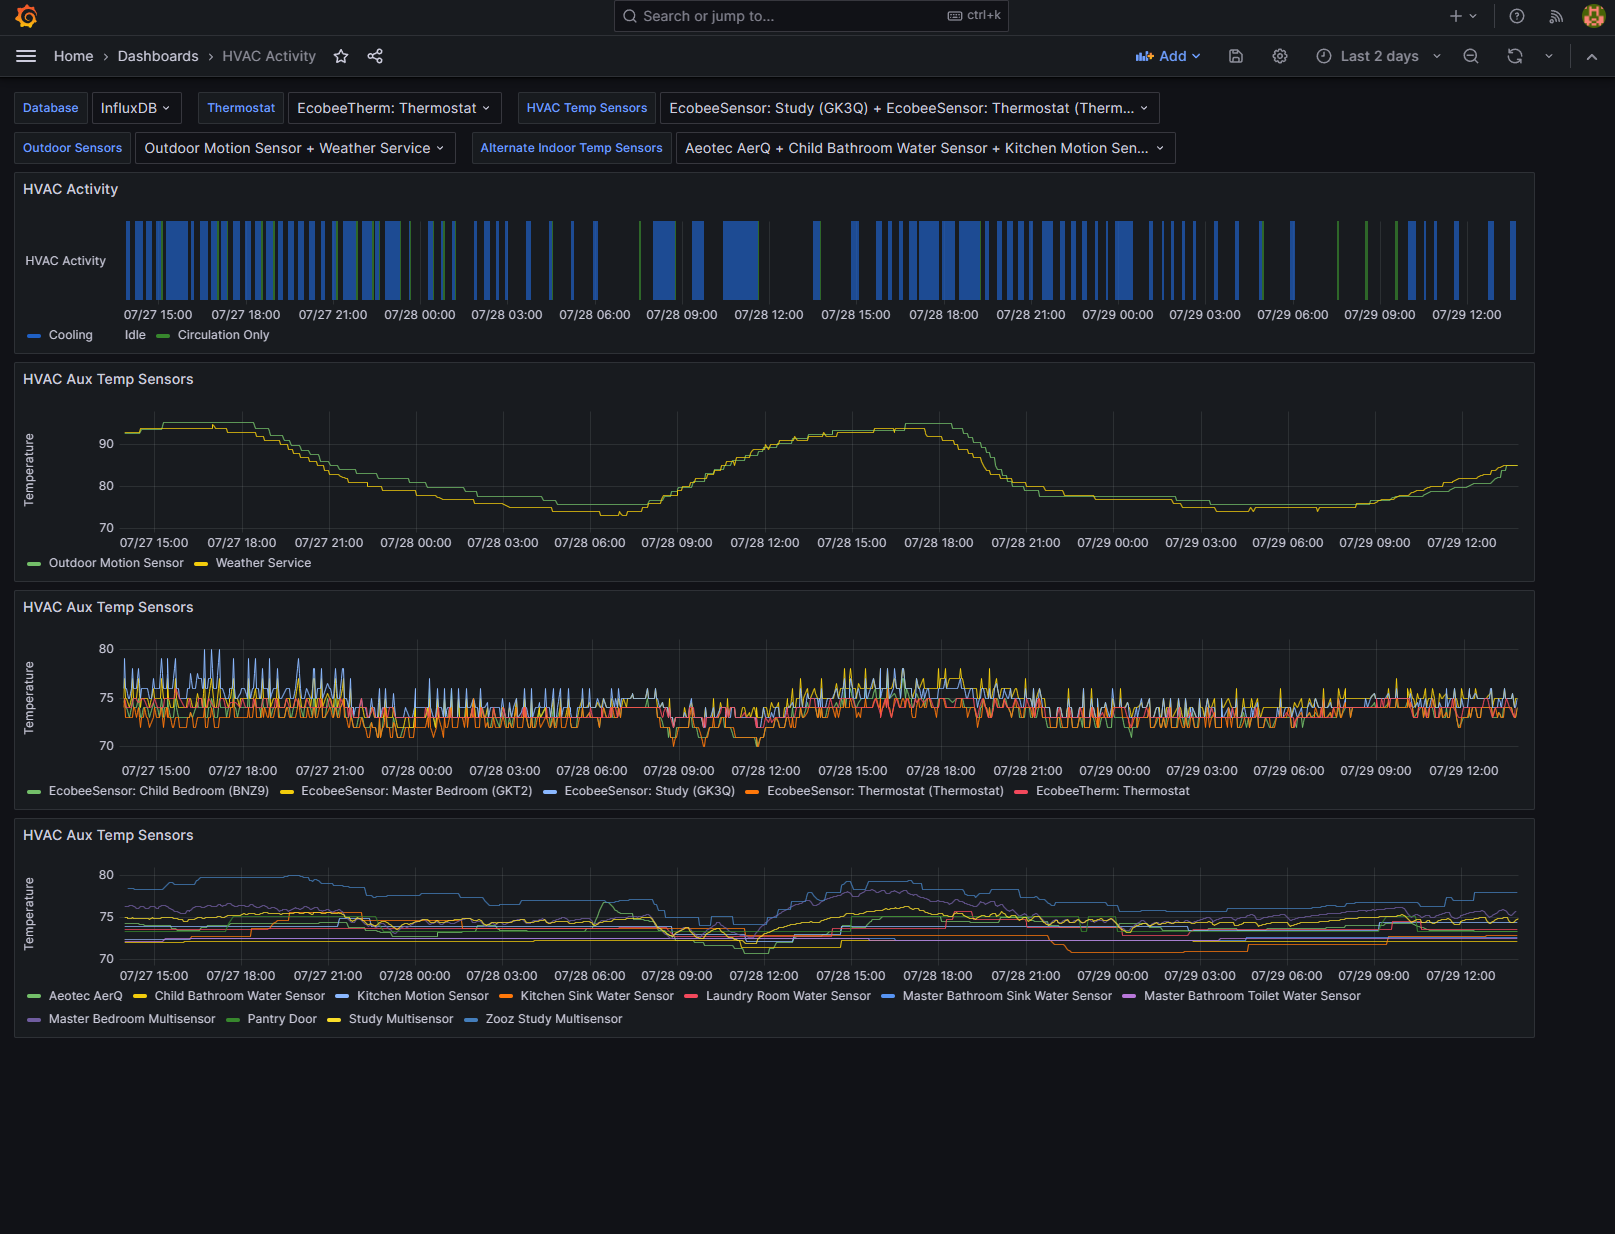
The HVAC graph was just kind of a experiment similarly, i have a graph that shows the state of motion sensors.

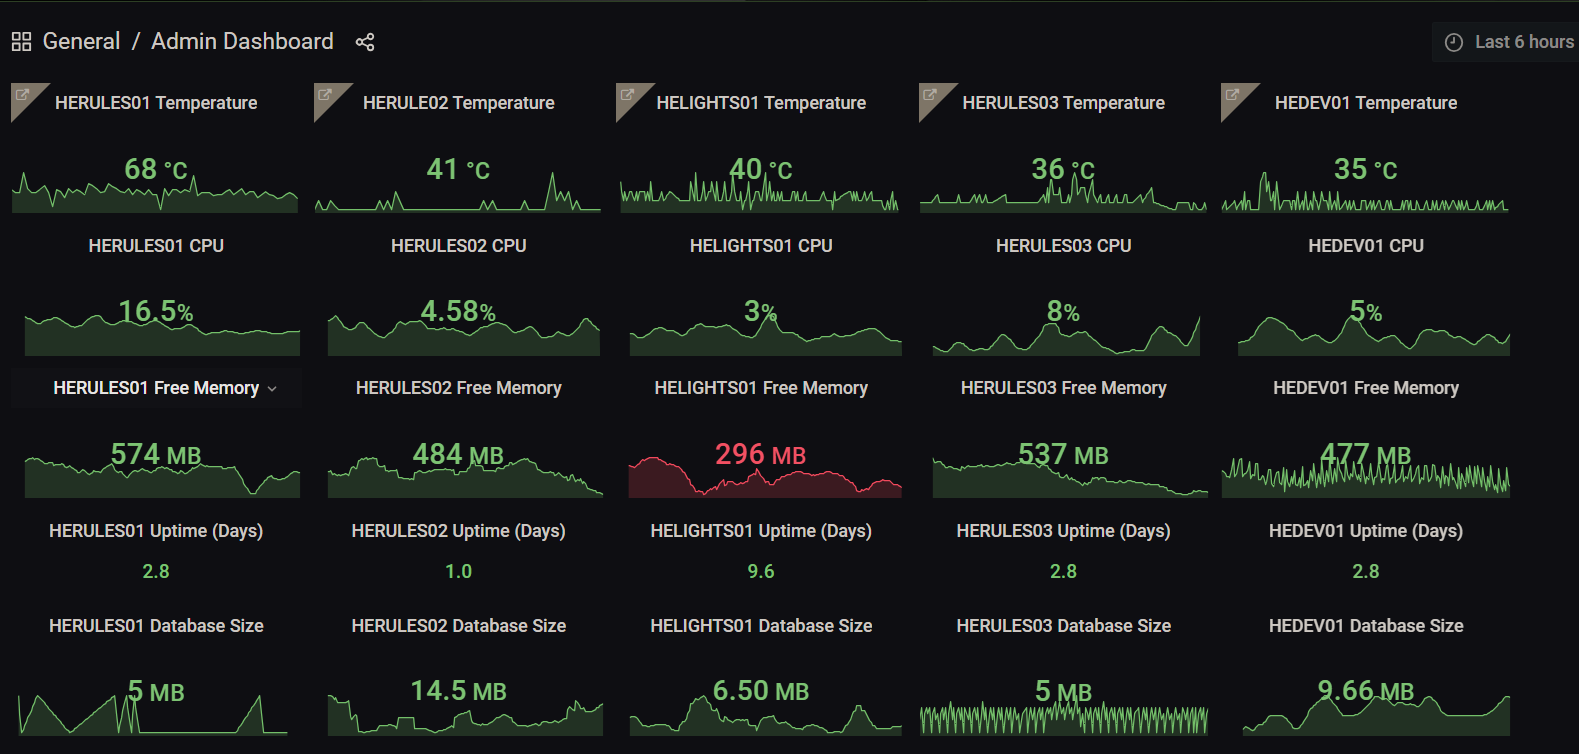
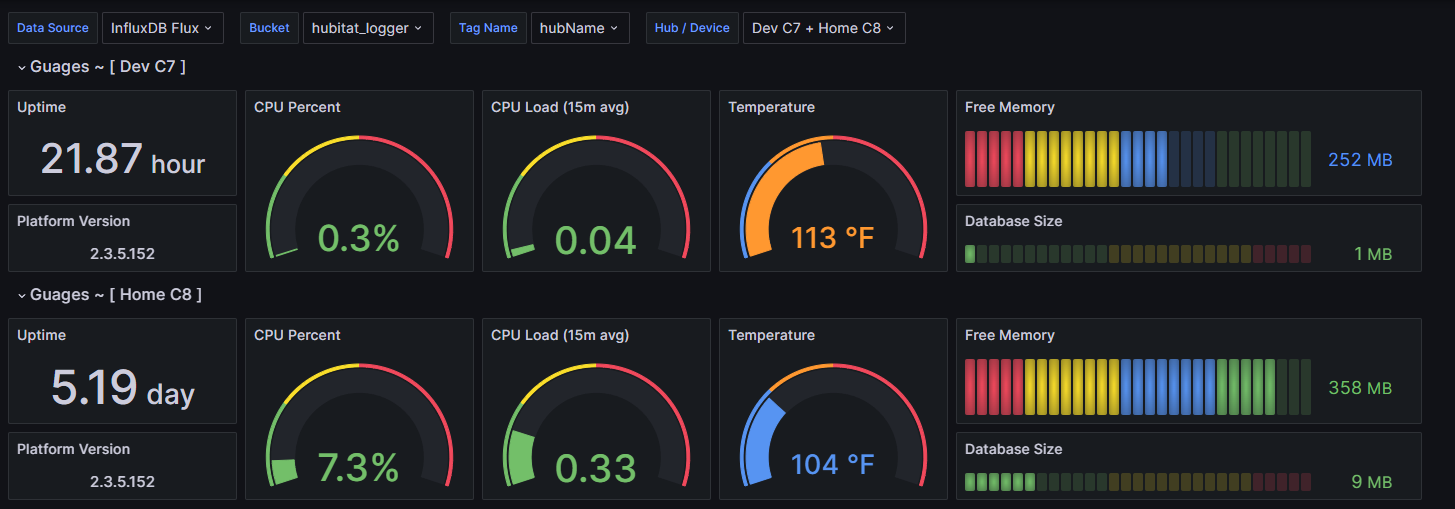
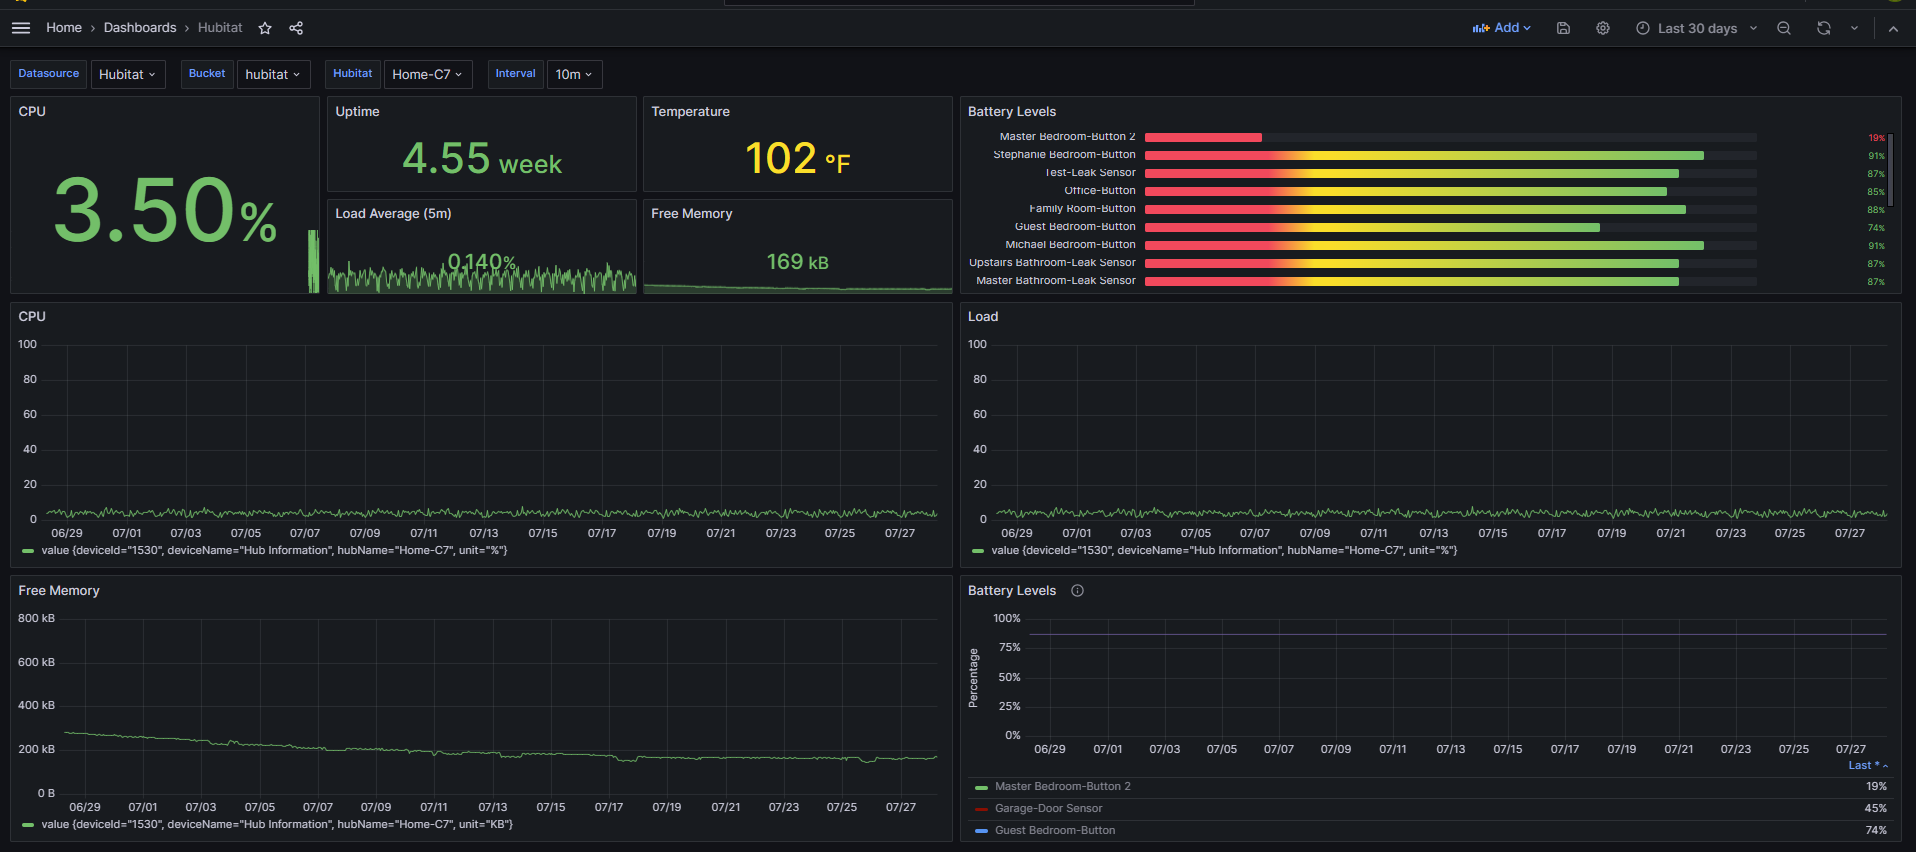
It shouldn't be to hard to add those other stats to the HVAC activity graph, I really like what you have done with the Hub Info dashboard.

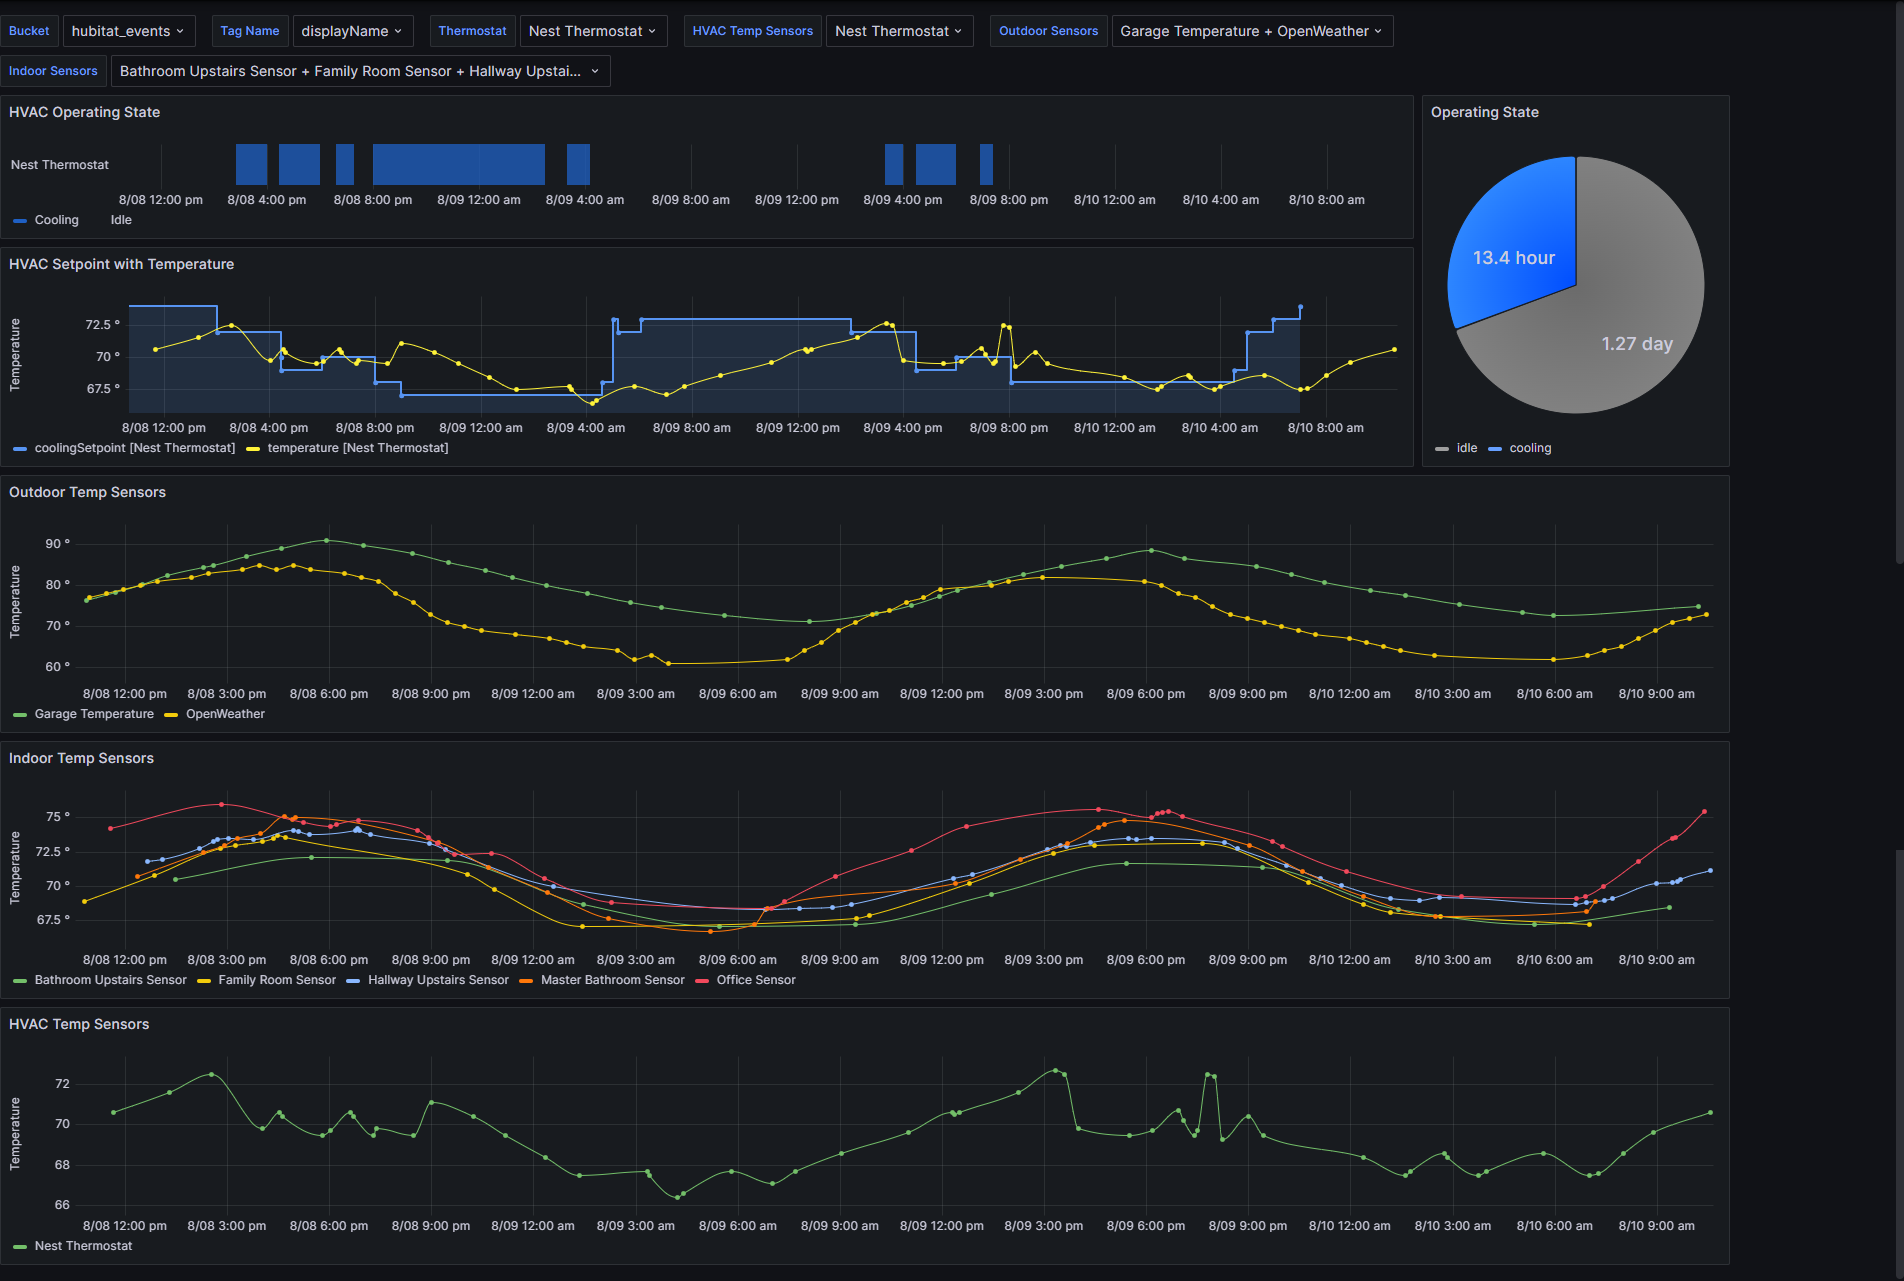
Here is that HVAC activity Dashboard updated as i think you suggested. It I put the outdoor temp near the top with the HVAC Activity so you can see how the outside temp effects it's run times and such. One catch is that this is still using InfluxQL for the backend query.

{
  "__inputs": [
    {
      "name": "DS_INFLUXDB",
      "label": "InfluxDB",
      "description": "",
      "type": "datasource",
      "pluginId": "influxdb",
      "pluginName": "InfluxDB"
    }
  ],
  "__elements": {},
  "__requires": [
    {
      "type": "grafana",
      "id": "grafana",
      "name": "Grafana",
      "version": "10.0.3"
    },
    {
      "type": "datasource",
      "id": "influxdb",
      "name": "InfluxDB",
      "version": "1.0.0"
    },
    {
      "type": "panel",
      "id": "state-timeline",
      "name": "State timeline",
      "version": ""
    },
    {
      "type": "panel",
      "id": "timeseries",
      "name": "Time series",
      "version": ""
    }
  ],
  "annotations": {
    "list": [
      {
        "builtIn": 1,
        "datasource": {
          "type": "datasource",
          "uid": "grafana"
        },
        "enable": true,
        "hide": true,
        "iconColor": "rgba(0, 211, 255, 1)",
        "name": "Annotations & Alerts",
        "target": {
          "limit": 100,
          "matchAny": false,
          "tags": [],
          "type": "dashboard"
        },
        "type": "dashboard"
      }
    ]
  },
  "editable": true,
  "fiscalYearStartMonth": 0,
  "graphTooltip": 0,
  "id": null,
  "links": [],
  "liveNow": false,
  "panels": [
    {
      "datasource": {
        "type": "influxdb",
        "uid": "${DS_INFLUXDB}"
      },
      "fieldConfig": {
        "defaults": {
          "color": {
            "mode": "fixed"
          },
          "custom": {
            "fillOpacity": 70,
            "lineWidth": 0,
            "spanNulls": false
          },
          "displayName": "HVAC Activity",
          "mappings": [
            {
              "options": {
                "cooling": {
                  "color": "dark-blue",
                  "index": 3,
                  "text": "Cooling"
                },
                "fan\\ only": {
                  "color": "dark-green",
                  "index": 2,
                  "text": "Circulation Only"
                },
                "heating": {
                  "color": "dark-red",
                  "index": 0,
                  "text": "Heating"
                },
                "idle": {
                  "color": "transparent",
                  "index": 1,
                  "text": "Idle"
                }
              },
              "type": "value"
            }
          ],
          "thresholds": {
            "mode": "absolute",
            "steps": [
              {
                "color": "green",
                "value": null
              }
            ]
          }
        },
        "overrides": []
      },
      "gridPos": {
        "h": 5,
        "w": 23,
        "x": 0,
        "y": 0
      },
      "id": 2,
      "options": {
        "alignValue": "left",
        "legend": {
          "displayMode": "list",
          "placement": "bottom",
          "showLegend": true
        },
        "mergeValues": true,
        "rowHeight": 0.9,
        "showValue": "never",
        "tooltip": {
          "mode": "single",
          "sort": "none"
        }
      },
      "targets": [
        {
          "alias": "$tag_deviceName",
          "datasource": {
            "type": "influxdb",
            "uid": "${DS_INFLUXDB}"
          },
          "groupBy": [
            {
              "params": [
                "$__interval"
              ],
              "type": "time"
            },
            {
              "params": [
                "deviceName"
              ],
              "type": "tag"
            }
          ],
          "measurement": "thermostatOperatingState",
          "orderByTime": "ASC",
          "policy": "$datasource_InfluxDB",
          "refId": "A",
          "resultFormat": "time_series",
          "select": [
            [
              {
                "params": [
                  "value"
                ],
                "type": "field"
              },
              {
                "params": [],
                "type": "distinct"
              }
            ]
          ],
          "tags": [
            {
              "key": "deviceName",
              "operator": "=~",
              "value": "/^$thermostat$/"
            }
          ]
        }
      ],
      "title": "HVAC Activity",
      "type": "state-timeline"
    },
    {
      "datasource": {
        "type": "influxdb",
        "uid": "${DS_INFLUXDB}"
      },
      "fieldConfig": {
        "defaults": {
          "color": {
            "mode": "palette-classic"
          },
          "custom": {
            "axisCenteredZero": false,
            "axisColorMode": "text",
            "axisLabel": "Temperature",
            "axisPlacement": "left",
            "axisWidth": 80,
            "barAlignment": 0,
            "drawStyle": "line",
            "fillOpacity": 0,
            "gradientMode": "none",
            "hideFrom": {
              "legend": false,
              "tooltip": false,
              "viz": false
            },
            "lineInterpolation": "linear",
            "lineWidth": 1,
            "pointSize": 5,
            "scaleDistribution": {
              "type": "linear"
            },
            "showPoints": "auto",
            "spanNulls": false,
            "stacking": {
              "group": "A",
              "mode": "none"
            },
            "thresholdsStyle": {
              "mode": "off"
            }
          },
          "mappings": [],
          "thresholds": {
            "mode": "absolute",
            "steps": [
              {
                "color": "green",
                "value": null
              },
              {
                "color": "red",
                "value": 80
              }
            ]
          }
        },
        "overrides": []
      },
      "gridPos": {
        "h": 6,
        "w": 23,
        "x": 0,
        "y": 5
      },
      "id": 4,
      "options": {
        "legend": {
          "calcs": [],
          "displayMode": "list",
          "placement": "bottom",
          "showLegend": true
        },
        "tooltip": {
          "mode": "single",
          "sort": "none"
        }
      },
      "targets": [
        {
          "alias": "$tag_deviceName",
          "datasource": {
            "type": "influxdb",
            "uid": "${DS_INFLUXDB}"
          },
          "groupBy": [
            {
              "params": [
                "$__interval"
              ],
              "type": "time"
            },
            {
              "params": [
                "deviceName"
              ],
              "type": "tag"
            },
            {
              "params": [
                "linear"
              ],
              "type": "fill"
            }
          ],
          "measurement": "temperature",
          "orderByTime": "ASC",
          "policy": "$datasource_InfluxDB",
          "refId": "A",
          "resultFormat": "time_series",
          "select": [
            [
              {
                "params": [
                  "value"
                ],
                "type": "field"
              },
              {
                "params": [],
                "type": "mean"
              }
            ]
          ],
          "tags": [
            {
              "key": "deviceName",
              "operator": "=~",
              "value": "/^$outdoor_Temp_Sensors$/"
            }
          ]
        }
      ],
      "title": "HVAC Aux Temp Sensors",
      "type": "timeseries"
    },
    {
      "datasource": {
        "type": "influxdb",
        "uid": "${DS_INFLUXDB}"
      },
      "fieldConfig": {
        "defaults": {
          "color": {
            "mode": "palette-classic"
          },
          "custom": {
            "axisCenteredZero": false,
            "axisColorMode": "text",
            "axisLabel": "Temperature",
            "axisPlacement": "left",
            "axisWidth": 80,
            "barAlignment": 0,
            "drawStyle": "line",
            "fillOpacity": 0,
            "gradientMode": "none",
            "hideFrom": {
              "legend": false,
              "tooltip": false,
              "viz": false
            },
            "lineInterpolation": "linear",
            "lineWidth": 1,
            "pointSize": 5,
            "scaleDistribution": {
              "type": "linear"
            },
            "showPoints": "auto",
            "spanNulls": false,
            "stacking": {
              "group": "A",
              "mode": "none"
            },
            "thresholdsStyle": {
              "mode": "off"
            }
          },
          "mappings": [],
          "thresholds": {
            "mode": "absolute",
            "steps": [
              {
                "color": "green",
                "value": null
              },
              {
                "color": "red",
                "value": 80
              }
            ]
          }
        },
        "overrides": []
      },
      "gridPos": {
        "h": 6,
        "w": 23,
        "x": 0,
        "y": 11
      },
      "id": 5,
      "options": {
        "legend": {
          "calcs": [],
          "displayMode": "list",
          "placement": "bottom",
          "showLegend": true
        },
        "tooltip": {
          "mode": "single",
          "sort": "none"
        }
      },
      "targets": [
        {
          "alias": "$tag_deviceName",
          "datasource": {
            "type": "influxdb",
            "uid": "${DS_INFLUXDB}"
          },
          "groupBy": [
            {
              "params": [
                "$__interval"
              ],
              "type": "time"
            },
            {
              "params": [
                "deviceName"
              ],
              "type": "tag"
            },
            {
              "params": [
                "linear"
              ],
              "type": "fill"
            }
          ],
          "measurement": "temperature",
          "orderByTime": "ASC",
          "policy": "$datasource_InfluxDB",
          "refId": "A",
          "resultFormat": "time_series",
          "select": [
            [
              {
                "params": [
                  "value"
                ],
                "type": "field"
              },
              {
                "params": [],
                "type": "mean"
              }
            ]
          ],
          "tags": [
            {
              "key": "deviceName",
              "operator": "=~",
              "value": "/^$hvac_temp_Sensors$/"
            }
          ]
        }
      ],
      "title": "HVAC Aux Temp Sensors",
      "type": "timeseries"
    },
    {
      "datasource": {
        "type": "influxdb",
        "uid": "${DS_INFLUXDB}"
      },
      "fieldConfig": {
        "defaults": {
          "color": {
            "mode": "palette-classic"
          },
          "custom": {
            "axisCenteredZero": false,
            "axisColorMode": "text",
            "axisLabel": "Temperature",
            "axisPlacement": "left",
            "axisWidth": 80,
            "barAlignment": 0,
            "drawStyle": "line",
            "fillOpacity": 0,
            "gradientMode": "none",
            "hideFrom": {
              "legend": false,
              "tooltip": false,
              "viz": false
            },
            "lineInterpolation": "linear",
            "lineWidth": 1,
            "pointSize": 5,
            "scaleDistribution": {
              "type": "linear"
            },
            "showPoints": "auto",
            "spanNulls": false,
            "stacking": {
              "group": "A",
              "mode": "none"
            },
            "thresholdsStyle": {
              "mode": "off"
            }
          },
          "mappings": [],
          "thresholds": {
            "mode": "absolute",
            "steps": [
              {
                "color": "green",
                "value": null
              },
              {
                "color": "red",
                "value": 80
              }
            ]
          }
        },
        "overrides": []
      },
      "gridPos": {
        "h": 6,
        "w": 23,
        "x": 0,
        "y": 17
      },
      "id": 6,
      "options": {
        "legend": {
          "calcs": [],
          "displayMode": "list",
          "placement": "bottom",
          "showLegend": true
        },
        "tooltip": {
          "mode": "single",
          "sort": "none"
        }
      },
      "targets": [
        {
          "alias": "$tag_deviceName",
          "datasource": {
            "type": "influxdb",
            "uid": "${DS_INFLUXDB}"
          },
          "groupBy": [
            {
              "params": [
                "$__interval"
              ],
              "type": "time"
            },
            {
              "params": [
                "deviceName"
              ],
              "type": "tag"
            },
            {
              "params": [
                "linear"
              ],
              "type": "fill"
            }
          ],
          "measurement": "temperature",
          "orderByTime": "ASC",
          "policy": "$datasource_InfluxDB",
          "refId": "A",
          "resultFormat": "time_series",
          "select": [
            [
              {
                "params": [
                  "value"
                ],
                "type": "field"
              },
              {
                "params": [],
                "type": "mean"
              }
            ]
          ],
          "tags": [
            {
              "key": "deviceName",
              "operator": "=~",
              "value": "/^$alt_Indoor_Temp$/"
            }
          ]
        }
      ],
      "title": "HVAC Aux Temp Sensors",
      "type": "timeseries"
    }
  ],
  "refresh": "",
  "schemaVersion": 38,
  "style": "dark",
  "tags": [],
  "templating": {
    "list": [
      {
        "current": {
          "selected": false,
          "text": "InfluxDB",
          "value": "InfluxDB"
        },
        "hide": 0,
        "includeAll": false,
        "label": "Database",
        "multi": false,
        "name": "datasource_InfluxDB",
        "options": [],
        "query": "influxdb",
        "queryValue": "",
        "refresh": 1,
        "regex": "",
        "skipUrlSync": false,
        "type": "datasource"
      },
      {
        "current": {},
        "datasource": {
          "type": "influxdb",
          "uid": "${DS_INFLUXDB}"
        },
        "definition": "select DISTINCT(\"deviceName\") FROM (select * from \"thermostatMode\" where $timeFilter)",
        "hide": 0,
        "includeAll": false,
        "label": "Thermostat",
        "multi": true,
        "name": "thermostat",
        "options": [],
        "query": "select DISTINCT(\"deviceName\") FROM (select * from \"thermostatMode\" where $timeFilter)",
        "refresh": 1,
        "regex": "",
        "skipUrlSync": false,
        "sort": 0,
        "type": "query"
      },
      {
        "current": {},
        "datasource": {
          "type": "influxdb",
          "uid": "${DS_INFLUXDB}"
        },
        "definition": "select DISTINCT(\"deviceName\") FROM (select * from \"temperature\" where $timeFilter)",
        "hide": 0,
        "includeAll": false,
        "label": "HVAC Temp Sensors",
        "multi": true,
        "name": "hvac_temp_Sensors",
        "options": [],
        "query": "select DISTINCT(\"deviceName\") FROM (select * from \"temperature\" where $timeFilter)",
        "refresh": 1,
        "regex": "",
        "skipUrlSync": false,
        "sort": 0,
        "type": "query"
      },
      {
        "current": {},
        "datasource": {
          "type": "influxdb",
          "uid": "${DS_INFLUXDB}"
        },
        "definition": "select DISTINCT(\"deviceName\") FROM (select * from \"temperature\" where $timeFilter)",
        "hide": 0,
        "includeAll": false,
        "label": "Outdoor Sensors",
        "multi": true,
        "name": "outdoor_Temp_Sensors",
        "options": [],
        "query": "select DISTINCT(\"deviceName\") FROM (select * from \"temperature\" where $timeFilter)",
        "refresh": 1,
        "regex": "",
        "skipUrlSync": false,
        "sort": 0,
        "type": "query"
      },
      {
        "current": {},
        "datasource": {
          "type": "influxdb",
          "uid": "${DS_INFLUXDB}"
        },
        "definition": "select DISTINCT(\"deviceName\") FROM (select * from \"temperature\" where $timeFilter)",
        "hide": 0,
        "includeAll": false,
        "label": "Alternate Indoor Temp Sensors",
        "multi": true,
        "name": "alt_Indoor_Temp",
        "options": [],
        "query": "select DISTINCT(\"deviceName\") FROM (select * from \"temperature\" where $timeFilter)",
        "refresh": 1,
        "regex": "",
        "skipUrlSync": false,
        "sort": 0,
        "type": "query"
      }
    ]
  },
  "time": {
    "from": "now-2d",
    "to": "now"
  },
  "timepicker": {},
  "timezone": "",
  "title": "HVAC Activity",
  "uid": "iliPwTJnz",
  "version": 25,
  "weekStart": ""
}
1 Like