For right now this will just be a consolidation of all of the help topics I have provided to others or has been provided to me. I will clean this up to where it flows better in abit.
Introduction to the InfluxDB, Grafana, InfluxDB Logger Stack
We have the great home automation systems that generate a ton of actions off of events that occur around our home. These events are datapoints we may want to be able to see on occasion. By using the InfluxDB as a backend database to store our data, Grafana to visualize it and InfluxDB Logger to extract the event data from the Hubitat Hub we can do just that. So what are these parts.
“InfluxDB” is a enterprise level database that is designed specifically for “Time-Series” data. Unlike some databases it excels with this kind of data in a low resource environment. For that reason it has become a very popular tool in this kind of setup.
“Grafana” is a enterprise level visualization tool for displaying various data stored in databases. This is a really powerful tool for taking raw dating and creating the beautiful graphs we like to see.
“InfluxDB Logger” is a home automation smart app that was originally written by Codersaur for the Smartthings environment. It has since been ported to Hubitat and further refined by several developers over the last few years. Currently it is maintained by @dennypage with contributions by others. Denny has done a great job of ensuring it’s stability and viability going forward.
So this combination of tools allows us to capture the data in HE, store them in a very robust database, and then visualize them so we can use them later.
What do you need to get started
Each of these tools are completely independent of each other so there are some options on how you can set these up. I will address each of them independently.
InfluxDB
InfluxDB has 2 real options for install
InfluxDB OSS
InfluxDB Cloud
InfluxDB OSS is a local install running on a always on computer like a server, computer, or even a Raspberry Pi. Yes it can run fine on a Raspberry pi and in many cases is preferred due to lower power needes
InfluxDB Cloud on the other hand is as stated a cloud solution were you don’t install anything, but setup a Cloud account with InfluxDB. They even have a free teir account so you could end up spending nothing for this service
Each has their own pro’s and cons. The cloud account is nice because of the simplicity of setup, and you don’t need to maintain an always on system. It also means you don’t have full control of your data as it isn’t in your possession at all times. You are also subject to Cloud limitations like Rate limits and simply how they maintain their server.
The biggest pro to running your own server is that put you in complete control and you keep your data local. The biggest con is simply put all of the problems fall on you to resolve. You also have to manage and take care of the computer.
My personal suggestion would be to use the Cloud option as long as it meets your needs and you don’t have the means to run your own always on computer. It is hard to beat having the pro’s deal with managing the infrastructure of your environment. If you have your own server, or out grow what they provide for free then you may want to consider moving to a different option.
The big limitation for the Cloud free teir solution is it only keeps 30 Days of data.
That said using the cloud free tier is by far the easiest option to get setup and started fast. It really is as simple as a few clicks to create your account and a few more to setup the instance to collect data from HE and you are done.
Visualization
So I mentioned above that Grafana is a great graphing tool, but depending on what choice you made for how you want to run your InfluxDB there may be another option available. InfluxDB2.x comes with it’s own graphing engine built in. You may be able to create good simple dashboards with the built in engine that comes as part of the InfluxDB Cloud or OSS installs. You can certainly try it first and move to Grafana at a later time if you want to. I will provide a post for dashboard examples below.
That said I really prefer the robust abilities of Grafana. You can really create some fantastic visualizations and it is super flexible. Grafana could potentially be used for allot more then HE in InfluxDB. It does fall back to the need for a always on computer for the graphing though so I will say thing leads down that path as well.
HE Integration with InfluxDB (InfluxDB Logger)
InfluxDB Logger is just a really nice simple tool that allows you to import all of your events from HE to a external database. It has been fine tuned over time by few developers and most recently by @dennypage to minimize impact to your HE Hub.
Setup Cheat Sheet
Copy the below information out to Notepad or a text document to help you document and keep track of values needed for setup.
Things to keep Track of
Fill in these values as you do your setup and set up your database. This will help you complete the setup in later steps when these values are neede. You likely want to keep this in a text document on your computer so you can copy and past these values. Case is always important so keep that in mind
Org Name:
____________________________________________________________
This is a simple text name like “Home”
Organization id:
____________________________________________________________
This is a simple alphanumeric value like “de39d0957ef5c875”
Cluster URL (Host Name):
____________________________________________________________
This is a simple URL like “https://us-central1-1.gcp.cloud2.influxdata.com”
Bucket Name:
____________________________________________________________
This is a simple text name like “Hubitat”
Bucket ID:
____________________________________________________________
This is a small alphanumeric value like “c7a67b809036ad8e”
All Access API Token:
____________________________________________________________
This is a large alphanumeric value like “bO3RlSzQR_WH_3I_55V3UELZqTOEDG4V9FGEfiNJuhPcMTkHpuwFnn5rdiO18oS5CwqFM7UgZs41A54vSgQxgA==”
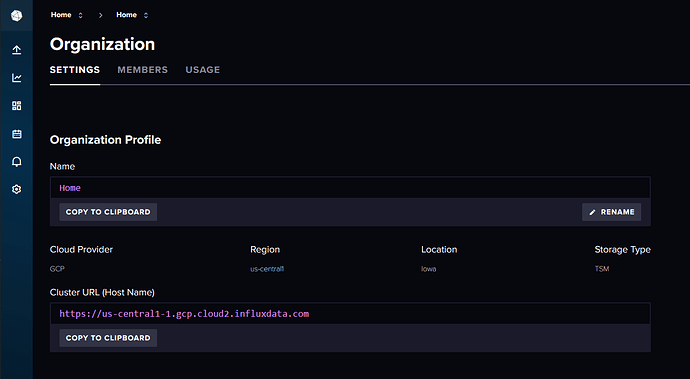
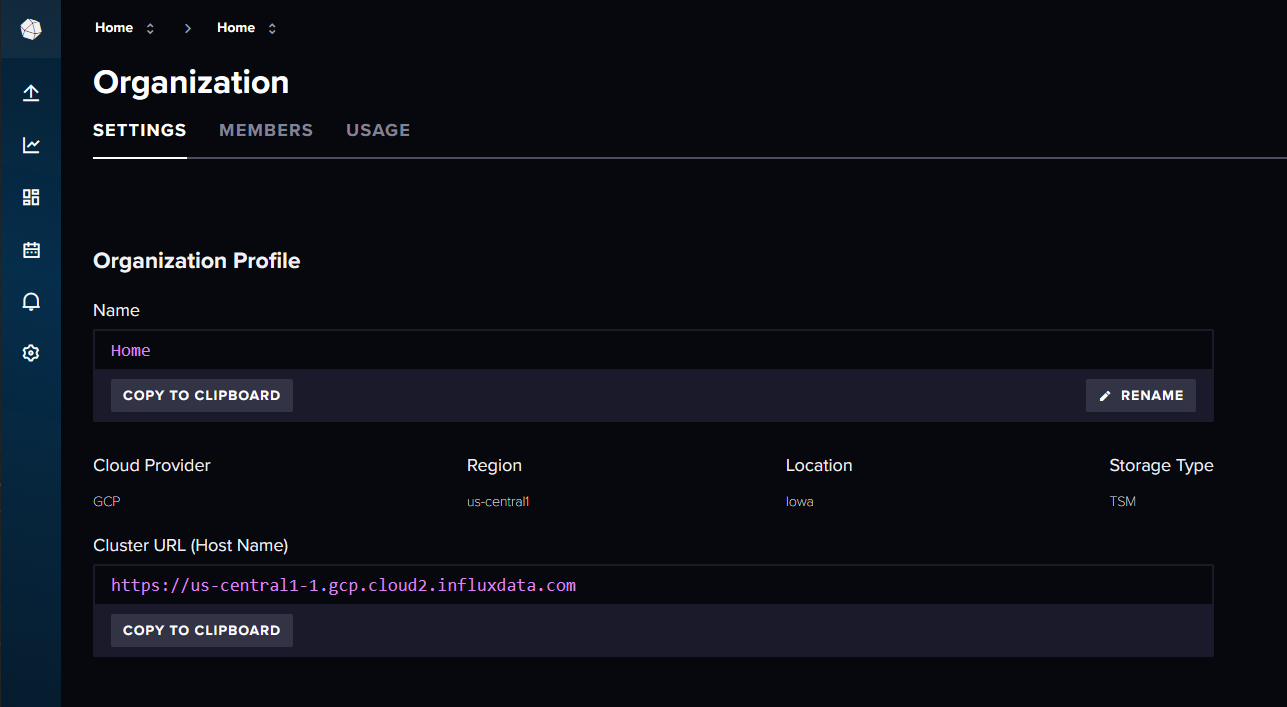
Then once you are logged into your free account click on the spot across the top for the Org you specified and select settings. Here you can see the Cluster URL for were your instance of InfluxDB Cloud lives. Copy that out into your document to track the values. To the right of that value you will also see a listing for Organization ID. Copy that value out as well. It will look somewhat similar to what is below.
Now across the left side you have a line with a arrow pointing up it. Click on that and select the option for Buckets. On the left side of the screen you should now have a option to create a bucket. Click that button and then give the Bucket a name. Note down that name, Click on the Create button.Once created you should see the bucket listed. Just below the name are 3 values. One of them is ID:. Copy that ID Value to our text document for later use.
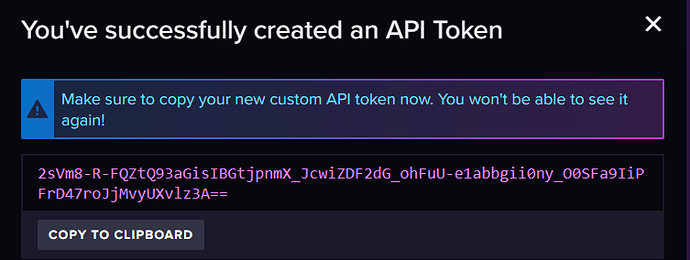
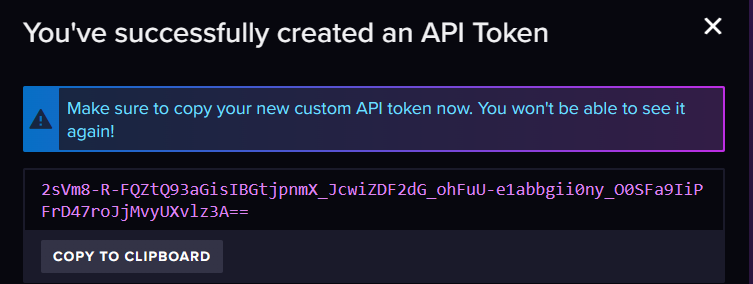
Go back to the left side menu and select the arrow pointing up again but this time click on it and select "API Token". Click on the button to the far right that is labled "Generate API Token". It will give you a drop down menu and select "All Access API Token". A new box will appear and you should give it a name and click save. Now that box will go away and a new box will appear with the token that looks like this.
Copy the API Token and store it for use in InfluxDB Logger.
Local Server setup steps (needs to be update to INfluxdb2.x)
The documentation is provided at INfluxDB’s Support site. There are a variety of ways the InfluxDB can be installed local. Below are the commands for installing on a Ubuntu VM. The file names may need to be adjusted, but these should work. These are also what is provided in the install documentation by in the Support Site
wget https://dl.influxdata.com/influxdb/releases/influxdb2-2.7.0-amd64.deb
sudo dpkg -i influxdb2-2.7.0-amd64.deb

sudo service influxdb start
Now restart the computer/vm that has the InfluxDB instance installed and when it restarts go to a browser and put in the IP of the computer that has the InfluxDB instance installed with :8086 at the end. It should look something like http://192.168.1.25:8086. If you have not already make sure you document the IP/URL for your server, and ensure it has a set IP on your home network.
This should provide you with a login page for the InfluxDB ui. Go through the setup steps to setup your admin profile and your starting ORG. Take note of that ORG and it’s Org ID. and keep track of the admin id so you an access this page later if you ever need to.
Now across the left side you have a line with an arrow pointing up it. Click on that and select the option for Buckets. On the left side of the screen you should now have a option to create a bucket. Click that button and then give the Bucket a name. Note down that name, Click on the Create button.Once created you should see the bucket listed. Just below the name are 3 values. One of them is ID:. Copy that ID Value to our text document for later use..
Go back to the left side menu and select the arrow pointing up again but this time click on it and select "API Token". Click on the button to the far right that is labled "Generate API Token". It will give you a drop down menu and select "All Access API Token". A new box will appear and you should give it a name and click save. Now that box will go away and a new box will appear with the token that looks like this.
Using HPM download InfluxDB Logger from the Community github Repository.
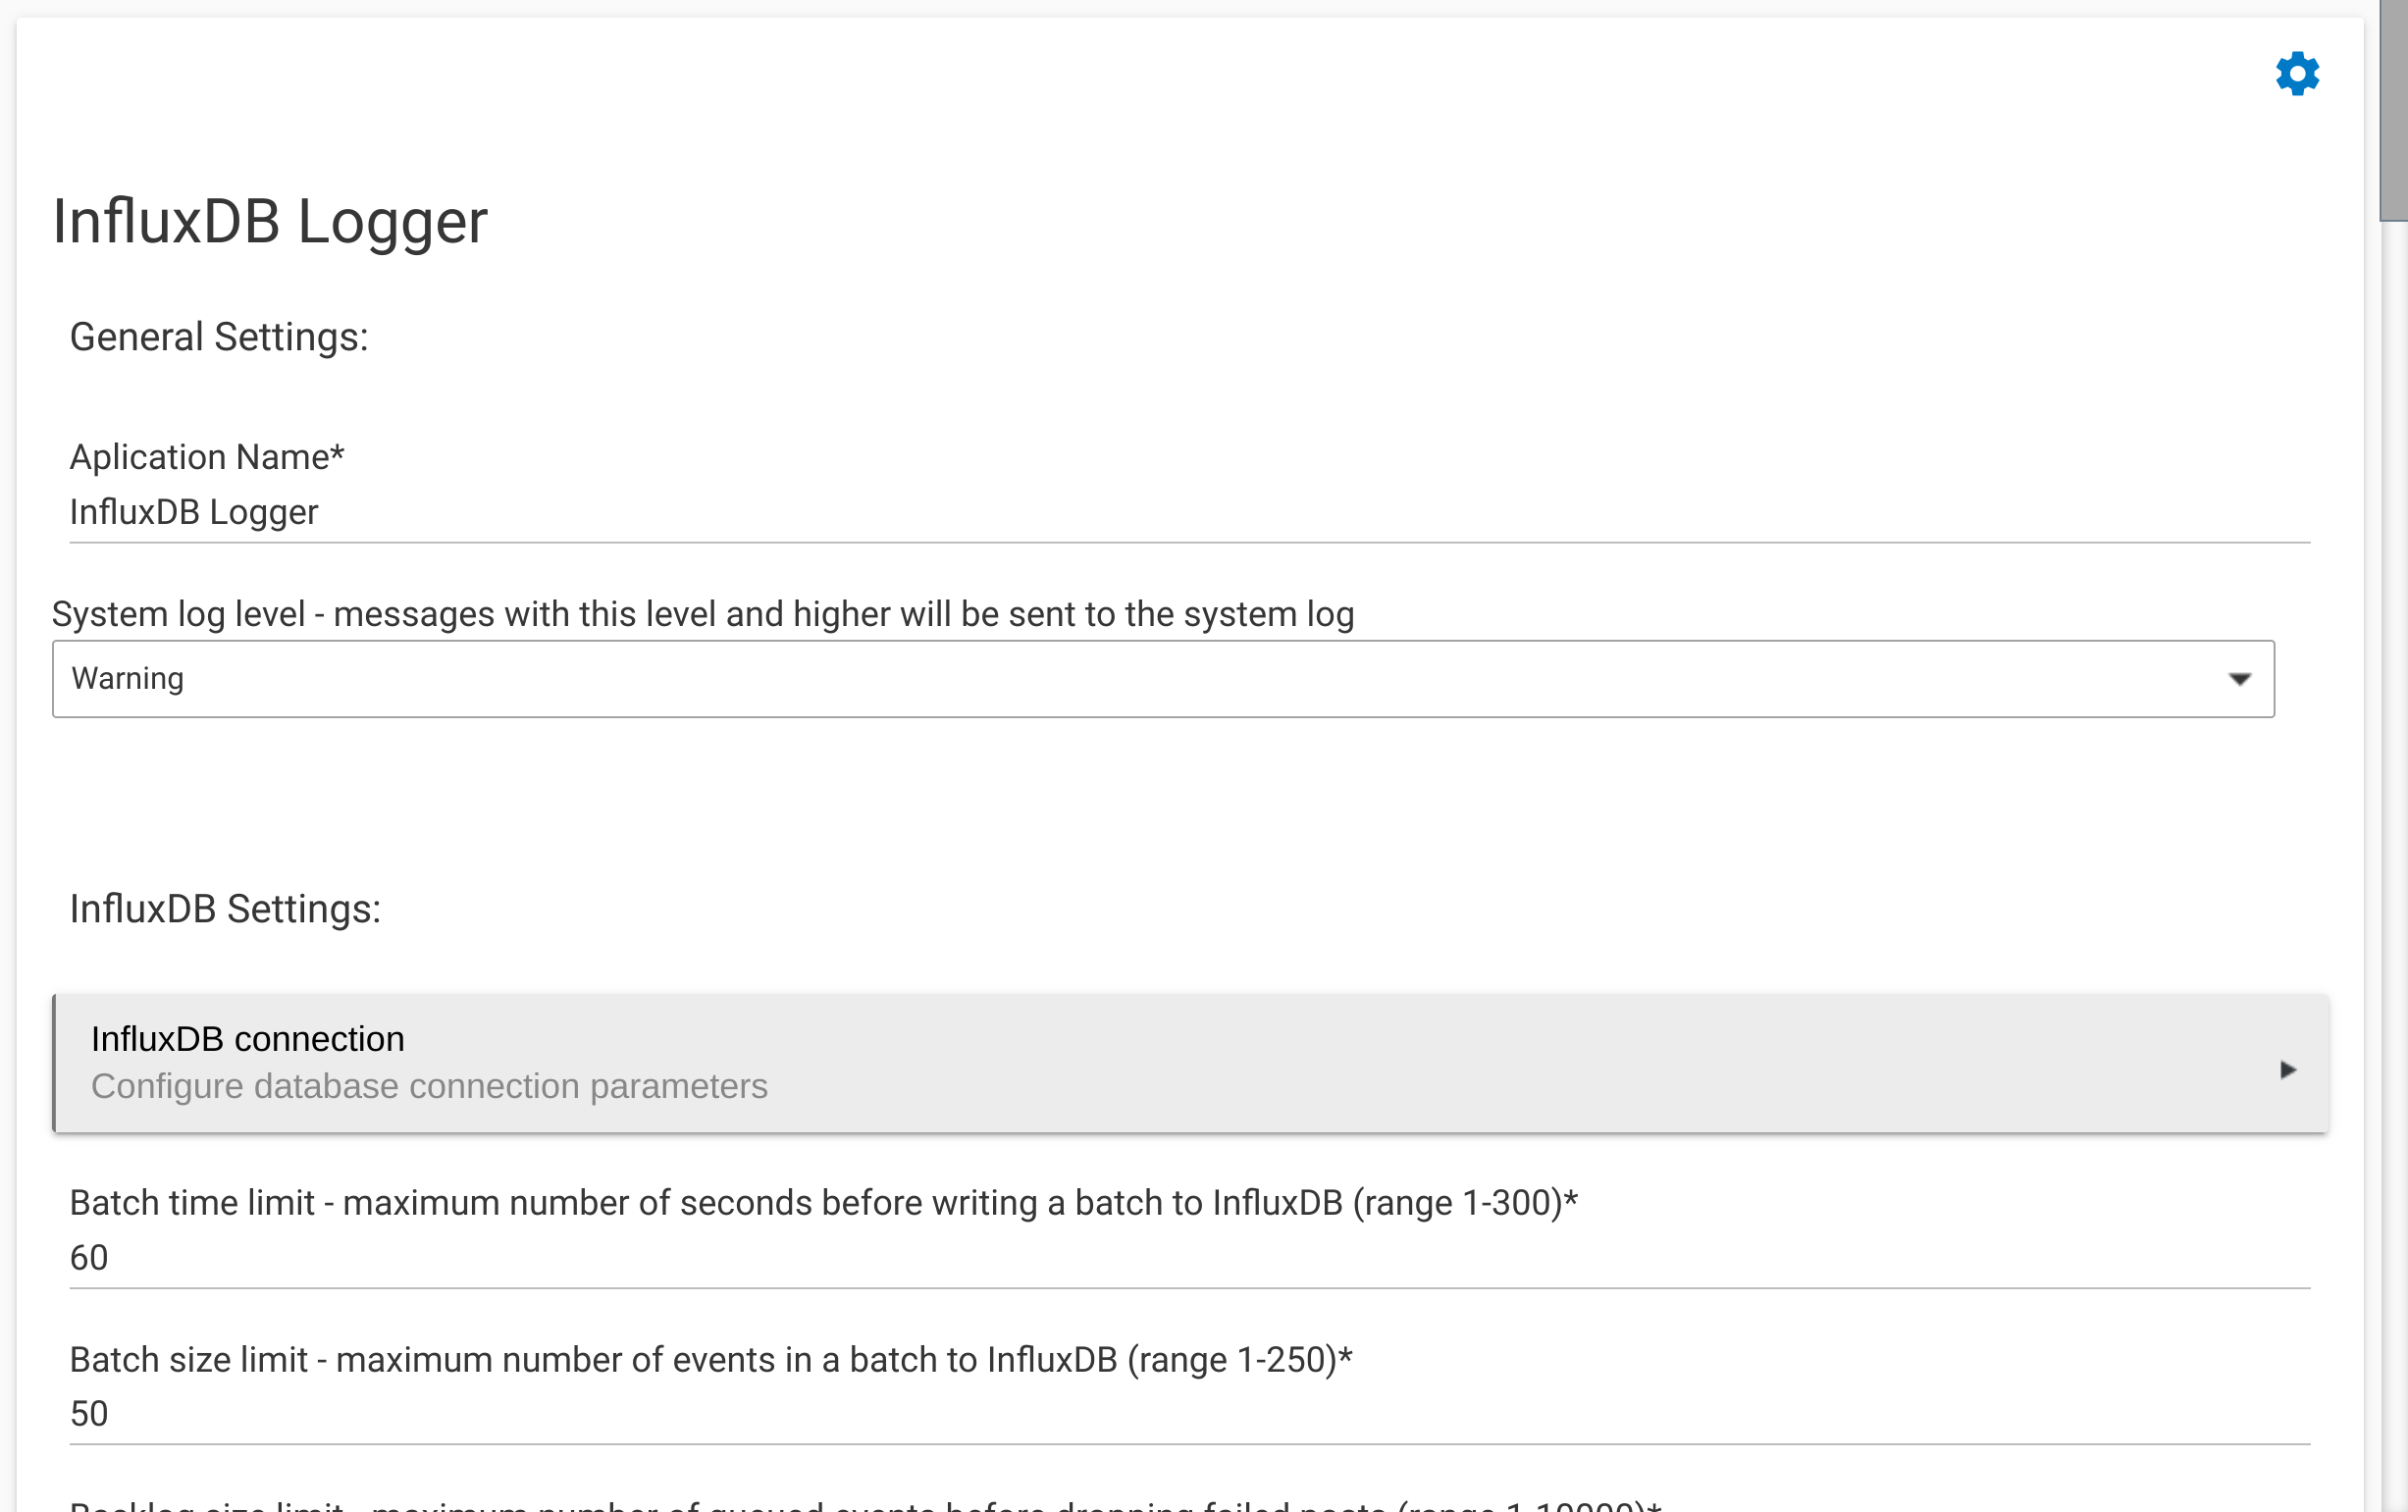
Once you have InfluxDB Logger loaded via HPM you will need to add the app to the hub by clicking on the "Add User App" button in the upper right corner and select "InfuxDB Logger" from the list that appears. This will install the smartapp on the hub and take you into the initial setup screen shown below
So lets us step through the setup of each part of the app.
The application name will default to InfluxDB, but can be modified if you need to run more then one instance.
"System Log Level" will default to "Warning" level which will help minimize logging and can probably be left along. If you ever run into issues with the app you may be asked to increase this.
Next is the Influx DB Settings section.
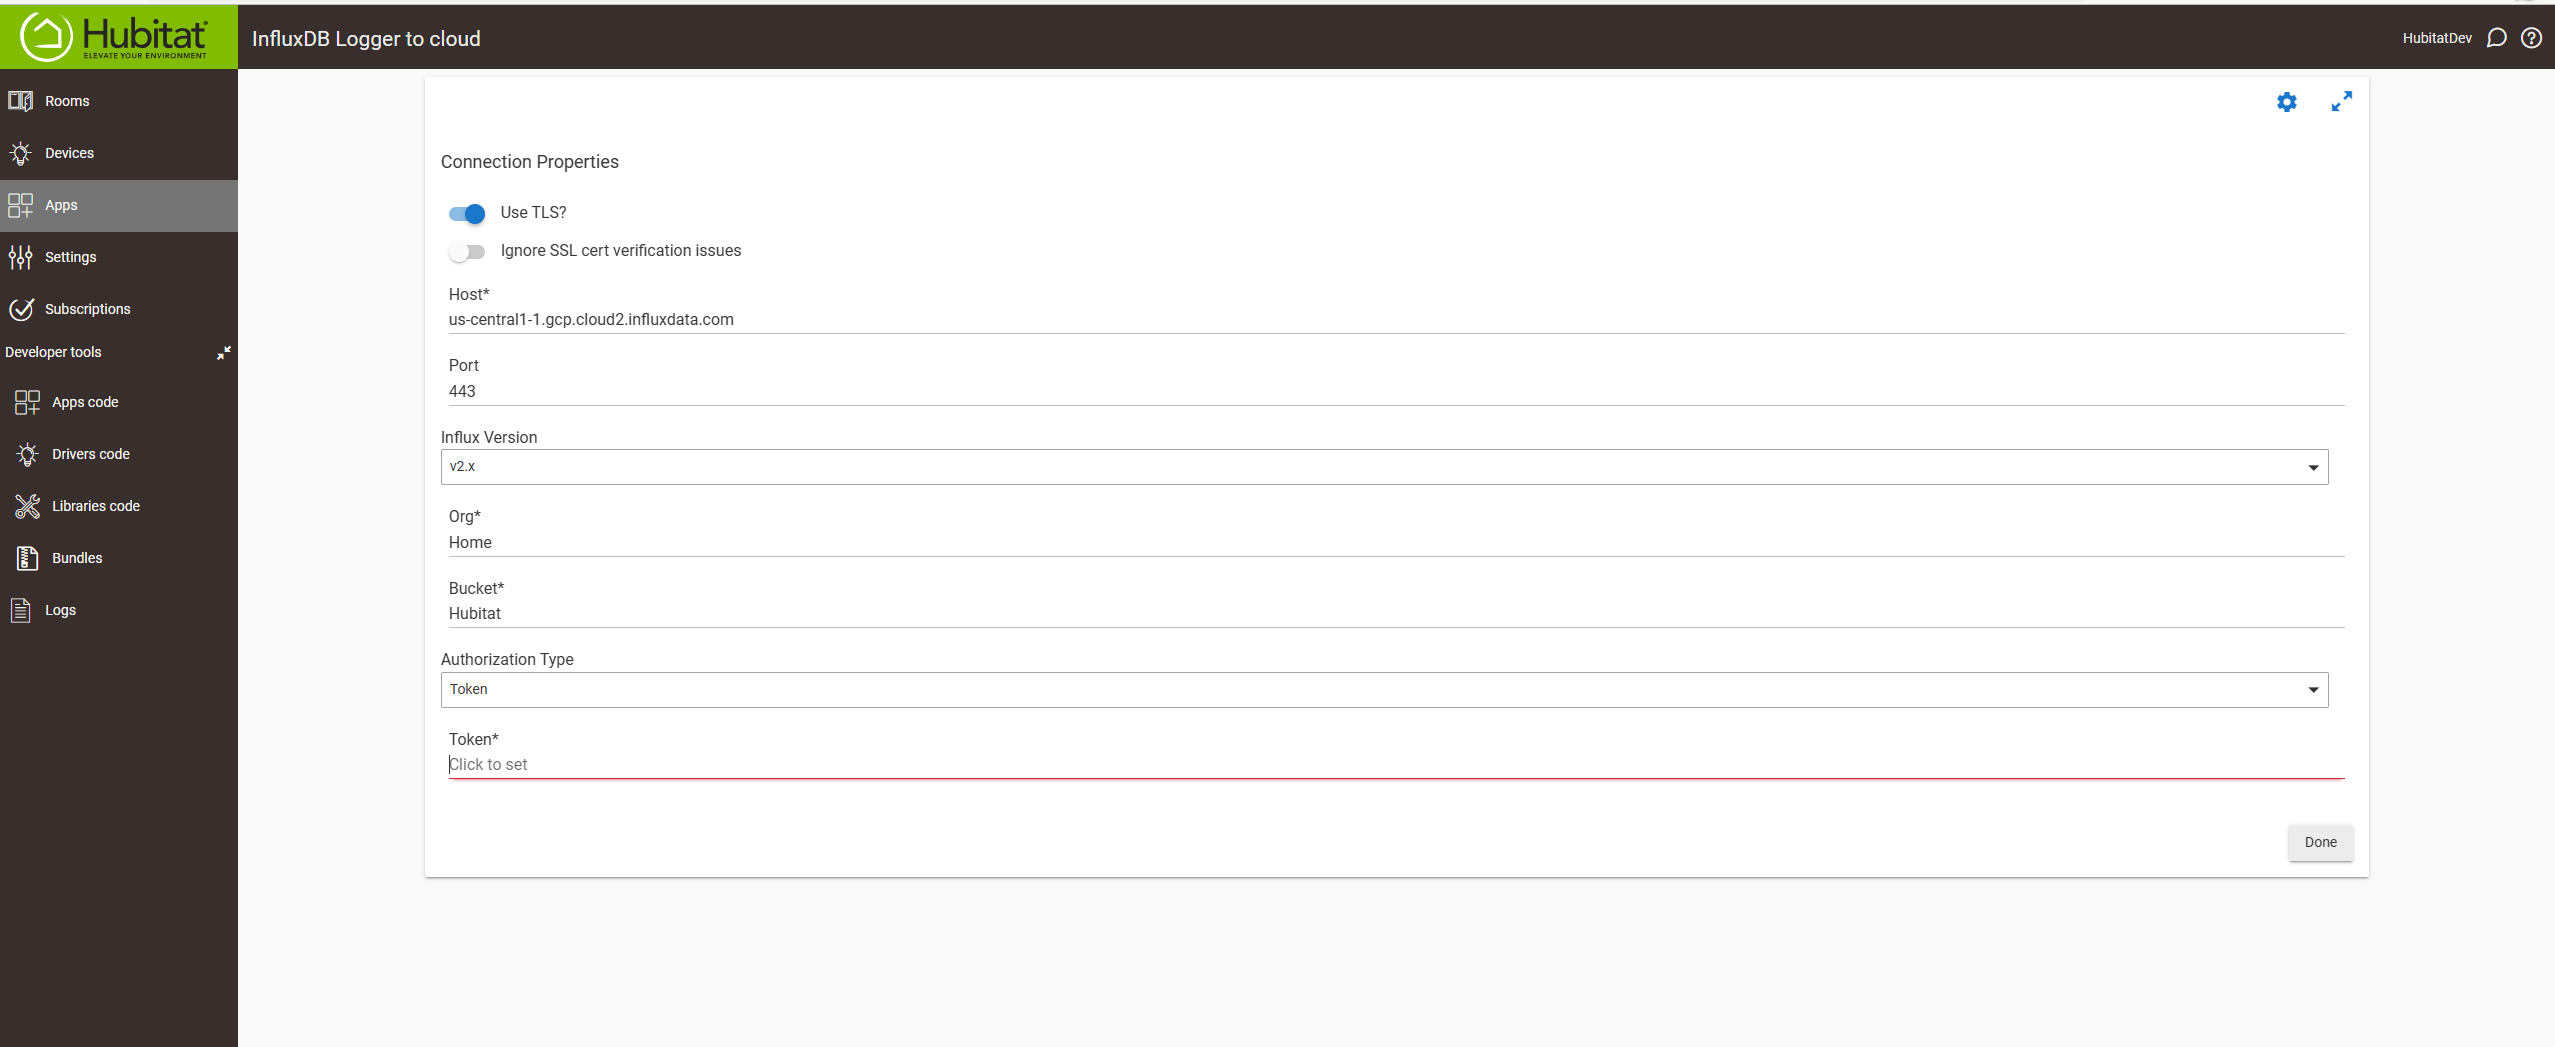
Now we get to the connection Settings. Clicking on this box will load up a new screen that has the breakdown of all of the connection options. This will vary a little bit depending on if you are using the cloud or local setup. Below is an example of what it will resemble if you are using a InfluxDB Cloud setup.
The key is to select "Use TLS" at the top. Use just the Host name from the URL obtained earlier. Specify Port 443.
If you are using a Local install you will leave the "Use TLS option" off. Specify the database server's IP address for host and use port 8086.
Then you need to select v2.x for the influxdb Version and enter the Org, and Bucket you setup in your database. Lastly select token for the "Authentication type" and enter your token
Once these options are setup click on done and return to the previous screen. If you populated everything here properly HE will be able to communicate to InfluxDB.
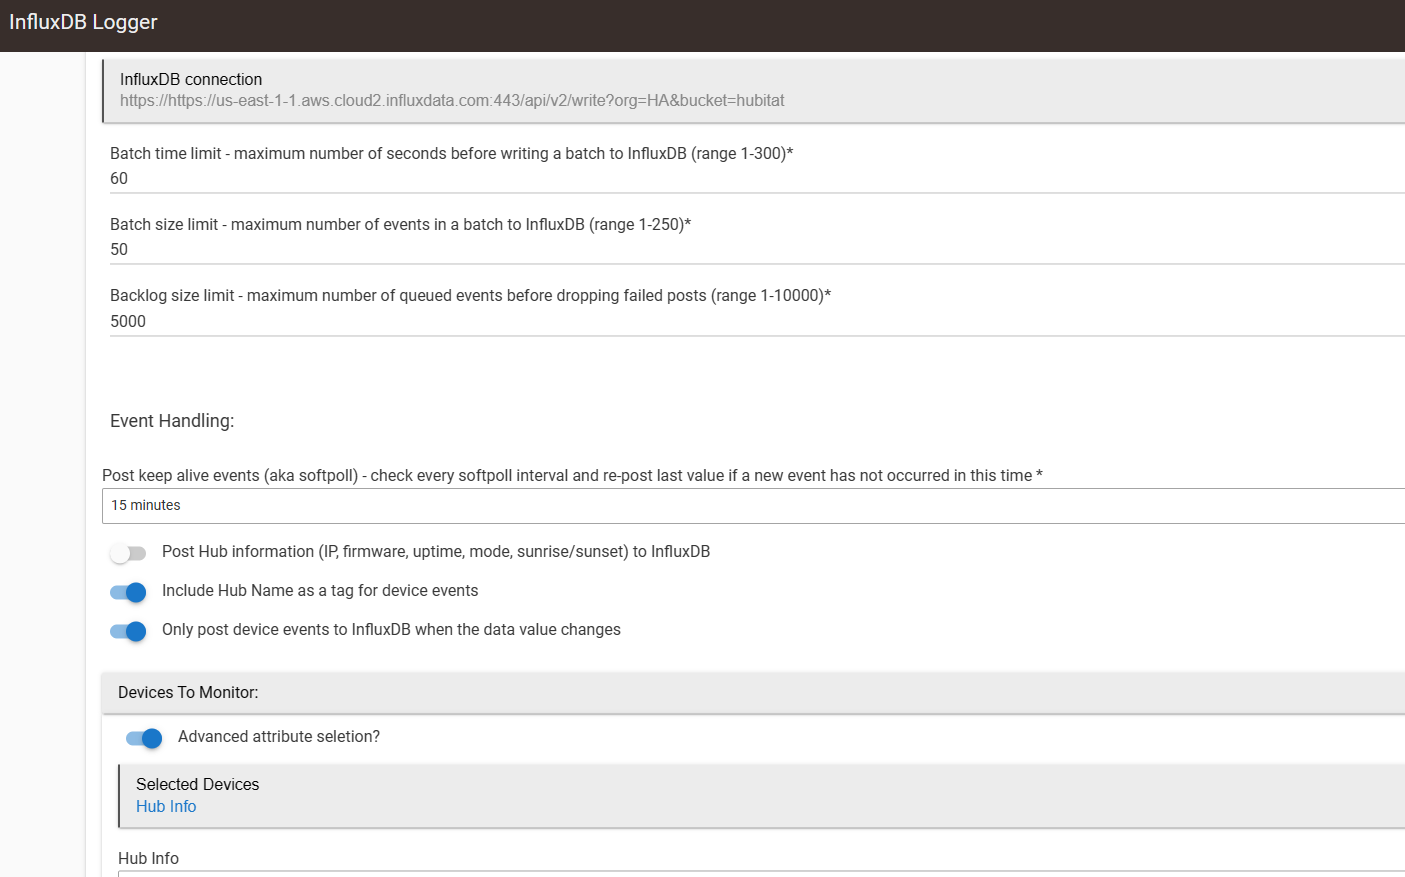
Batch time Limit, Batch Size Limit and Backlog Limit have to do with how records are handled as they occur.
Batch time limit determines how much time to wait after a new event occurs for more events before posting those records to the database. This doesn't effect the time for the event that is recorded just how long it takes to get into the DB.
Batch Size Limit indicates a max size to be queued up before a post is made. Think of this as just another way to determine how frequently data is written to the DB.
Batch Time Limit and Batch Size Limit function independent of each other and either can trigger a post to the database depending on how your environment is running.
"Backlog Size Limit" determines when a records may be droped to prevent Hub performance problems. This is used for those cases were for whatever reason your DB becomes unavailable for a period of time. InfluxDB Logger will start to build a backlog of events and hold them until it can post them to the DB. If it gets to the Backlog Limit it will start to prune the oldest records to prevent Hub performance issues.
It should be noted that the "Batch Size Limit" could potentially impact recovery time if you have a prolonged DB outage.
The default values for those settings are very reasonable.
That completes settings related to InfluxDB and we can now move onto "Event Settings"
InfluxDB Logger has a concept of "Keep Allve Events" which is the first setting in this section. The simplest way to explain this value is to ensure data is posted to the DB even for devices that rarely trigger an event. This can be useful if you want to graph states in shorter intervales that may not ever appear or change on a certain graph. A default value of 15 min's ensure you will get data for each device you setup every 15 min reguardless of change.
Next you have two values relate to includeing hub specific data with the event and if it should post a soft poll even if the device was updated in the last soft poll interval. The default value on for these values is probably prefered in almost all aspects
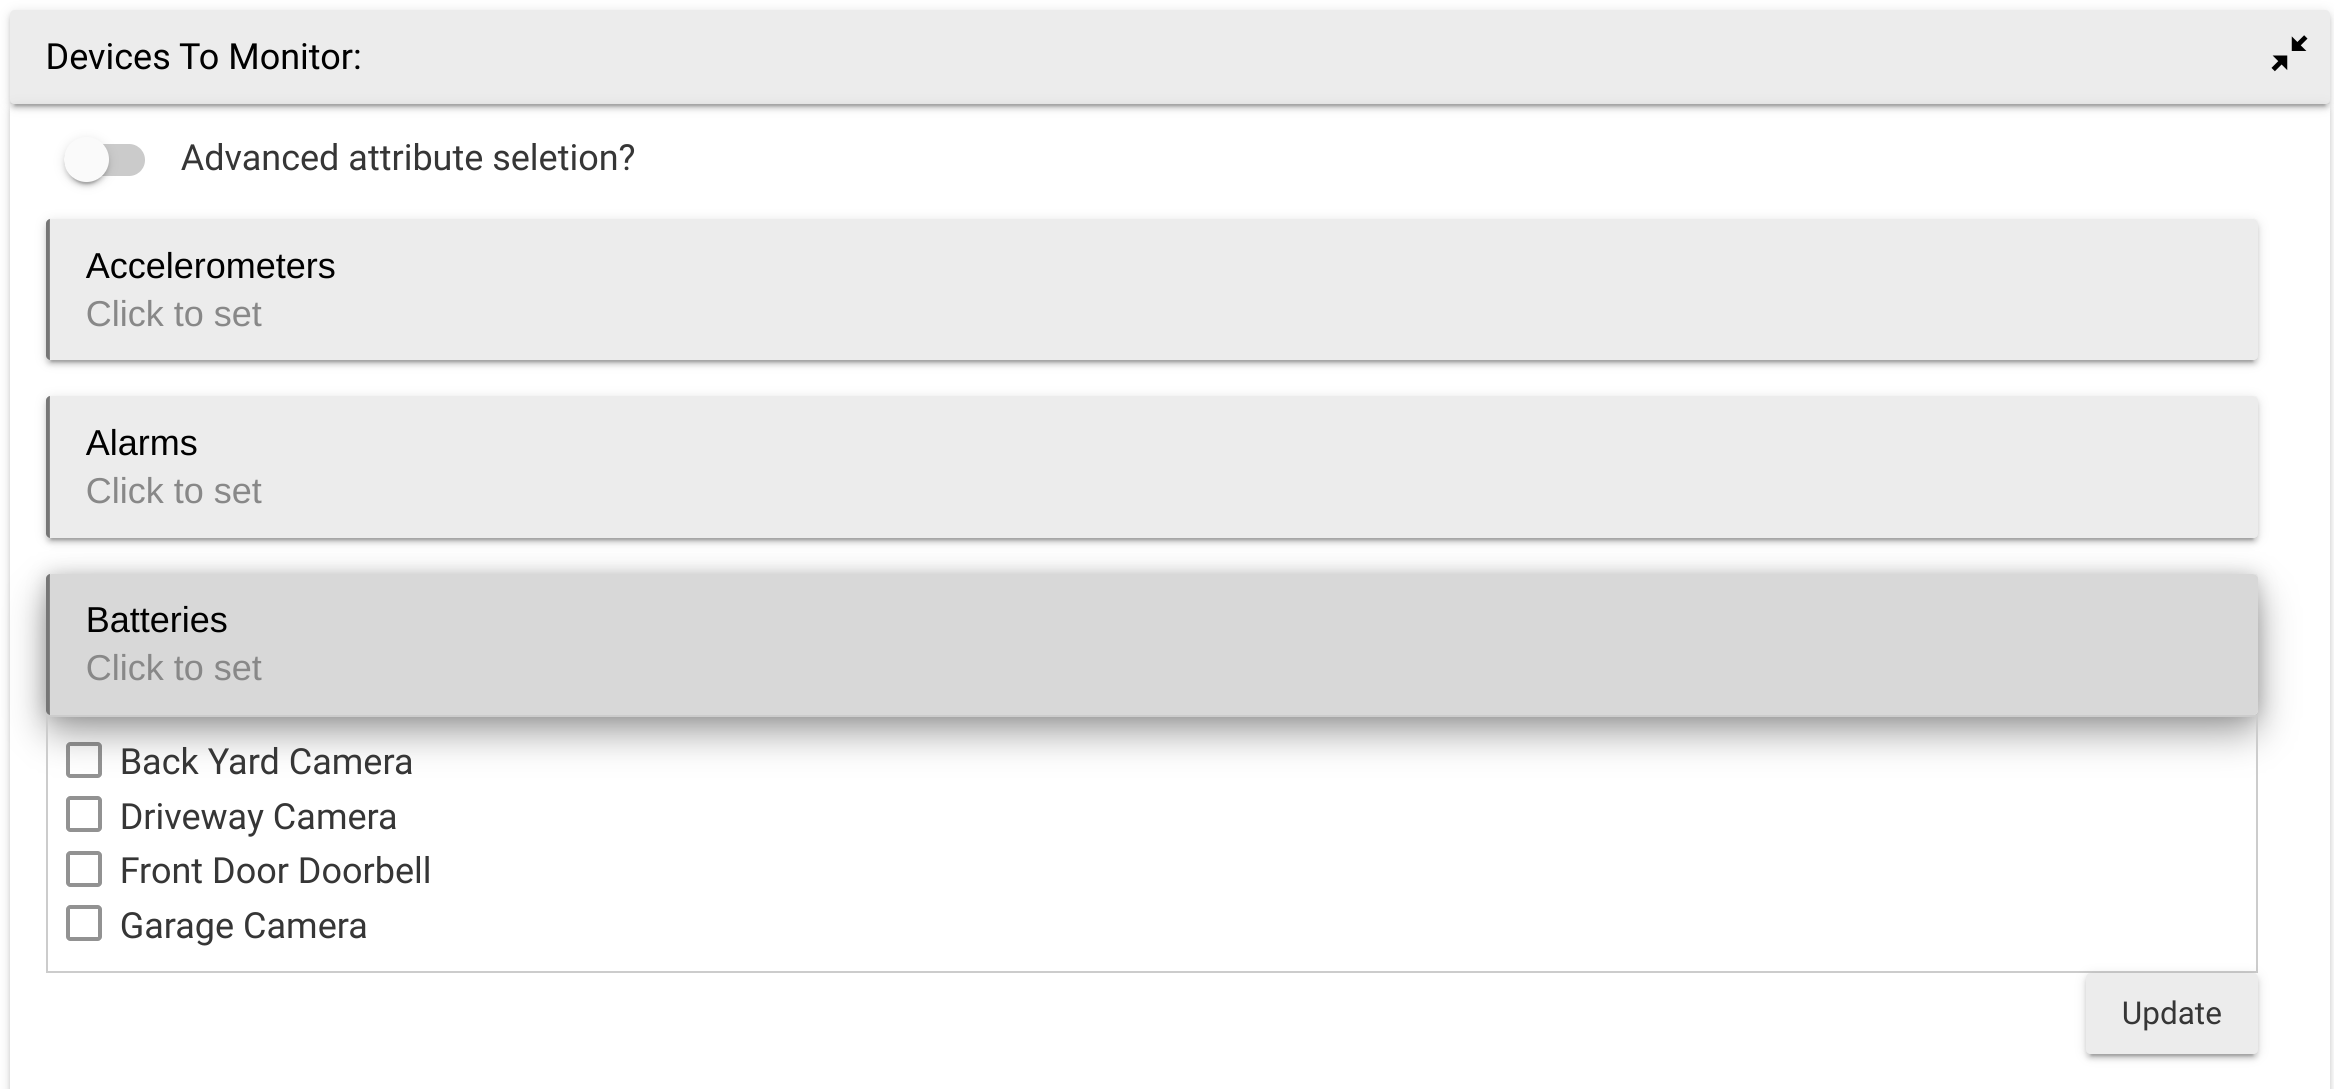
The last section is "Devices to Monitor" and this is where you decide what devices you will track for visualization. Hubitat has the ability to use custom attributes that can be unpredictable. For that reason the default options here are based on documented predefined capabilities that are part of the HE environment. These entries are pretty much guaranteed to work and is what i would suggest you use first. To enable devices to be captured and sent to InfluxDB you will select the individual capability which will then display a list of devices. Then select the devices you want to capture.
Here is an example where I click on devices that have Batteries, and then could select the individual devices.
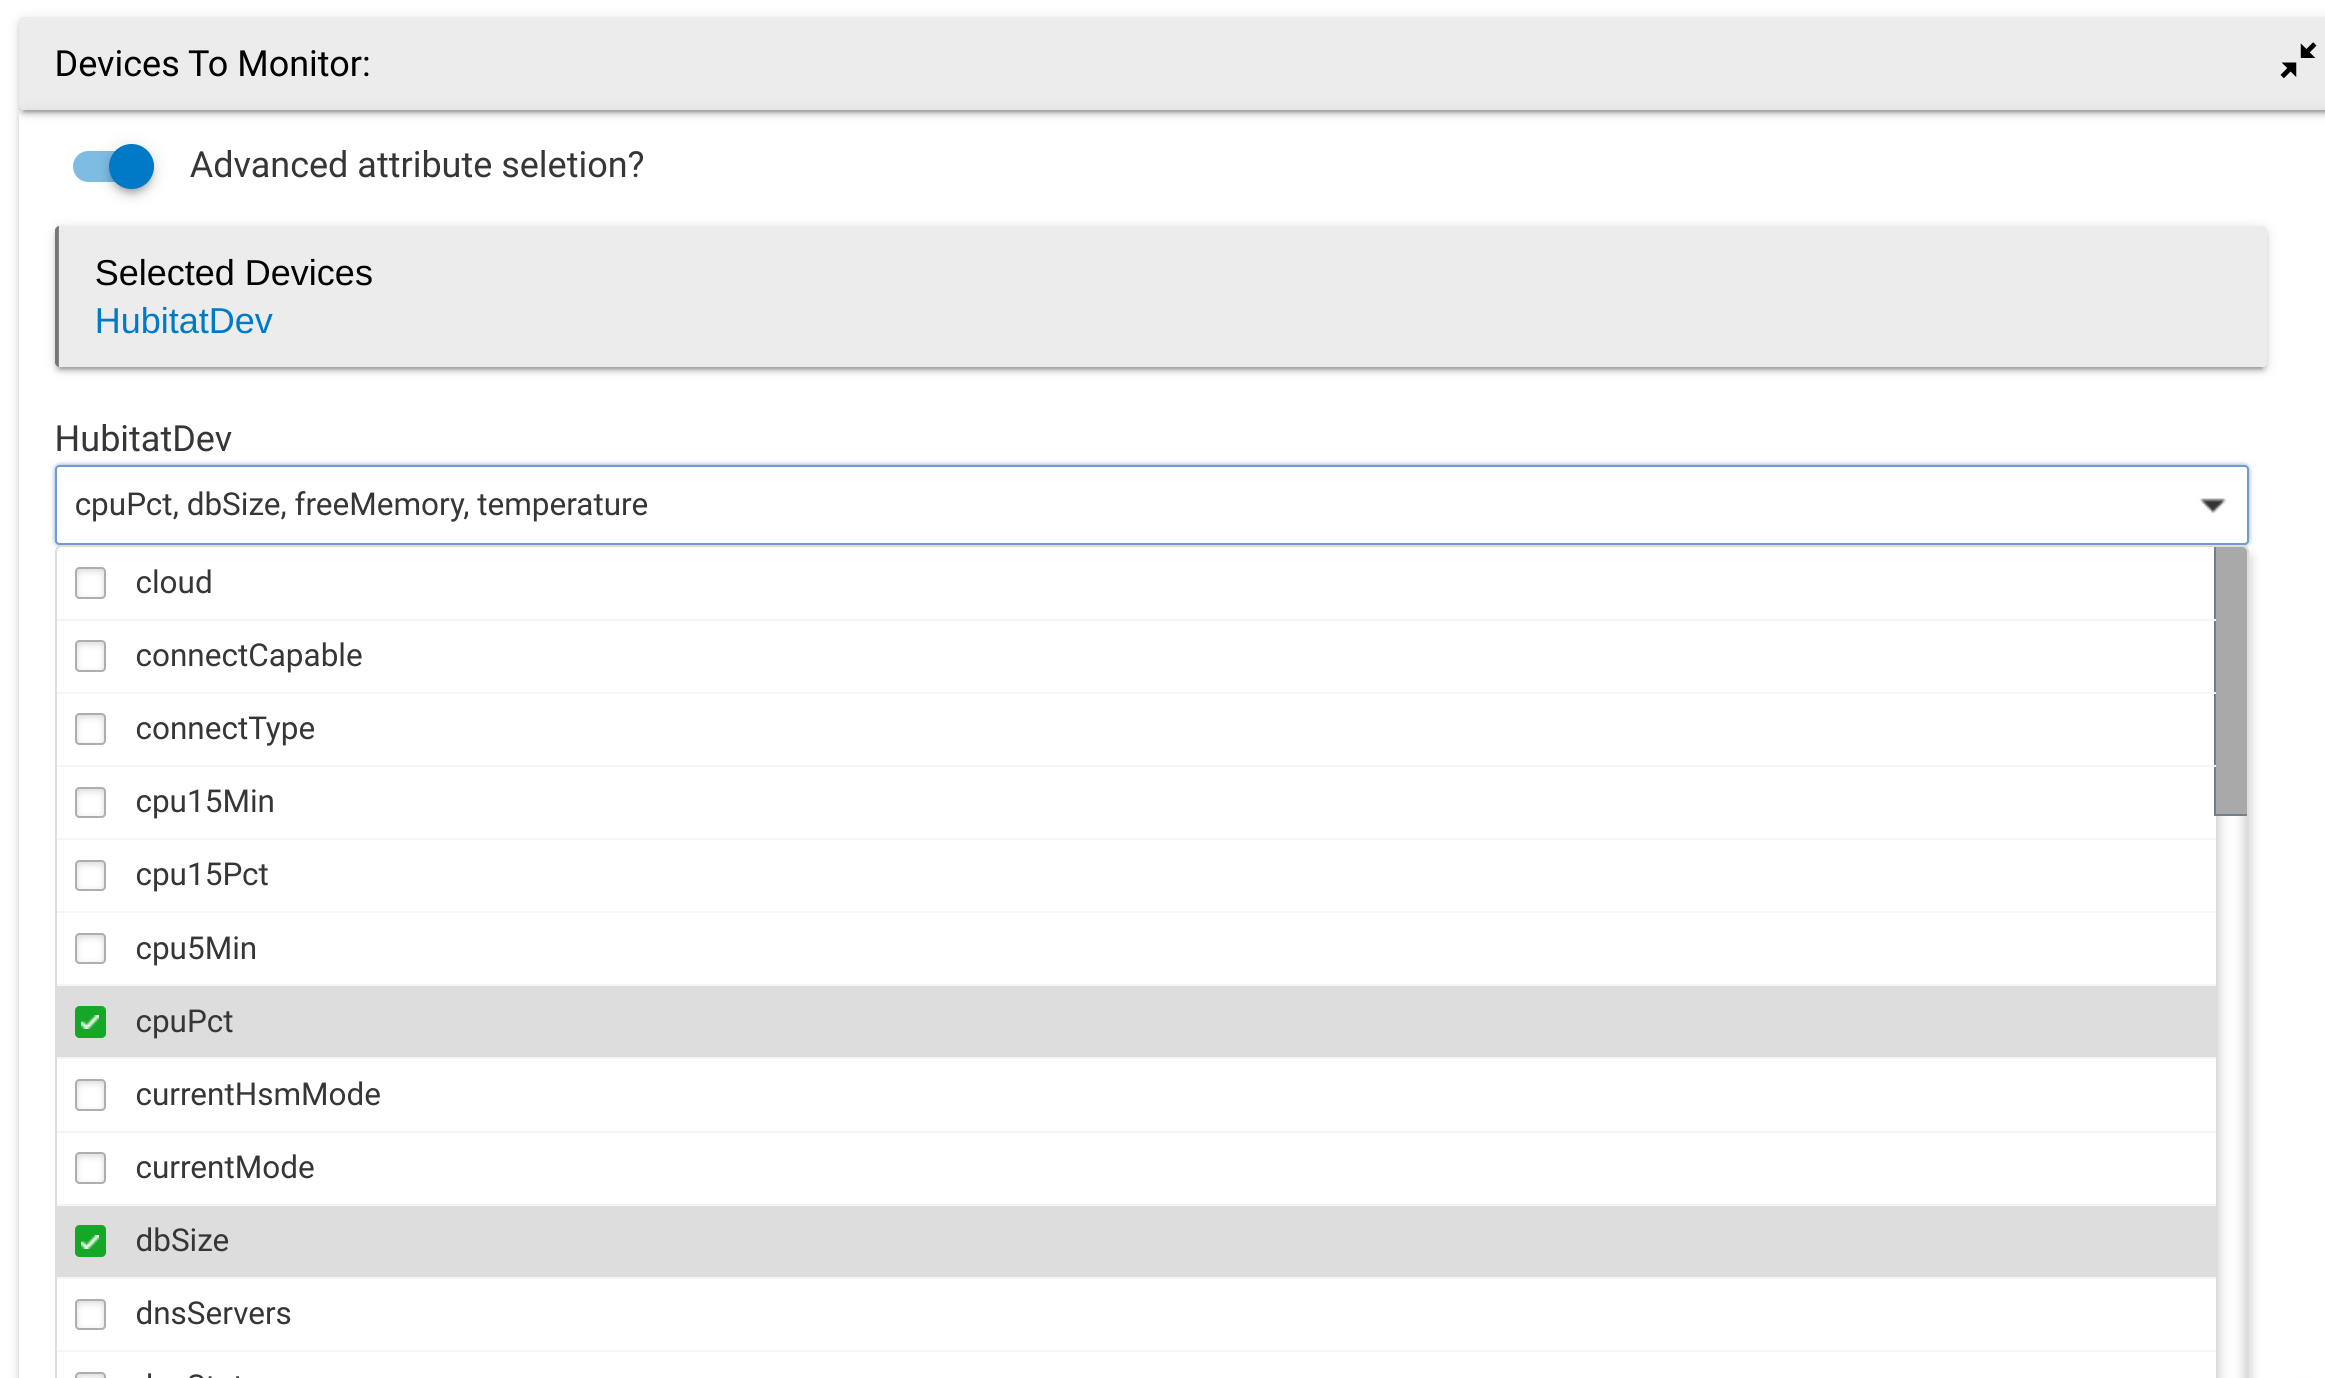
In some advanced situations there may be things you want to capture that are not standard capabilities/attributes. This is where the option for "Advanced attribute selection" comes in. This kind of flips things around and will allow you to select any device and then the specific attributes you want as shown in this picture. I this example I enabled the Advanced Attributes option to select the cpuPct, and dbSize attribute.
Using the "Adavanced Attribute" option can be a dangerous action though as improper data can cause your data loads to InfluxDB to fail. I would suggest you do what you can in the standard method and then use a second instance for the Advanced Attribute captures you need to do. This will alteast ensure most events flow with no issues.
Once your selections are made click done. Because this can potentially touch many 10's of devices this last done click can take a bit on the hub. There are allot of things behind the scene that are getting setup at this point.
Now you can go look at your logs and you should see no errors from INfluxDB Logger as it processes yourn events.
We can verify Grafana is running by browsing to the web interface on port 3000, http://localhost:3000/:
Grafana: Log In Page
At this point, I recommend Logging into Grafana and changing the default admin password.
So far, so good. We now have InfluxDb and Grafana running, but before we can start constructing some charts and dashboards, we need some data.
Setting up a Data source
We need to setup a data source so Grafana knows how to get to our InfluxDB Database. When InfluxDB migrated from their version 1 to Version 2 they changed their query engine. For that reason we are going to setup two data sources. This will allow you to select the write connection for any dashboard you may get.
Data source v1
First you need to create a DBRP entry for the legacy connectivity to the database. This is done by using the Curl command on a computer. Open up a terminal or command prompt and submit the command as shown below for your OS. Fill in the fields based on the information collected earlier in the text file.
Windows syntax:
curl -H "Content-Type: application/json" ^
-H "Authorization: Token <YourAuthToken>" ^
"https://<url of server instance>/api/v2/dbrps" -d "{^
\"bucketID\": \"<bucket ID>\",^
\"database\": \"<database name to use for grafana>\",^
\"default\": true,^
\"orgID\": \"<Org ID>\",^
\"retention_policy\": \"<Just a retention name>\"^
}"
Linux/Unix/MacOS syntax:
curl --request POST https://<url for server instance>/api/v2/dbrps \
  --header "Authorization: Token <YourAuthToken>" \
  --header 'Content-type: application/json' \
  --data '{
        "bucketID": "<bucket ID>",
        "database": "<database nam to use for grafana>",
        "default": true,
        "orgID": "<Org Id>",
        "retention_policy": "<just a retention name>"
      }'
Here is an example of what I used when setting up my test. I did it on a Linux VM so i used that example
Once you press enter you should get a return message with the same data.
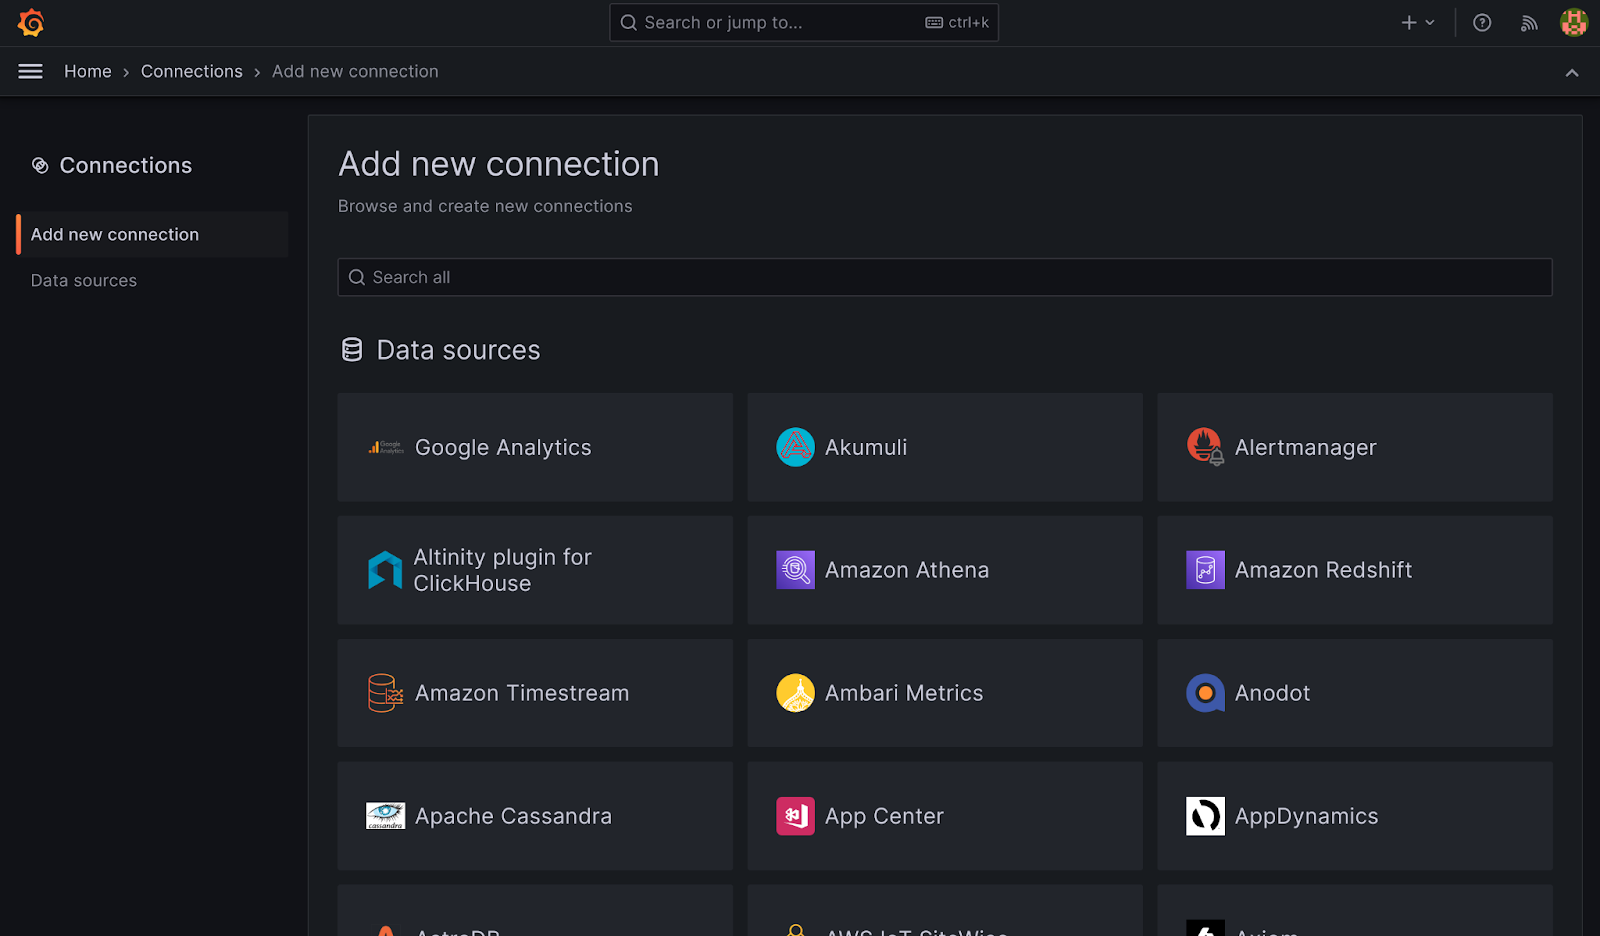
As shown in the image below you will click on the sandwich icon in the upper left of the Grafana screen first. Then select connections in the menu that drops down below it. Once in the connection menu click on “Add New Connection” to be shown the screen below.
In the search bar type “Influx” The list should reduce to two options one of which is InfluxDB. Select InfluxDB to move to the setup screen for that database.
You should be presented with a new window that gives you some brief information about InfluxDB. Clock on the “Create a InfluxDB Datasource” button in the upper right. At this point the data source will be created, but it isn’t configured to work with anything. You can see the blank Configuration below.
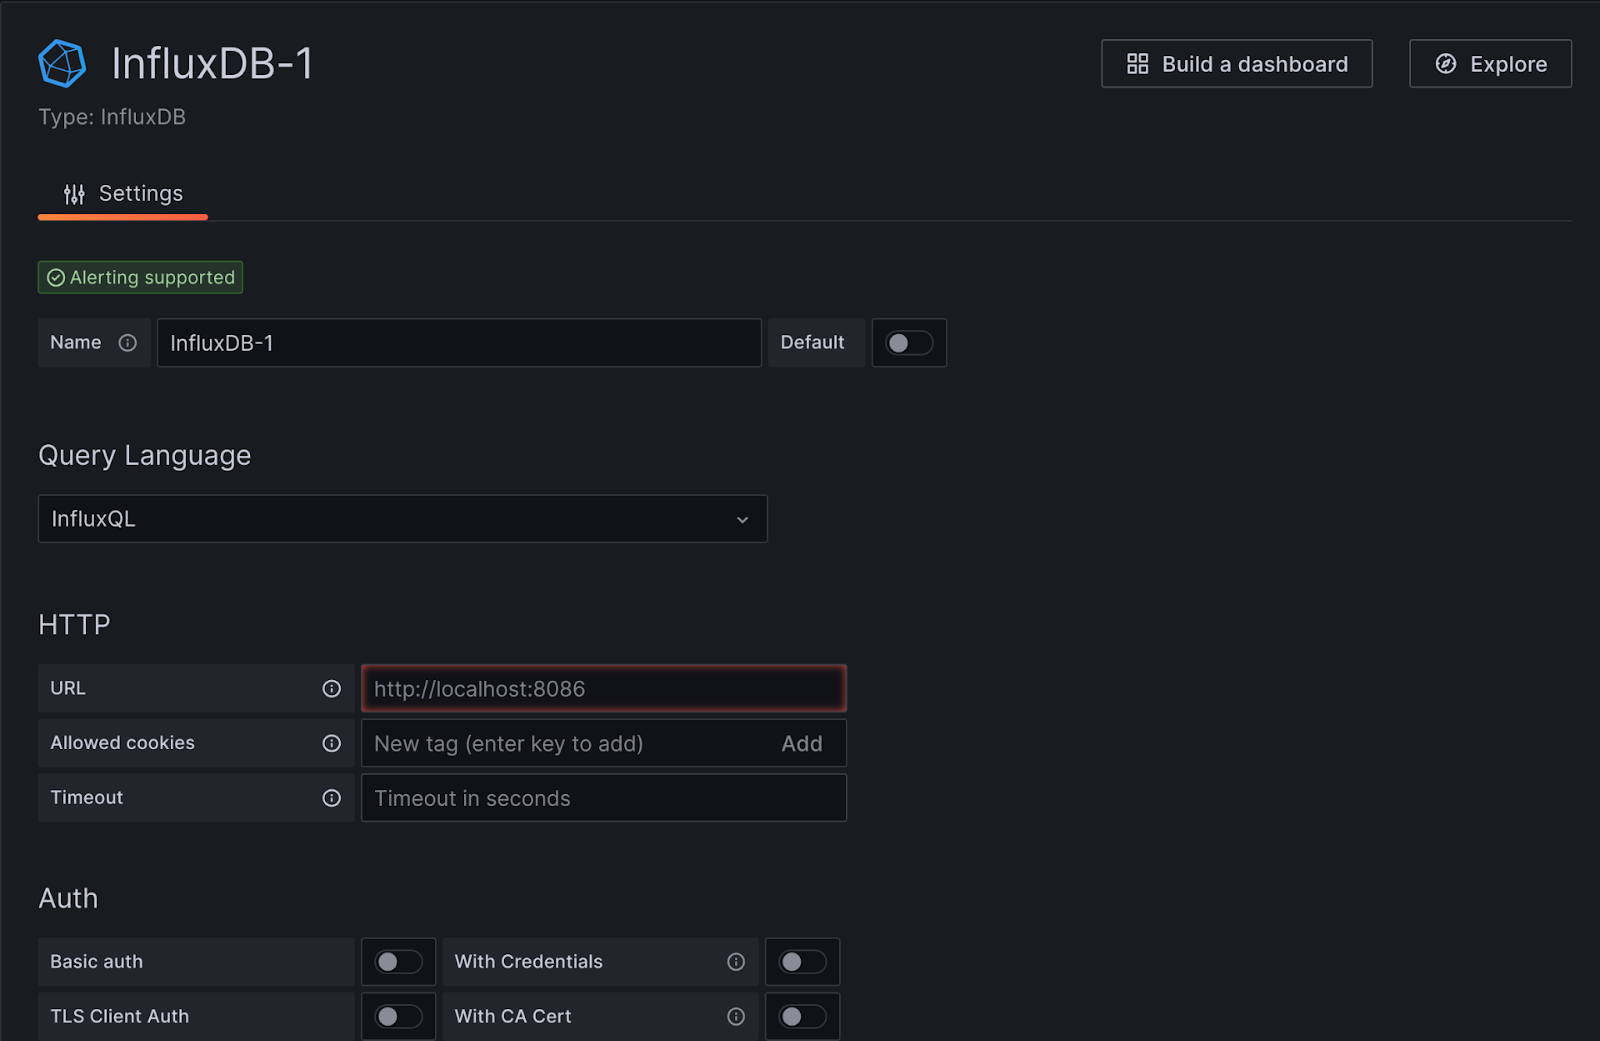
Now you will want to give this datasource a name. I would suggest ending it with v1 to indicate it is a legacy connection.
The URL will depend on if you are hosting your own instance of InfluxDB or using the cloud. If you are hosting your own it will be HTTP://”INfluxDB IP”:8086 (fill in your IP). In my case it is http://192.168.86.10:8086. If you are using the InfluxDB Cloud then you will want to enter the URL provided when you setup your INfluxDB account and we used for INfluxDB Logger.
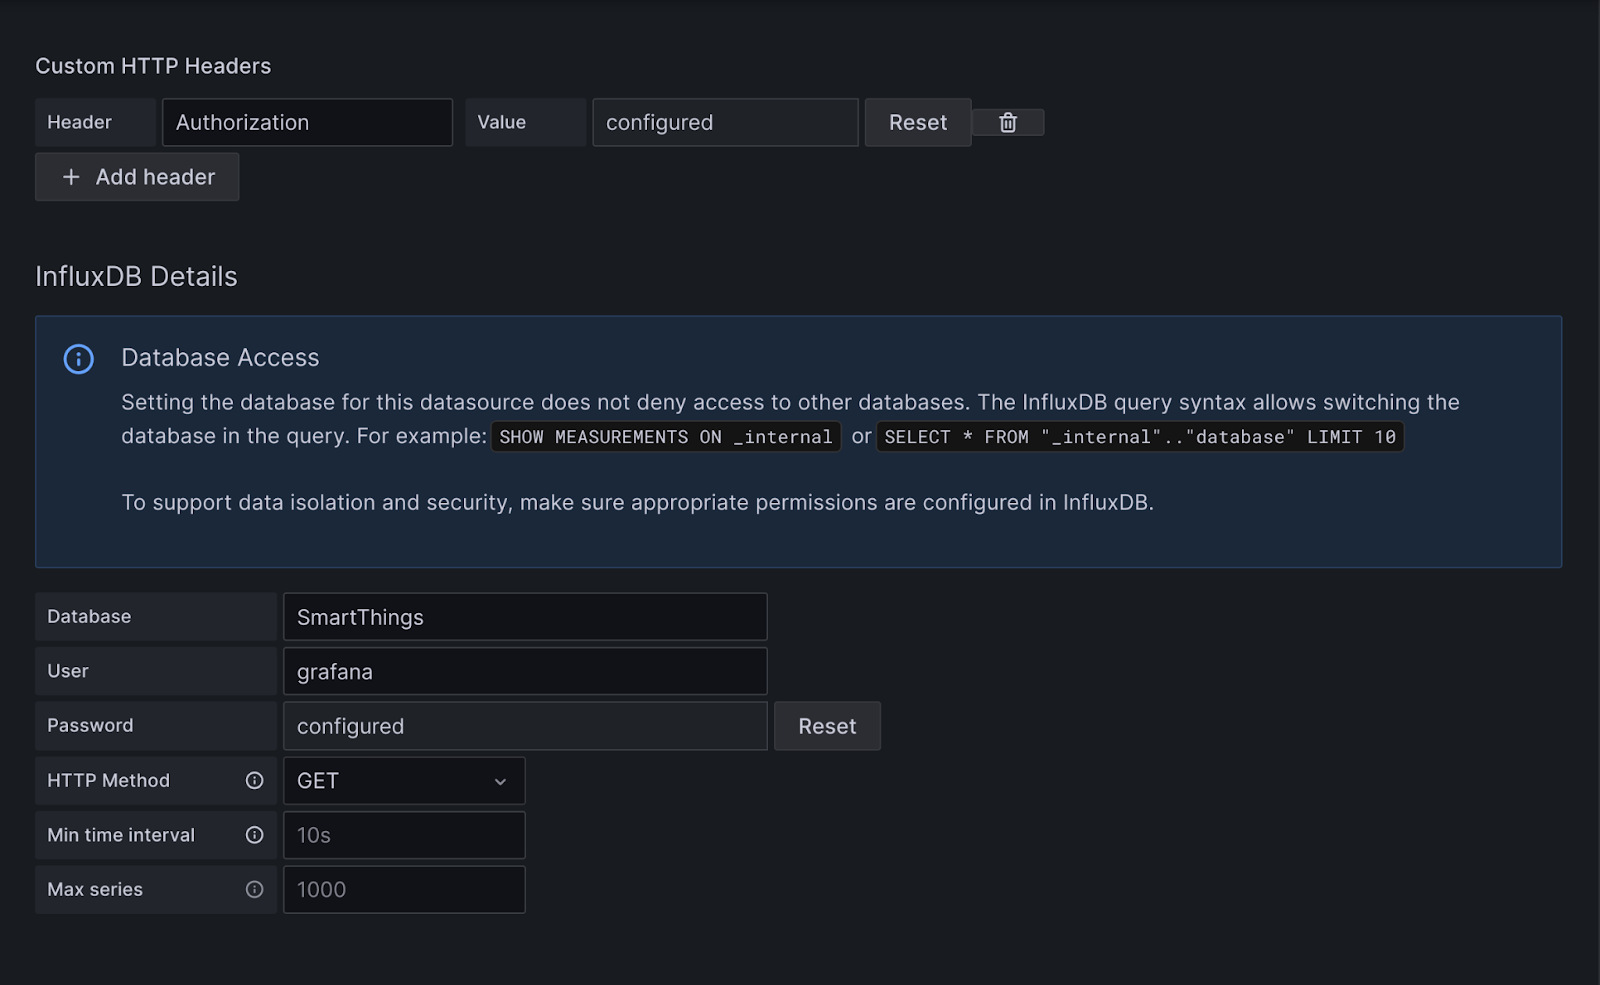
Next we need to populate the Custom HTTP Headers value. This is what allows us to bridge the gap between v1 and V2 Query engines.
Under Custom HTTP Headers enter “Authorization” (exactly like that) for the Header and then “Token ” for the value. No additional spaces except for the one between the word Token and your actual token you obtained when setting up the database.
Once this connection is saved it will not be viewable as shown below, so keep that in mind.
Now populate your Database value with the bucket you setup in your database and click on Save & Test at the bottom. You should get a success confirmation.
Data source v2
Setting up the V2 connection is very similar to the V1 except for two things.
For that reason follow the same steps as before and as shown in the image below you will click on the sandwich icon in the upper left of the Grafana screen first. Then select connections in the menu that drops down below it. Once in the connection menu click on “Add New Connection” to be shown the screen below.
In the search bar type “Influx” The list should reduce to two options one of which is InfluxDB. Select InfluxDB to move to the setup screen for that database.
You should be presented with a new window that gives you some brief information about InfluxDB. Clock on the “Create a InfluxDB Datasource” button in the upper right. At this point the data source will be created, but it isn’t configured to work with anything. You can see the blank Configuration below.
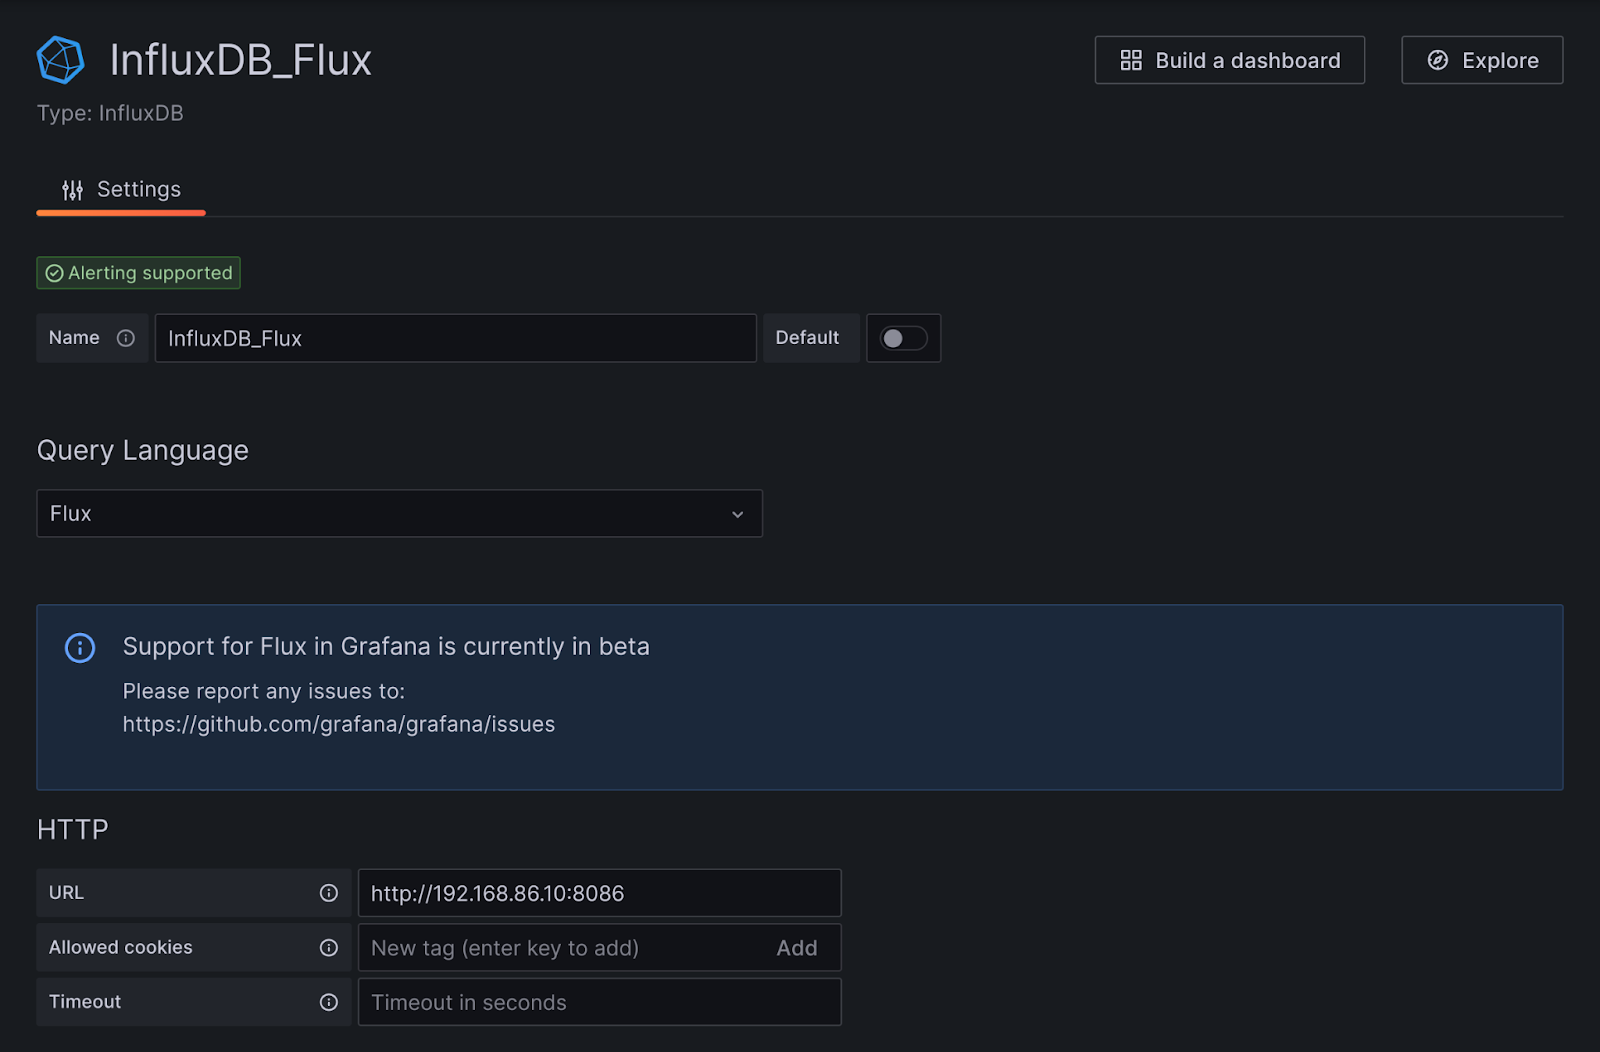
Now you will want to give this datasource a name. I would suggest ending it with v2 or Flux to indicate it is a new query method connection.
Yo will want to change the Query Language from InfluxQL to Flux as shown in the above graphic.
The URL will depend on if you are hosting your own instance of InfluxDB or using the cloud. If you are hosting your own it will be HTTP://”INfluxDB IP”:8086 (fill in your IP). In my case it is http://192.168.86.10:8086. If you are using the InfluxDB Cloud then you will want to enter the URL provided when you setup your INfluxDB account and we used for INfluxDB Logger.
The Token is the native way to communicate to InfluxDBv2 and once you select Flux as your query engine the options on the bottom will shift a little bit. You will not need to worry about custom header and instead simply populate the values in the lower section correctly.
So at this point all you need to do is fill in the Organization value(ORG), Database Bucket and token. These will relate to what you used previously in this setup. Once that is done you should click on the “Save & Test” button and get confirmation of a successful connection.
The easiest way to get started with a dashboard will be to obtain shared dashboards from Community members. You can find shared dashboards in the below thread. From here obtain the raw JSON and import it into Grafana using the below procedure.
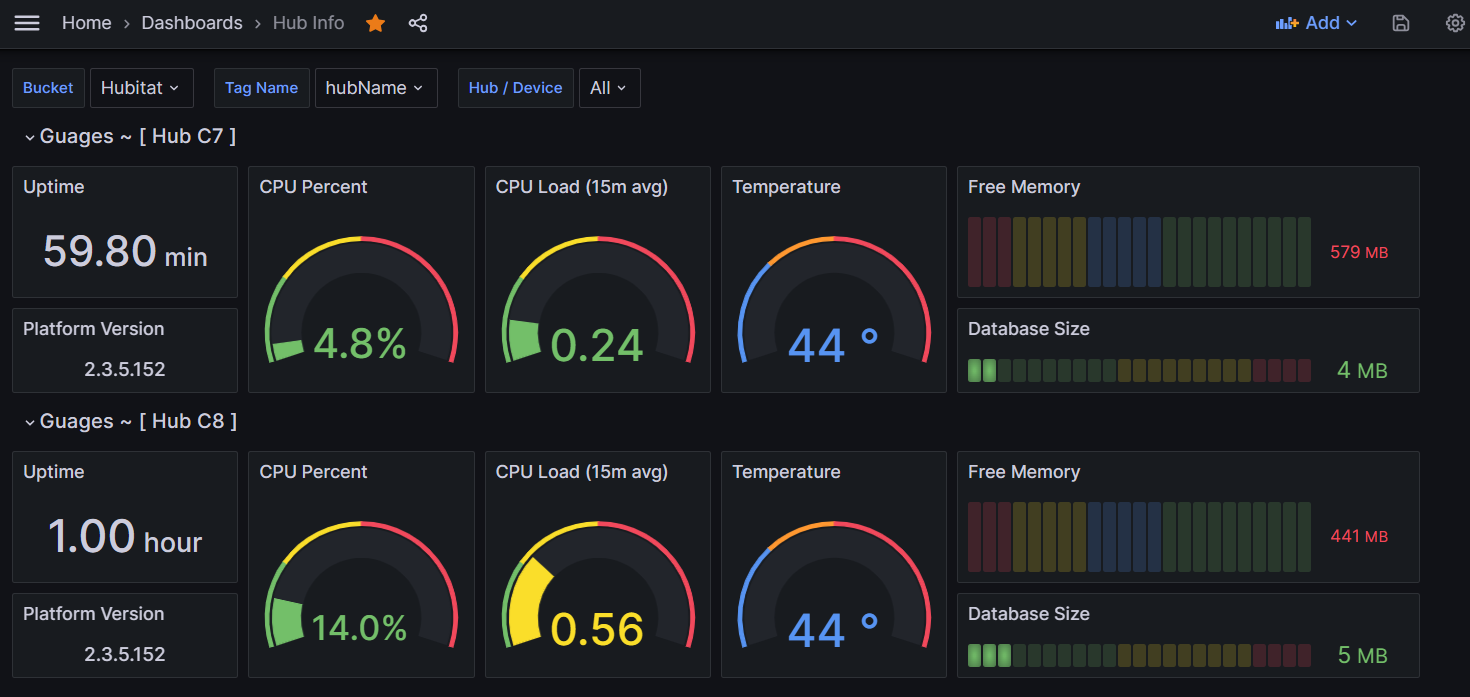
Here is one of my dashboards that simply shows various temps throughout the house.
Log into Grafana and click on the 3-line sandwich icon in the upper left of the page. Then click on Dashboards. This will load the Dashboard page that will list all of the dashboards you have loaded. From here on the far right of the window there will be an option for “New” Select that and click on Import. Now past the Raw JSON data you copied into the window labled “Import via panel json” and click load.
Now you should have the dashboard available in the list and you can open it. Now based on the dashboard you will need to likely fill in variable across the top to enable access to your specific InfluxDB Database for HE. Once all the variables are setup Click on save and select the checkbox to save the variable settings. Lastly click Save Again. Now you have a working dashboard.
It uses the standard pi password which you probably should change, The influx DB is using a DB name with Hubitat as the database and hubitat/hello123 for the userid/password.
It also has Node-Red if you want to use it. I also loaded docker and installed NGINX and Portainer in case you want to use it.
http://(Pi_IP):81 will take you to Nginx Admin Page (Userid: admin@example.com Password: changeme)
http://(Pi_IP):1880 will take you to Node-Red
http://(Pi_IP):3000 will take you to Grafana log in page (Userid: admin Password: admin This should be changed once logged in)
http://(Pi_IP):9000 Portainer.io log in page (will make you set credentials upon first login)
Upgrade Procedures to InfluxDB v3 (Follow with Caution)
There are a few key factors with upgrading to influxDB v3.
InfluxDB v3 use a multilevel database that keeps frequently accessed information in memory, and after some time data is aged into a space that is stored locally and free's up memory
For home use you need to ensure you install InfluxDB with the proper environment variables selected to perform retrieve a At-Home License. It does not expire
Because of item 1 above it is critical to set a few environment variables correctly You must set the environment variable "INFLUXDB3_FORCE_SNAPSHOT_MEM_THRESHOLD" and "INFLUXDB3_EXEC_MEM_POOL_BYTES" to something reasonable for your environment. In my case i set INFLUXDB3_FORCE_SNAPSHOT_MEM_THRESHOLD to 128 which is 128MB and INFLUXDB3_EXEC_MEM_POOL_BYTES to 4294967296 which is 4 Gigabytes. Without these settings you will likely cause your system to run out of memory and crash.
Here are the values I updated in my docker-compose.yml file installed by the install script for a Raspberry Pi 4 8GB version. You can access this file from your home directory then ~/.influxdb/docker/docker-compose.yml.
Install Influxdb v3 and set the variables above as indicated.
Depending on how you installed Influxdb v3 It may have created a token for you. Take note of that somehwere for safe keeping. If it did not connect console of InfluxDB v3 and run the command below to create your token
influxdb3 create token --admin
Once you have your new token update the install of the Influxdb v3 to include the token as a environment variable
If you did not install Influxdb Explorer please install it now. Use the key in the previous step. This tool will help you manage Influxdb
Create your Hubitat database in Influxdb v3. You can easily do this in Influxdb Explorer, or from the command line. If you didn't add your token to a environment variable this will fail along with any remaining commands dne from the influxdb container.
influxdb3 create database <db_name>
Once the DB is created we need to setup the InfluxDB Importer Plugin. You can see this plugin in the Influxdb explorer tool
a. First install the Prereq
d. Test the plug-in. You should get a return with the version of the new database,
curl -X POST http://localhost:8181/api/v3/engine/import?action=test_connection -H "Authorization: Bearer <token>" -d '{"source_url": "http://<localhost or IP of Influxdb v3 database>:8181"}'
This means the InfluxDB Importer is setup correctly. Last step to allow you to control the importer is to go into InfluxDB Explorer, go to the Manage Plugins Dashboard and click on edit the toggle to run Asynchronosly. This will allow you to use the pause or cancel commands if needed.
At this point you should be ready to perform the import of data from your older InfluxDB database. From a machine you can run curl on you will need to submit the command to start the importer. In my case i used
curl -X POST http://<influxDB v3 IP>:8181/api/v3/engine/import?action=start \
  -H "Authorization: Bearer <Influxdb v3 token>" \
  -H "Content-Type: application/json" \
  -H "Source-Token: <source_Token>" \
  -d '{
    "source_url": "http://<SourceDB>:<Source DB Port>",
    "influxdb_version": <Source DB Version number>,
    "source_database": "<Source DBName>",
    "dest_database": "<Destination DB>",
	"table_filter": "<Measurements to move to Influxdb3 seperated by .>",
	"end_timestamp": "2026-03-15T17:51:51Z",
	"query_interval_ms": 5000,
	"target_batch_size": 10000
  }'
Some of those options in that curl string to start the import or optional. You can find detailed documentation as to the options and additional commands for the importer here.
Once that is submitted you will see how well you adjusted your setup for your memory configuration. You can monitor the progress of the Importer by watching its logs from the Manage Plugins Dashboard. What you should see is that the Importer goes through all of the tables and begins the import. As it progresses you will see were queries a measurement for a given time range and then imports it into your new InfluxDBv3 environment. You will find times were the DB seems inaccessible which is due to the DB moving records from WAL to parquet files. InfluxDB Logger on the Hubitat hub will simply hold the records until the DB is avaliable again. My InfluxDB Logger will likely drop the logs though so keep that in mind.
I also have a Grafana dashboard i have created to monitor my import if that will help.
Update I have found under intense loading at times the Memory consumption does jump into range of 10-14GB. I believe this is partially due to the high "Thread Batch Size" value. The Import Plugin tries to find a good interval to try to be close to that, and sometimes it doesn't do as good of a job. Just keep that in mind when performing these tasks. It may be better to use a smaller query interval with a lower Target Batch size so you can have more consistant loading.
Using InfluxDB3 MQTT Subscriber Plugin with Hubitat MQTT Exporter
Once you have a working envrionment you may want to use MQTT to load information into the Database from the hub. There are 4 things you need to do
Setup the MQTT Exporter on Hubitat as a service
Copy the mqtt_subsciber.py and configuration file to your local plugin directory
Adjust any setup you want need to
Create the database trigger using the associated configurations and files.
First fallow the standard procedure to create a MQTT Exporter configuration on your hub. Make sure you select the devices you want to retrieve configuration data from to include in your MQTT Exporter configuration. You will want to use the local serivce as that will create a broker for Influxdb3 to connect to. Take note of the user id and password provided as part of the MQTT Exporter setup. The user id and password will need to be setup in the configuration file
Retrieve the below files and upload them to your influxDB instance in the plugin folder: MQTT_Subscriber.py MQTT_Congifuration.toml
These need to be in the defined Influxdb Plugin folder based on your install. Make sure you place them correctly.
The python script is a modified version of the official subcriber plugin. It has a few important tweaks to make it work for our needs related to Hubitat.
Open up the configuration file in your prefered text editor and scroll down until you see the "mqtt" section
Further down the file there is a mapping.json which is fairly large. This section contains all of the mapping information that tells the plug how to import data from Hubitat.
It will start with a value that tells the plug in where the measure ments are. Don't change this as it should be consistant for all of us. The value is shown below
attribute_name_path = "$.attributes[*].name"
The second section is a filter that tells the plugin what attribues to capture and load into influxdb. Similar to InfluxDB Logger each attribute gets its own table in the DB. This filter can get fairly large if you track allot of info below is a reduced view of this value. The downloaded file includes all of the items i am currently tracking and is much larger then the list below
Below the attribute filter are lines that determines the name of the tables based on the attribute and how to determine the time of the record. This should not need to be modified. As is it will create a table for each attribute
# table_name = "sensor_data"
table_name_field = "$.attributes[*].name"
# Timestamp from message (milliseconds since epoch)
timestamp_field = "$.lastActivity:datetime"
The last bit of configuration data in the configuratin file should look like like below. The only thing you may want to adjust is the text next to hubName. The Hub Name is applied to every record.
 Tags: indexed fields for efficient filtering
[mapping.json.tags]
deviceId = "$.id"
deviceName = "$.name"
hubName = "Home C8 Pro"
unit = "$.attributes[*].unit"
# Fields: measurement values with type specification
# Supported types: int, uint, float, string, bool
[mapping.json.fields]
# 1. The 'value' field uses the new dictionary format for dynamic typing
[mapping.json.fields.value]
path = "$.attributes[*].value"
type = "string" # Default fallback
type_path = "$.attributes[*].dataType"
  [mapping.json.fields.value.type_mapping]
  "NUMBER" = "float"
  "INTEGER" = "int"
  "FLOAT" = "float"
  "STRING" = "string"
  "BOOLEAN" = "bool"
  "DATE" = "string"
  "ENUM" = "string"
This process was tweaked to match the data that InfluxDB Logger is loading into the the DB so in theory you should be able to switch between them as you want to.
The final step to start the import with MQTT is to create the database Trigger on the InfluxDB Database. This can be done by accessing the Influxdb environment so youc an submit the InfluxDB3 command. Then submit a command as shown below for your environment
Now you should be able to open up InfluxDB UI, go to the open the Manage Plugins section and then select Plugins Dashboard. And see a entry for for mqtt_Hubitat_devices. You should be able to click on "Logs" and see logs that show now many messages are being processed. Though it collects information in a given interval it oes get messages for activity in between each interval.
@mavrrick58,
Thanks for this guide.
I have setup InfluxDB cloud and Grafana local on Debian OS.
I have tried to follow all the steps in the above guide; all went well, with the exception of data source v1, I get permission or access denied error.
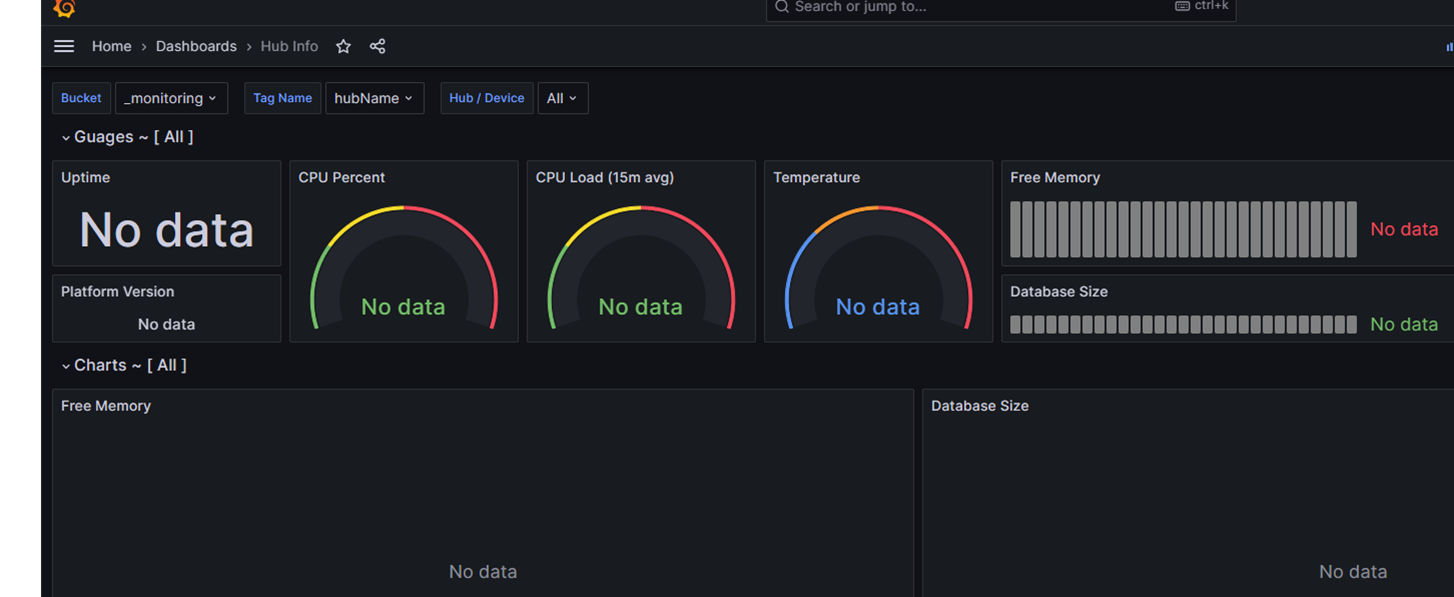
I have also imported the above read-to-use dashboard, but no data is being displayed, see below:
You dont need a v1 data source setup unless you have legacy dashboards coded in QL.
My dashboard you loaded in the Flux version. Did you try selecting a bucket (in the dashboard dropdowns) where you have the data going? _monitoring is one of the default buckets.
Also wondering since you have a local Debian server why use cloud influx? I would set it all up locally.
As @jtp10181 mentioned the V1 Datasource is really a backward compatibility thing and shouldn't be needed for many of his dashboards. His dashboards will work with the V2 Datasource that uses the Flux query language. So the first thing I would do is make sure you update the bucket to reflect the correct Bucket setup in your cloud option. DId you create the V2 Datasource?
That said I am not 100% clear on where the v1 Datasource failure is occurring. Did it fail when you submitted the curl command to create the DBRP, or when you tried to have Grafana connect to it.
Thanks guys, much appreciated. @jtp10181,
Yes, I did try selecting the correct bucket in the dashboard dropdowns, but still no data!?
I have a newly installed Debian server 12 on a thin client (Wyse 5070) with Home Assistant installed in a container in supervised mode.
I have tried to install influxDB locally, but can't get it to do the final step i.e. display in the browser - I've tried to follow several guides on the internet, and failed.
@mavrrick58,
I am unable to perform the curl command, I get a permission error if I recall.
I will check and review the data source v2 guide/option again later this evening.
Once you select a bucket, you also need to select the "tag", try hubName or deviceName. hubName requires the setting enabled in Influx Logger to send the hub name as a tag. deviceName should always work.
You can also check your bucket for data by logging into the InfluxDB web interface and using the data explorer.
Turn on higher logging from InfluxDB logger also, and watch the logs. Force a refresh from the Hub Info driver, and the logger should pick it up and queue it to be sent to Influx.
What version of InfluxDB were you installing with the guides. I never got the WEB Gui to display with influxDBv1 which allot of guides install. That is why in this thread i direct you to the documentation and steps to isntall InfluxDB v2.7. As @jtp10181 points out the documenation is pretty good and is basically what i used to create what is above. It should just be those 3 commands. I will create a VM and test the install with Debian myself to see if there is anything funny about it.
If the curl command failed can you confirm you set all of the values based on what you created.
You should be updating the URL for your instance, the Token, Bucket id, the database to use and then the ORG id. Then just make something up for the retention_Policy.
An access denied error would tend to indicate one of the below values is incorrect
The token,
Bucket ID
Org ID
URL is incorrect
Are we sure influxDB Logger is putting data into InfluxDB Cloud?
Thanks guys.
I've had another look at my Debian server - not 100% sure, but it seems that tailscale was causing some network access issues as I was not able to access Home Assistant locally without being connected to tailscale.
Anyway, I have setup the server again and just reinstalled HA without tailscale and did the steps again.
After that, I was able to setup local influxdb with the above linux commands without any issues and followed instructions for data source v2 and it's all working now
Looks like you have free mem set to MB on the driver, my Free memory chart is meant to have the free memory unit set to KB, that was the only option for quite some time with the Info Driver.
You could edit the guage and chart and switch the "unit" on it to make it work with MB if you want. Change it to Data / megabytes and it should work better.
Going to do some experimenting with Grafana cloud to see how that could fold into this as well now. I have it configured with InfluxDB Cloud already and imported the "Hub Info" Dashboard provided by @jtp10181 It seems to works well.
You can send to the same bucket. I would suggest making sure the option to send the hub name is enabled. Also, avoid duplicate device names since thats usually how you display and group stuff on charts.


