I've done large scale networks that we did everything in either Transformers names or Disney names, ![]()
1 Like
Did atomic element weights once. There was actually an argument over whether uranium would be host 238 or 235, and who's system it would be. 
2 Likes
is there supposed to be a link here? I'm lost once i get to setting up Grafana.
Devices all live on one hub and are hubmeshed to the other hub with apps. The linked devices on the app hub all appended with a Lock emoji. Is that ok?
Device Hub:
Same device linked to the APPS hub:
I would just make sure you only share the devices from the hub they are paired to.
For Hub Info Driver, I would give each hub a uniquie name for the driver to be safe.
The data wont actually clash if they are the same, because it also uses the device ID and a timestamp for each entry, its just when using charts if two devices have the same name they may get grouped together.
3 Likes
You can also use the hubName as a tag to separate them, but it makes (more) sense to name the devices appropriately to avoid collision with the device name alone. I.E. "Master Bedroom Reading Light" rather than just "Reading Light"
2 Likes
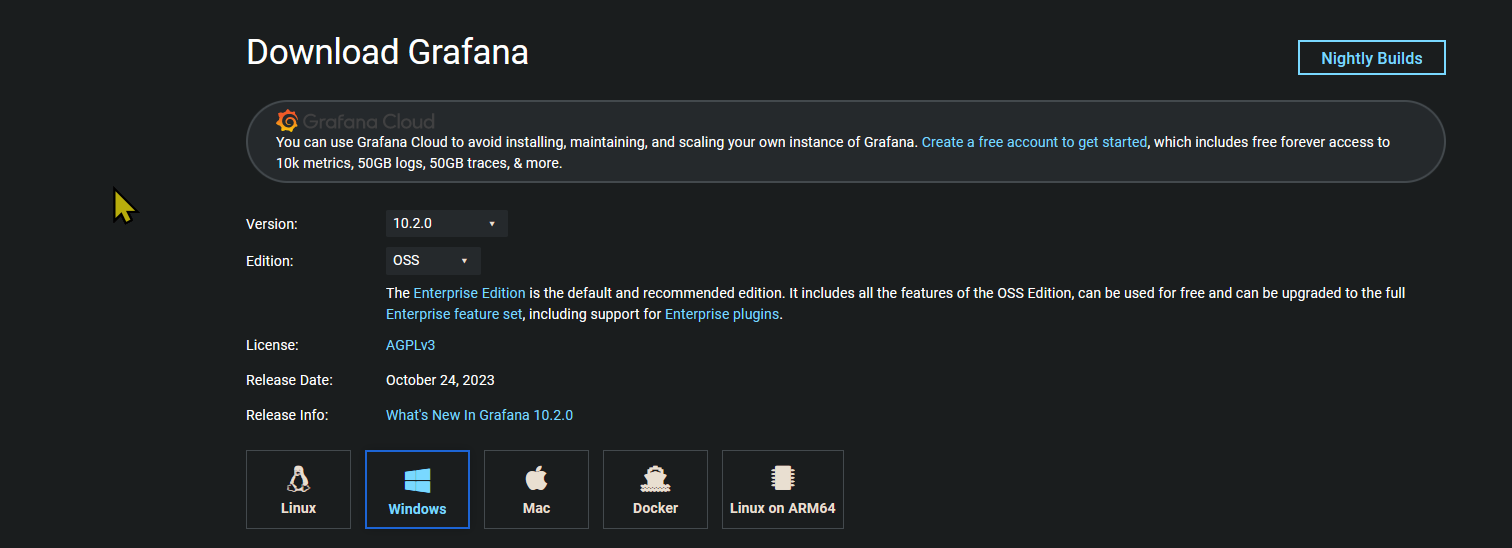
IT looks lie the Garfana section of these instructions has either changed significantly, or is incomplete. IT s there is supposed to be a link to Garfana installation instructions, but there is no actual link to go to. I assume i need to Download Garfana? The current version 10.2.0. As I go to install i am immediately presented with this

not sure which way to go.
Also to not I was trying to go the Garfana Code route last night and was never sent the required verification code to continue. Since I haven't gotten past the install, I'm not even sure about the rest of it, but looking at it, seems to be a lot of Greek there. Am i also going to be pulling stuff from GitHub?
I added the install link up there in the post that describes it.
Unless you have a real need for it to be local, I would suggest using the Influxdb Cloud and Grafana Cloud to simplify setup. The directions I provided above were for installing it on ubuntu/linux
It looks like you want to install this on windows. Is this your always on computer that you also have InfluxDB on? Just trying to understand what you are trying to do.
It has been a while but i did install grafana on a windows computer for testing something a while back. It shouldn't be to hard as from their all you should need to do is click on next and then at some point adjust the location of the storage to where you want to put it.
Yes, windows. But if its cloud is there still an installation required? I have no issue with the cloud, it was just that I wasn't getting the confirmation emails. Apparently they shut that server down on weekends, as there were seven emails in my junk folder in the span of about 10 minutes about an hour ago. So I finally got the cloud account signed up and confirmed . Still feeling somewhat lost.
I was able to get the InfluxDB cloud account set up and all of that done just fine. Its this Grafana that is where i'm having problems understanding and setting it up.
I am assuming for Edition, I want OSS?
The Grafana cloud does not require any kind of installation. The Grafana Cloud can be setup at this link Grafana Cloud
Simply put when you register and setup your account they will create a instance for you. Then you just go to that URL and log in and it will take you into your instance of grafana. I just logged into my account i setup for testing a while back.
Once you got that, all you need to do is setup the database connector to your InfluxDB Cloud account just as you would with the OSS version of Grafana. Then import the dashboards you want.
When you connect to your grafana cloud it will look something like this.

Click on the +Connect Data button in the upper right and then on the following page type in Influx as shown here and the INfluxDB item should appear.
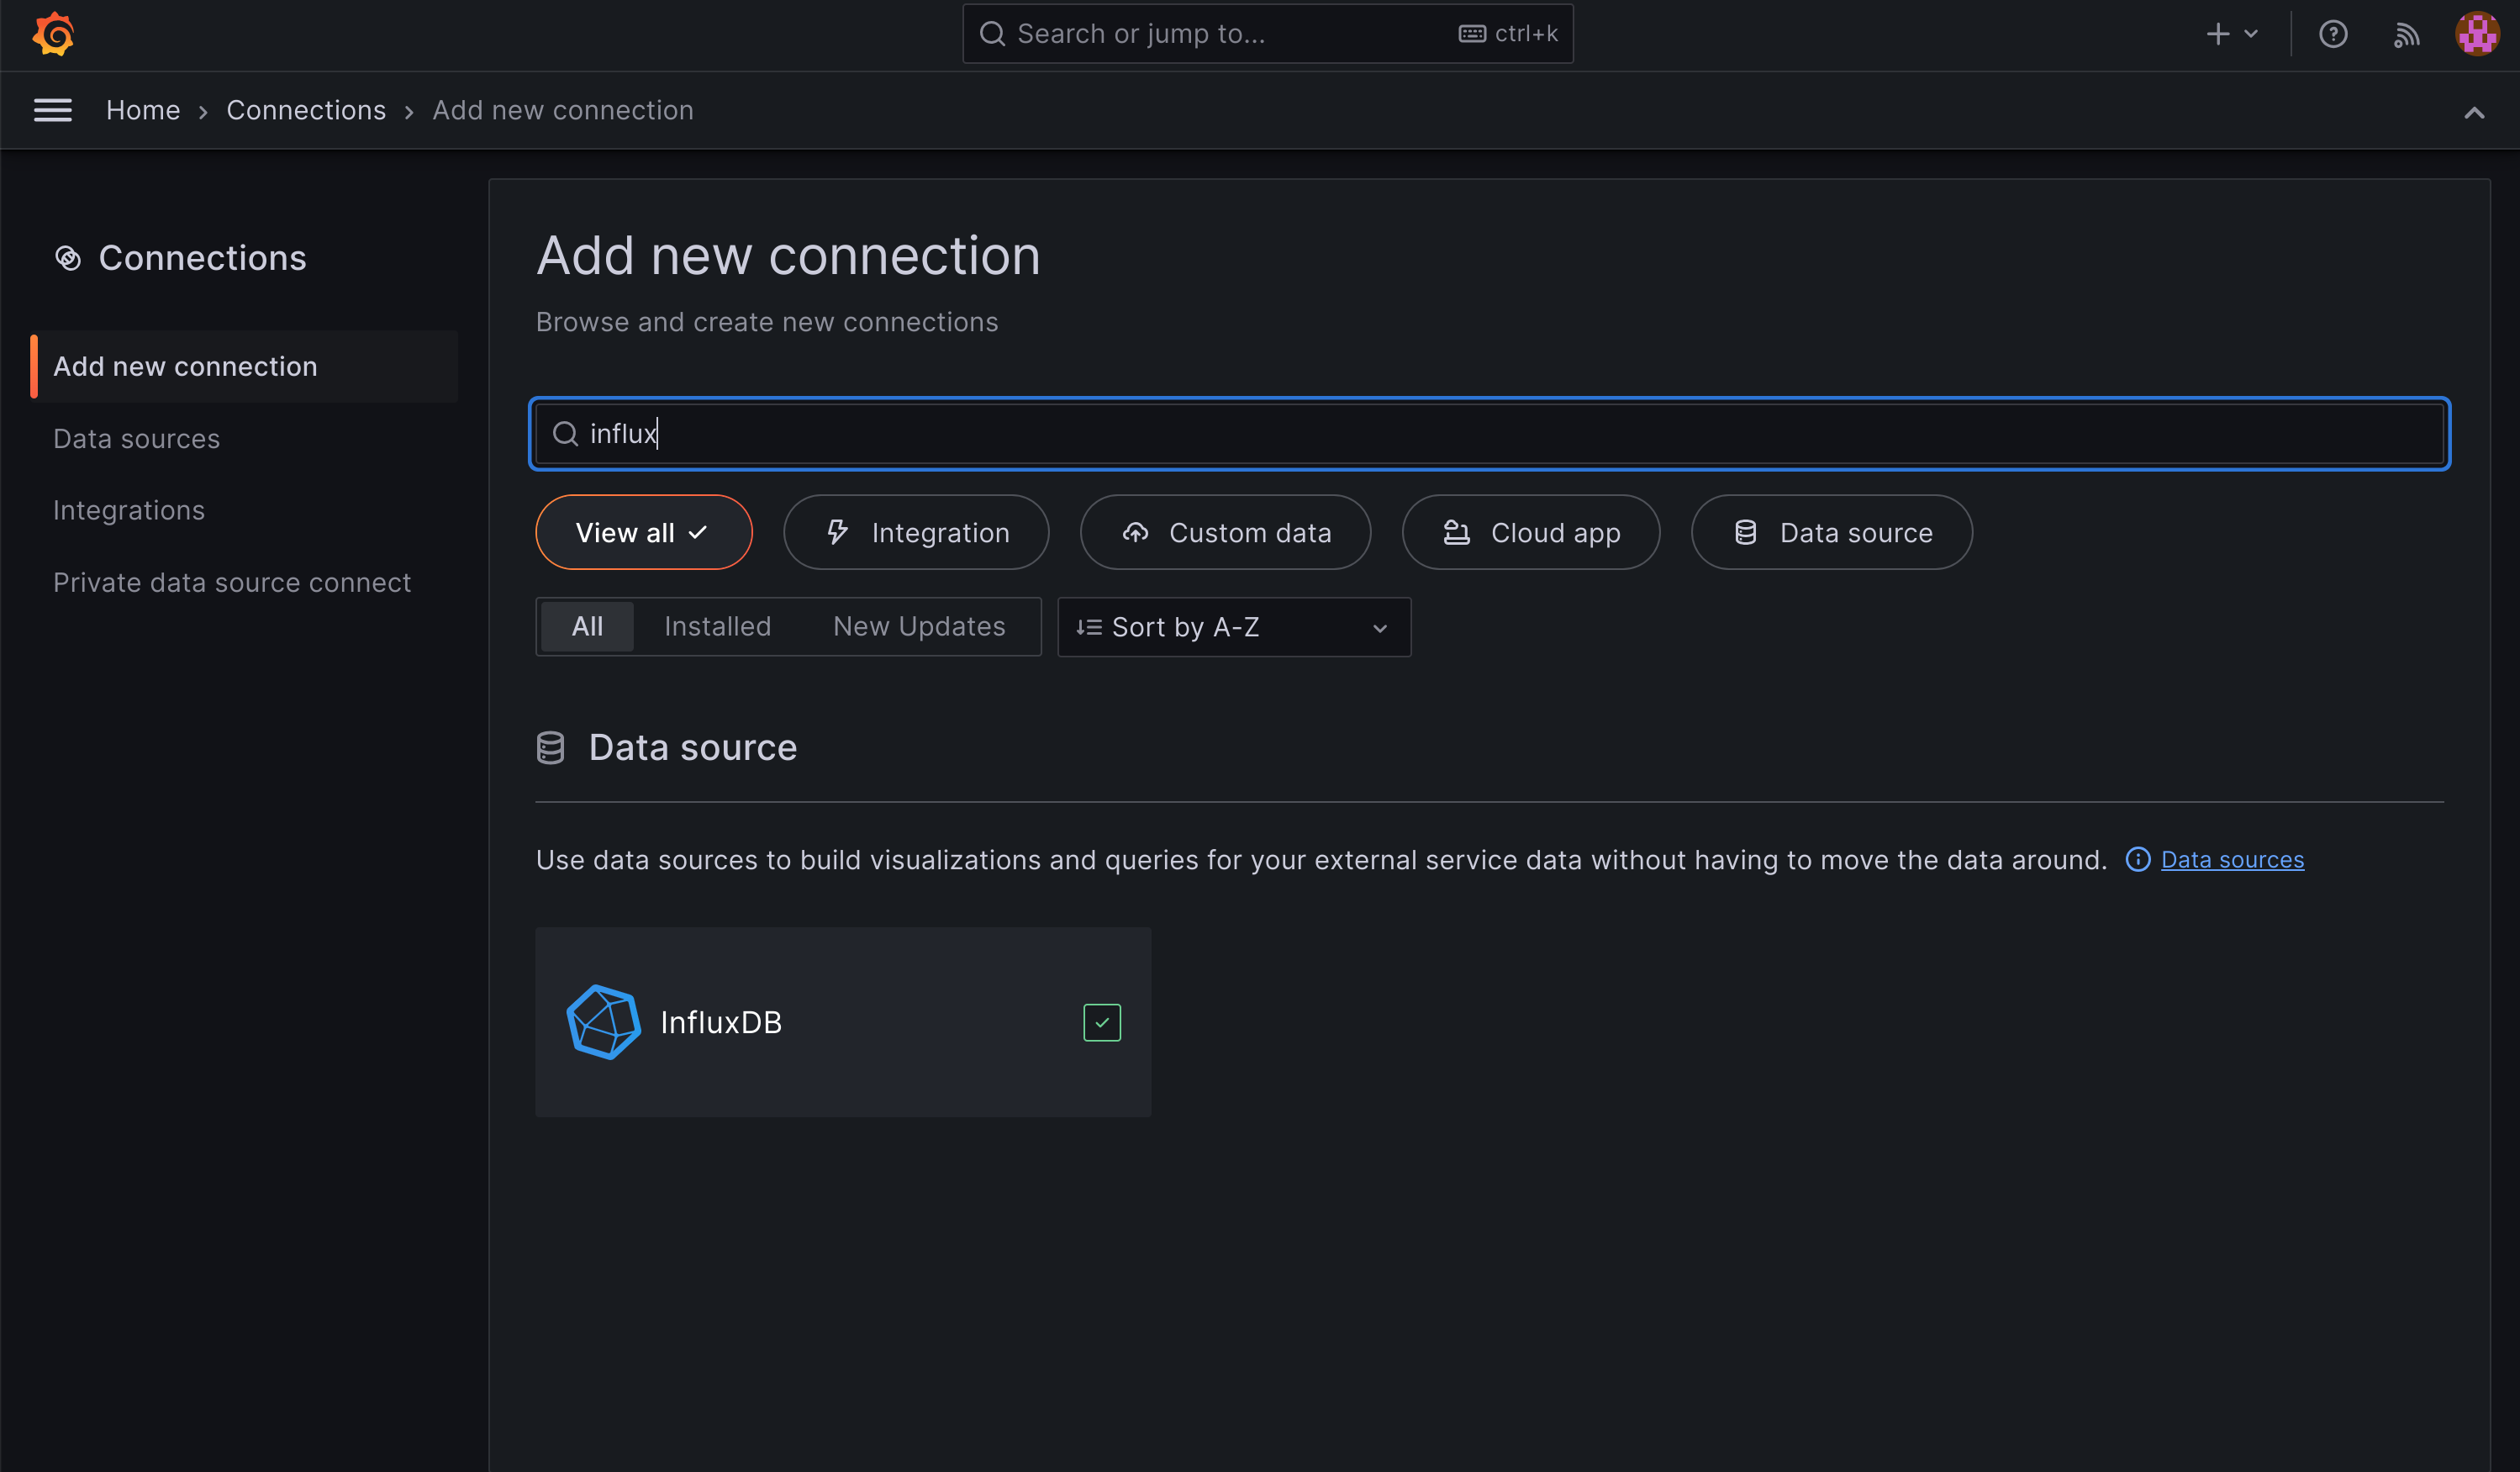
Click on the INfluxDB item to setup the database connection to your INfluxDB Cloud Account.
You should have all of the needed info saved in the tip sheet i created in the first post if you have been capturing it..
Give the datasource a meaningful Name, and specify the Flux Query language. Then scroll down and fill in the remaining influxdb access info. Put in the ORG you specified when setting up your InfluxDB Cloud account. Then your API Token you collected for the account and then lastly the Bucket as that is where the data is being put. These should also match what you are already using for INfluxDB Logger. Then click on Save & Test and you should get a successful message.
Lastly import the dashboard following the directions provided early in this thread.
One thing to understand is the cloud instance does have some built in dashboards for other things related to the cloud instance so you may not want to delete those incase you ever want to see stats on your cloud instance.
The info in your last post is related to INfluxdb 1.x compatibility and using the legacy method for querying. Most likely not needed unless you already have dashboards that use that method. I you are just going to use the dashboards @jtp10181 has in his thread linked in post 4 those all have Flux versions, so not needed. The post i made describes creating the Grafana Datasource only needs the API Token you already have.
What are you planning on visualizing?
1 Like
Well , to be honest I'm just going down the instructions in order. I currently have nothing. Im just starting to look at this to see what all I can do with it. I still need to play with it to figure out what all I can do. Off the top of my head I'm thinking the "normal" stuff. CPU load, memory etc.

Looks good. now go to this post by @jtp10181.
Scroll down to the bottom of the first post and follow the link to download the HubInfo Dashboard. That will give you the CPU, Memory, ect graphed.
Then follow the directions to import it into Grafana
1 Like
@mavrrick58 Thank you for your assistance so early! I think Im to a place I can play with it to figure out what all I can do with it now!
1 Like
Having a simple error (I am a simpleton).
Getting persistent error in logs...

InfluxDB settings:
InfluxDB Logger settings: I've tried both "Home" and HomeAbraCadabra" as the "Org*" entry.

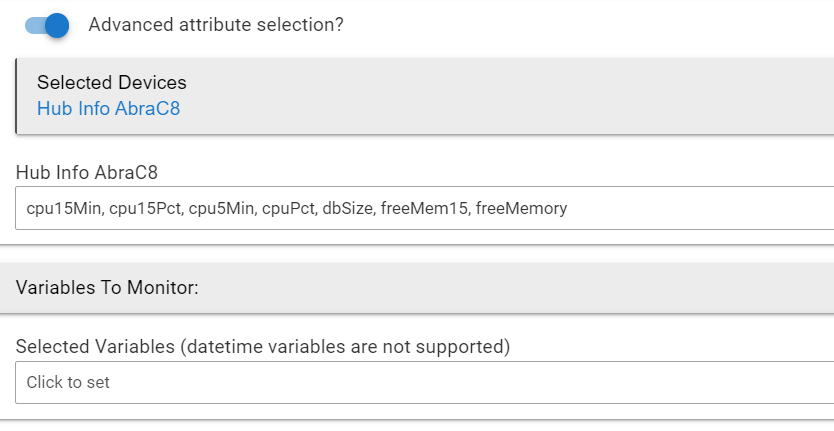
Using default setttings, monitoring items below:
What obvious thing am I missing this time?
I think the problem is you have the full url entered were you just need the host name.
Take https:// out of that field.
The app knows to use https based on if you specify ti yse TLS.
2 Likes
DOH...did this in another automation quite a while ago! I'll give it a go.
Did it! Thanks for getting me over the hump, and for the detailed write-up!
Working - combined w/@jtp10181's dasboards I'm up and running! Thanks to both of you!
2 Likes

