Ready-to-Use Grafana Dashboards! - Beta Test / Feedback

Did you export that for sharing? I am having to fix all the variables to use the data source variable
After loading.

image

Fixed

All the charts appear to be using the default data source as well, not sure if its an export issue or the way you have it setup.

Tried importing again and selected it at import and it switched it all. Wondering if maybe the export for sharing breaks the datasource selection dropdown. Might be better to get rid of that in that case, not sure yet.

It is probably me. I exported that one again and made sure the option for "Export for share" was selected. Let me know if that works better.

I tried exporting it again this time saving it to a text file and then coping the contents out of that file. Lets see if that helped.

I just did a few more tests and it looks like the import process will set the variable database to what is select when you do the import. Does it work better if you select your V1 DBRP database source connection for the DB used during the import? That seems to work every time. It does potentialy cause issues if users have both setup.

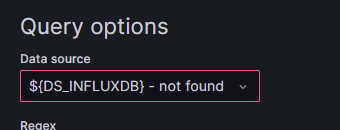
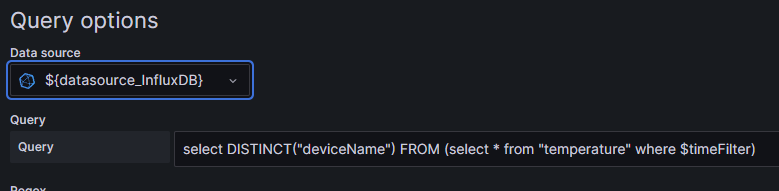
So when you don't export it for sharing it doesn't prompt for a database on import. Then it doesn't change the Variables datasource to a db and leaves them as variables.

Try this json to import it. I think I finally got it working in my setup.

{
  "annotations": {
    "list": [
      {
        "builtIn": 1,
        "datasource": {
          "type": "datasource",
          "uid": "grafana"
        },
        "enable": true,
        "hide": true,
        "iconColor": "rgba(0, 211, 255, 1)",
        "name": "Annotations & Alerts",
        "target": {
          "limit": 100,
          "matchAny": false,
          "tags": [],
          "type": "dashboard"
        },
        "type": "dashboard"
      }
    ]
  },
  "editable": true,
  "fiscalYearStartMonth": 0,
  "graphTooltip": 0,
  "id": 17,
  "links": [],
  "liveNow": false,
  "panels": [
    {
      "datasource": {
        "type": "influxdb",
        "uid": "${datasource_InfluxDB}"
      },
      "fieldConfig": {
        "defaults": {
          "color": {
            "mode": "fixed"
          },
          "custom": {
            "fillOpacity": 70,
            "lineWidth": 0,
            "spanNulls": false
          },
          "displayName": "HVAC Activity",
          "mappings": [
            {
              "options": {
                "cooling": {
                  "color": "dark-blue",
                  "index": 3,
                  "text": "Cooling"
                },
                "fan\\ only": {
                  "color": "dark-green",
                  "index": 2,
                  "text": "Circulation Only"
                },
                "heating": {
                  "color": "dark-red",
                  "index": 0,
                  "text": "Heating"
                },
                "idle": {
                  "color": "transparent",
                  "index": 1,
                  "text": "Idle"
                }
              },
              "type": "value"
            }
          ],
          "thresholds": {
            "mode": "absolute",
            "steps": [
              {
                "color": "green",
                "value": null
              }
            ]
          }
        },
        "overrides": []
      },
      "gridPos": {
        "h": 5,
        "w": 23,
        "x": 0,
        "y": 0
      },
      "id": 2,
      "options": {
        "alignValue": "left",
        "legend": {
          "displayMode": "list",
          "placement": "bottom",
          "showLegend": true
        },
        "mergeValues": true,
        "rowHeight": 0.9,
        "showValue": "never",
        "tooltip": {
          "mode": "single",
          "sort": "none"
        }
      },
      "targets": [
        {
          "alias": "$tag_deviceName",
          "datasource": {
            "type": "influxdb",
            "uid": "${datasource_InfluxDB}"
          },
          "groupBy": [
            {
              "params": [
                "$__interval"
              ],
              "type": "time"
            },
            {
              "params": [
                "deviceName"
              ],
              "type": "tag"
            }
          ],
          "measurement": "thermostatOperatingState",
          "orderByTime": "ASC",
          "policy": "$datasource_InfluxDB",
          "refId": "A",
          "resultFormat": "time_series",
          "select": [
            [
              {
                "params": [
                  "value"
                ],
                "type": "field"
              },
              {
                "params": [],
                "type": "distinct"
              }
            ]
          ],
          "tags": [
            {
              "key": "deviceName",
              "operator": "=~",
              "value": "/^$thermostat$/"
            }
          ]
        }
      ],
      "title": "HVAC Activity",
      "type": "state-timeline"
    },
    {
      "datasource": {
        "type": "influxdb",
        "uid": "${datasource_InfluxDB}"
      },
      "fieldConfig": {
        "defaults": {
          "color": {
            "mode": "palette-classic"
          },
          "custom": {
            "axisCenteredZero": false,
            "axisColorMode": "text",
            "axisLabel": "Temperature",
            "axisPlacement": "left",
            "axisWidth": 80,
            "barAlignment": 0,
            "drawStyle": "line",
            "fillOpacity": 0,
            "gradientMode": "none",
            "hideFrom": {
              "legend": false,
              "tooltip": false,
              "viz": false
            },
            "lineInterpolation": "linear",
            "lineWidth": 1,
            "pointSize": 5,
            "scaleDistribution": {
              "type": "linear"
            },
            "showPoints": "auto",
            "spanNulls": false,
            "stacking": {
              "group": "A",
              "mode": "none"
            },
            "thresholdsStyle": {
              "mode": "off"
            }
          },
          "mappings": [],
          "thresholds": {
            "mode": "absolute",
            "steps": [
              {
                "color": "green",
                "value": null
              },
              {
                "color": "red",
                "value": 80
              }
            ]
          }
        },
        "overrides": []
      },
      "gridPos": {
        "h": 6,
        "w": 23,
        "x": 0,
        "y": 5
      },
      "id": 4,
      "options": {
        "legend": {
          "calcs": [],
          "displayMode": "list",
          "placement": "bottom",
          "showLegend": true
        },
        "tooltip": {
          "mode": "single",
          "sort": "none"
        }
      },
      "targets": [
        {
          "alias": "$tag_deviceName",
          "datasource": {
            "type": "influxdb",
            "uid": "${datasource_InfluxDB}"
          },
          "groupBy": [
            {
              "params": [
                "$__interval"
              ],
              "type": "time"
            },
            {
              "params": [
                "deviceName"
              ],
              "type": "tag"
            },
            {
              "params": [
                "linear"
              ],
              "type": "fill"
            }
          ],
          "measurement": "temperature",
          "orderByTime": "ASC",
          "policy": "$datasource_InfluxDB",
          "refId": "A",
          "resultFormat": "time_series",
          "select": [
            [
              {
                "params": [
                  "value"
                ],
                "type": "field"
              },
              {
                "params": [],
                "type": "mean"
              }
            ]
          ],
          "tags": [
            {
              "key": "deviceName",
              "operator": "=~",
              "value": "/^$outdoor_Temp_Sensors$/"
            }
          ]
        }
      ],
      "title": "Outdoor Temp Sensors",
      "type": "timeseries"
    },
    {
      "datasource": {
        "type": "influxdb",
        "uid": "${datasource_InfluxDB}"
      },
      "fieldConfig": {
        "defaults": {
          "color": {
            "mode": "palette-classic"
          },
          "custom": {
            "axisCenteredZero": false,
            "axisColorMode": "text",
            "axisLabel": "Temperature",
            "axisPlacement": "left",
            "axisWidth": 80,
            "barAlignment": 0,
            "drawStyle": "line",
            "fillOpacity": 0,
            "gradientMode": "none",
            "hideFrom": {
              "legend": false,
              "tooltip": false,
              "viz": false
            },
            "lineInterpolation": "linear",
            "lineWidth": 1,
            "pointSize": 5,
            "scaleDistribution": {
              "type": "linear"
            },
            "showPoints": "auto",
            "spanNulls": false,
            "stacking": {
              "group": "A",
              "mode": "none"
            },
            "thresholdsStyle": {
              "mode": "off"
            }
          },
          "mappings": [],
          "thresholds": {
            "mode": "absolute",
            "steps": [
              {
                "color": "green",
                "value": null
              },
              {
                "color": "red",
                "value": 80
              }
            ]
          }
        },
        "overrides": []
      },
      "gridPos": {
        "h": 6,
        "w": 23,
        "x": 0,
        "y": 11
      },
      "id": 5,
      "options": {
        "legend": {
          "calcs": [],
          "displayMode": "list",
          "placement": "bottom",
          "showLegend": true
        },
        "tooltip": {
          "mode": "single",
          "sort": "none"
        }
      },
      "targets": [
        {
          "alias": "$tag_deviceName",
          "datasource": {
            "type": "influxdb",
            "uid": "${datasource_InfluxDB}"
          },
          "groupBy": [
            {
              "params": [
                "$__interval"
              ],
              "type": "time"
            },
            {
              "params": [
                "deviceName"
              ],
              "type": "tag"
            },
            {
              "params": [
                "linear"
              ],
              "type": "fill"
            }
          ],
          "measurement": "temperature",
          "orderByTime": "ASC",
          "policy": "$datasource_InfluxDB",
          "refId": "A",
          "resultFormat": "time_series",
          "select": [
            [
              {
                "params": [
                  "value"
                ],
                "type": "field"
              },
              {
                "params": [],
                "type": "mean"
              }
            ]
          ],
          "tags": [
            {
              "key": "deviceName",
              "operator": "=~",
              "value": "/^$hvac_temp_Sensors$/"
            }
          ]
        }
      ],
      "title": "HVAC Aux Temp Sensors",
      "type": "timeseries"
    },
    {
      "datasource": {
        "type": "influxdb",
        "uid": "${datasource_InfluxDB}"
      },
      "fieldConfig": {
        "defaults": {
          "color": {
            "mode": "palette-classic"
          },
          "custom": {
            "axisCenteredZero": false,
            "axisColorMode": "text",
            "axisLabel": "Temperature",
            "axisPlacement": "left",
            "axisWidth": 80,
            "barAlignment": 0,
            "drawStyle": "line",
            "fillOpacity": 0,
            "gradientMode": "none",
            "hideFrom": {
              "legend": false,
              "tooltip": false,
              "viz": false
            },
            "lineInterpolation": "linear",
            "lineWidth": 1,
            "pointSize": 5,
            "scaleDistribution": {
              "type": "linear"
            },
            "showPoints": "auto",
            "spanNulls": false,
            "stacking": {
              "group": "A",
              "mode": "none"
            },
            "thresholdsStyle": {
              "mode": "off"
            }
          },
          "mappings": [],
          "thresholds": {
            "mode": "absolute",
            "steps": [
              {
                "color": "green",
                "value": null
              },
              {
                "color": "red",
                "value": 80
              }
            ]
          }
        },
        "overrides": []
      },
      "gridPos": {
        "h": 6,
        "w": 23,
        "x": 0,
        "y": 17
      },
      "id": 6,
      "options": {
        "legend": {
          "calcs": [],
          "displayMode": "list",
          "placement": "bottom",
          "showLegend": true
        },
        "tooltip": {
          "mode": "single",
          "sort": "none"
        }
      },
      "targets": [
        {
          "alias": "$tag_deviceName",
          "datasource": {
            "type": "influxdb",
            "uid": "${datasource_InfluxDB}"
          },
          "groupBy": [
            {
              "params": [
                "$__interval"
              ],
              "type": "time"
            },
            {
              "params": [
                "deviceName"
              ],
              "type": "tag"
            },
            {
              "params": [
                "linear"
              ],
              "type": "fill"
            }
          ],
          "measurement": "temperature",
          "orderByTime": "ASC",
          "policy": "$datasource_InfluxDB",
          "refId": "A",
          "resultFormat": "time_series",
          "select": [
            [
              {
                "params": [
                  "value"
                ],
                "type": "field"
              },
              {
                "params": [],
                "type": "mean"
              }
            ]
          ],
          "tags": [
            {
              "key": "deviceName",
              "operator": "=~",
              "value": "/^$alt_Indoor_Temp$/"
            }
          ]
        }
      ],
      "title": "Alt Indoor Temp Sensors",
      "type": "timeseries"
    }
  ],
  "refresh": "",
  "schemaVersion": 38,
  "style": "dark",
  "tags": [],
  "templating": {
    "list": [
      {
        "current": {
          "selected": true,
          "text": "default",
          "value": "default"
        },
        "hide": 0,
        "includeAll": false,
        "label": "Database",
        "multi": false,
        "name": "datasource_InfluxDB",
        "options": [],
        "query": "influxdb",
        "queryValue": "",
        "refresh": 1,
        "regex": "",
        "skipUrlSync": false,
        "type": "datasource"
      },
      {
        "current": {
          "selected": true,
          "text": [],
          "value": []
        },
        "datasource": {
          "type": "influxdb",
          "uid": "${datasource_InfluxDB}"
        },
        "definition": "select DISTINCT(\"deviceName\") FROM (select * from \"thermostatMode\" where $timeFilter)",
        "hide": 0,
        "includeAll": false,
        "label": "Thermostat",
        "multi": true,
        "name": "thermostat",
        "options": [],
        "query": "select DISTINCT(\"deviceName\") FROM (select * from \"thermostatMode\" where $timeFilter)",
        "refresh": 1,
        "regex": "",
        "skipUrlSync": false,
        "sort": 0,
        "type": "query"
      },
      {
        "current": {
          "selected": true,
          "text": [],
          "value": []
        },
        "datasource": {
          "type": "influxdb",
          "uid": "${datasource_InfluxDB}"
        },
        "definition": "select DISTINCT(\"deviceName\") FROM (select * from \"temperature\" where $timeFilter)",
        "hide": 0,
        "includeAll": false,
        "label": "HVAC Temp Sensors",
        "multi": true,
        "name": "hvac_temp_Sensors",
        "options": [],
        "query": "select DISTINCT(\"deviceName\") FROM (select * from \"temperature\" where $timeFilter)",
        "refresh": 1,
        "regex": "",
        "skipUrlSync": false,
        "sort": 0,
        "type": "query"
      },
      {
        "current": {
          "selected": true,
          "text": [],
          "value": []
        },
        "datasource": {
          "type": "influxdb",
          "uid": "${datasource_InfluxDB}"
        },
        "definition": "select DISTINCT(\"deviceName\") FROM (select * from \"temperature\" where $timeFilter)",
        "hide": 0,
        "includeAll": false,
        "label": "Outdoor Sensors",
        "multi": true,
        "name": "outdoor_Temp_Sensors",
        "options": [],
        "query": "select DISTINCT(\"deviceName\") FROM (select * from \"temperature\" where $timeFilter)",
        "refresh": 1,
        "regex": "",
        "skipUrlSync": false,
        "sort": 0,
        "type": "query"
      },
      {
        "current": {
          "selected": true,
          "text": [],
          "value": []
        },
        "datasource": {
          "type": "influxdb",
          "uid": "${datasource_InfluxDB}"
        },
        "definition": "select DISTINCT(\"deviceName\") FROM (select * from \"temperature\" where $timeFilter)",
        "hide": 0,
        "includeAll": false,
        "label": "Alternate Indoor Temp Sensors",
        "multi": true,
        "name": "alt_Indoor_Temp",
        "options": [],
        "query": "select DISTINCT(\"deviceName\") FROM (select * from \"temperature\" where $timeFilter)",
        "refresh": 1,
        "regex": "",
        "skipUrlSync": false,
        "sort": 0,
        "type": "query"
      }
    ]
  },
  "time": {
    "from": "now-2d",
    "to": "now"
  },
  "timepicker": {},
  "timezone": "",
  "title": "HVAC Activity",
  "uid": "iliPwTJnz",
  "version": 27,
  "weekStart": ""
}

I had to export it without specifying it is for sharing. I also had to clear all of my selections before hand as i don't know what impact that would have on others.

I think that's the key. If you want a variable to select the data source you have to disable export for sharing. I did not realize how it worked, so it might be easier to get rid of that variable and then use the Export for Sharing option. Just have to make sure to select the correct source when importing it obviously. If you did later need to switch it to a different data source you can always just export/import it again.

So yeah, not sure if having that data source variable in there is the way to go or not.
What I will do is export it both ways and do a file diff to see if there is any other advantage of the Export for Sharing option (like removing any possibly sensitive data?).

1 Like

I am a little torn on what direction to go with this. I like the idea of being able to change the Datasource once it dashboard is installed, just not sure how beneficial it will be. It isn't hard to adjust how the export is done once this is known.

I am curious to know what you find.

So it looks like as suspected, the export for sharing changes all the data source pointers to a generic variable, and then puts some special config stuff at the top of the JSON which I assume is how it knows to ask the user to select a new data source.

It also removes all the saved selections for the other variables.

One possibly useful feature is it adds some header info that identifies what plugins are needed, I assume it will prompt the user to download them if they do not have them already.

So the export for sharing renders the datasource variable useless. The regular export would probably work fine unless you use non-standard plugins. Could make a hybrid between the two and get the best of both by doing a file diff selective merge.

I really thought there would be more interest in this.... tried changing the title maybe that will help?

2 Likes

For me you changed the title too late at night for me to respond in time... :wink:

Charts on it's own is often a niche feature, until people want it....

Perhaps our challenge.... aside from making the setup and config of the chosen charting option easier.... Is to make the charting option something that is easily accessible for the average user, not just those interested in the output of Hub Info or Temp/Humidity/Power Sensors

1 Like

Thats what I am trying to do.

  • The logging app is great now and has active development.
  • There seems to be a cloud based way to setup influx and Grafana for free (have not tried myself)
  • Self hosting is also VERY easy to setup both of these (good docs)
  • I am also considering making a prebuild docker compose yaml file to make it even easier (if there is interest)

I felt like a big bridge to gap would be OK I have all this now what do I do with Grafana to make beautiful charts. Especially someone with no coding experience is now expected to write their own flux queries?

BTW @sburke781 I was searching for how to sort a battery grid by the value the other day and found a post of yours on another site. The solution was to use a table and then override the display to the LCD panel. I did not like that, thought there has to be a legit way to do it.

This is sort of just another hack but I like it better. I recently discovered the map() function and it really helps to clean up the output and get rid of the all extra garbage.


*No my UPS is not really dead, need to fix that.

Here is the data result, it sorts by the measurement (drop down at bottom). Normally this would also be displayed in the device name but I have that overridden to be just the displayName

2 Likes

I have had on my to-do list for a while now to setup a Grafana dashboard. At this point, I am just waiting for my son and I to both have some time so that we can setup what is required on a Pie 4 that he has but no longer uses. He has the knowledge on setting that part up, I have the Hubitat knowledge…

Once this occurs, I will for sure give this a go! I am hoping that it might be mid-this week.

1 Like

And here are your interested parties... :wink:

2 Likes

Nice, let me know how it works out. Still a few things to work out on that hub info DB as far as exporting / importing but the one I posted should work as long as you select the correct data source when importing. It will render the dropdown for the datasource useless but still works (discussed above). Manage dashboards | Grafana documentation

1 Like

Here's my current LED charts for sensors and devices, will need to dig out my notes on how I set is was originally vs how it i now...

1 Like

Oh dang it looks like you can click the headings to re-sort it? Maybe doing the table with the override is the way to go if you can sort it however you want, that would be slick. Although I do see some other visual drawbacks of using the table vs the true grid chart like I used so maybe not... :thinking:

It's been a while since I set this up.... So don't feel any pressure to adopt it,., But happy to dig through my setup for details if you want to use it...

1 Like

No need, I know how you did it, I found the exact post on another site (I think on Grafana forums) where I saw the question from you and the solution! Don't have the link handy but I remember how it was done. I may have to try it out and see which I like better.

1 Like

In terms of my involvement on the Grafana forum (and it's been a while), any stacked charts you can conjure up would be appreciated from a Solar Power perspective, i.e. reproducing the Solar Edge App charts.

The syntax of InfluxD2 many times escapes me and even on the forums I have yet to make much progress, but you really do find gems like you provided here. If you read the definition of map and then look at how you are using it makes much more sense to me.

I had to hack the name using the Hubitat name from the collection using "Display Name" option:

1 Like

This looks great!
Sorry for the noob question, I have not used Grafana/InfluxDB before and don't want to setup another system/server for these .... I can install Granfana/InfluxDB on my Home Assistant, Raspberry Pi setup, and was wondering if I could import these Grafana dashboards to work in the Home Assistant environment to metrics from Hub Info for my C7 and C8 hubs?
Also, any setup instructions on HA for HE hub setup will be helpful. Thanks