Using HE with with InfluxDB, Grafana, with InfluxDB Logger

Seems pretty substantial to me.

States


Poll Values

Scheduled Jobs

If I chang the time frame from last two days, it disabbears from y dashboard completely. If I leave it, it’s pegged at 51.3 hub info device says 19.3.

If you look at live logging do you see any errors for InfluxDB.

There are a few things I would have concern with.

  1. Your interval in the Hubinfo driver.
    a. The reason there are 4 different polls is because some charteristics don't update or need to be looked up frequently. A great example of that is something like cpuPct, or db size is not updated more frequently then every 5 min. So setting it to 1 min just cuases extra load. You only want to poll data at the least fequent interval for what you want. Here are my settings.

This shows you what attributes are collected on which poll frequency.


This shows the fequency of each poll

I only have one item at 1 min as that is the only one that I know of that can poll that frequently. The rest are at best a 5 min interval. Making these changes should ease some load on your hub.

To me this looks like you aren't getting data into InfluxDB for some reason. Can you pull up your live logging and filter on the InfluxDB app name so we can see what it is showing.

You could also temporarily set the InfluxDB install to debug logging. It is somewhat limited in it's default install setting. By setting it to debug you can see the whole flow of what is happening. Though if it is outright failing that should show up anywhay.

Ok. I really was not sure what to set those polling intervals at. I guess I thought there was some sort of default and that is what they were doing. I basically copied your example now.

It took a few minutes, but I finally started getting a chart for this hub. Looks like the only issue (currently) is the platform version is still incorrect (not a big issue though).
I have also again temporarily reduced the backlog limit, as well as turned on debug logging.

Working Dashboards

Thank you (and @dennypage , @danabw ) for all of your assistance and tips in getting this up and running.

Debug Logs

This text will be hidden
![image|690x301]


1 Like

I am glad to hear it is working for you know.

Based on the oldest log it does appear you at some point had a failure writing to InfluxDB that was resolved. That is good we got that working and that is likely the cause of of it not showing up.

I expect this will resolve in less then 24 hours. My settings don't update that but every 24 hours.

1 Like

I think all I did was tell you to take a nap. :wink: Other smarter peeps here were the key.

Glad you're up and running in "Graphy Land." :slight_smile:

1 Like

I've been going in circles for the last 24 hours on this and wondering if anyone has different ideas.

I had the Hub Info dashboard set up perfectly in Grafana yesterday, but woke up this morning to find that the data stopped updating within Grafana in the wee hours. I couldn't get it restarted, so I finally went nuclear and re-setup the whole flow (Logger --> Influx --> Grafana) from scratch, but now after many tries the Grafana dashboard only produces "No data" in every panel. I'm using Cloud for both Influx and Grafana.

From troubleshooting so far, it seems that:

  • Influx Logger is working great -- HE log shows the data is getting to Influx just fine.
  • Within InfluxDB, I can use the Data Explorer to interrogate the data -- AFAICT I see all the values and dimensions that I would expect
  • In Grafana, my Connection to InfluxDB, which is Flux, tests successfully: "Data source is working--buckets found". And, like Influx, I can explore the data from within Grafana and see my handful of hubs with their primary data (dbsize, cpu, etc.)
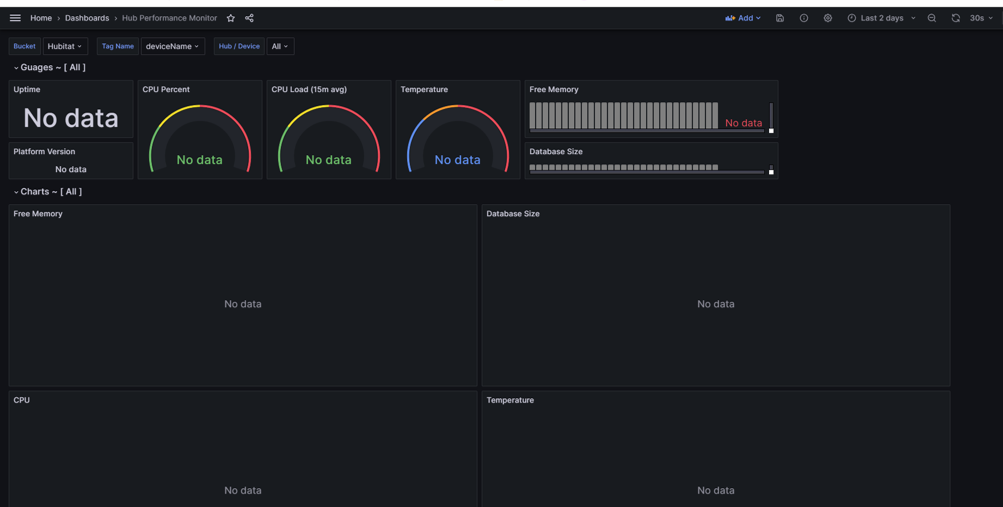
  • But the Grafana panels still show up empty, even though I'm using last 2 days as the lookback period
  • Note also, I have selected the correct Bucket at the top of the dashboard, yet when I click "Device Name", my individual hubs don't show up like they did before.

I created the Grafana dashboards the same way each time--by importing the standard dashboard from here. The structure of the panel looks fine--there's just no data.

I feel like I'm missing/forgetting something simple, but I've reviewed the steps like ten times (no joke), and I'm going blind.

Any ideas? TIA....

Is the clock possibly off on something, and the data is getting logged with an incorrect time stamp? Or if the Grafana host is way off on time "last 2 days" from its clock might be empty.

Make sure you are sending the 'cpuPct' attribute, that is what it looks for in the hub/device name query list to check that it is a hub info device.

Creative theory! But no -- just doublechecked.

I missed this comment the first time. Do you mean, send that attribute from the HE logger?

Yes, it is required for the dashboard to work. Must be selected in the logger app to send to the database.

Ah that's it. Thank you!

:point_up_2:

3 Likes

Doh.

I had previously installed and used Mavvrick58's Pi image and had this all up and runnning. I then had a HDD failure and wanted to start again.

This time I followed these instructions, installled InfluxDB 2.x and got some of the suggested boards. Now I wanted to create my own and somehow managed to do that when I was on InfluxDB 1.x, but now I see there is a more advanced (difficult) query language.. and.. it is being put into maintenance mode.

Is there a way to change my InfluxDB to us InfluxQL instead of Flex? If not, is there a way to uninstall InfluxDB 2.x so I can install InfluxDB 1.x?

That is what the section about "Data Source v1" is about in the section for setting up grafana.

Awesome!

After wiping the egg off my face I am in business and can now query in the "old ways" :slight_smile:

Thanks a lot for the quick assistance. As I had installed V2, I simply skipped most of V1, except the connection part.

I am getting a lot of "events failed" messages, see below.
Help please; not sure how to resolve this or what has changed recently?

Generally speaking a error code 500 represents "internal server error" responce which is a server side problem. Do you use the cloud option for InfluxDB or a locally hosted solution.

1 Like

Using the locally hosted solution.
InfluxDB v2.7.0

Have you tried restarting/rebooting InfluxDB