For the benefit of those learning how to make custom Grafana dashboards, what are some best practices that you've found in doing so? Or, if you're learning, what are specific problems you're having getting started?
There are some ready-to-use Grafana dashboards, which is great. However, for use cases not (yet) covered by those pre-built dashboards, or for those wanting to learn, perhaps this thread can be a help for learning best practices or solving basic "noob" Grafana problems.
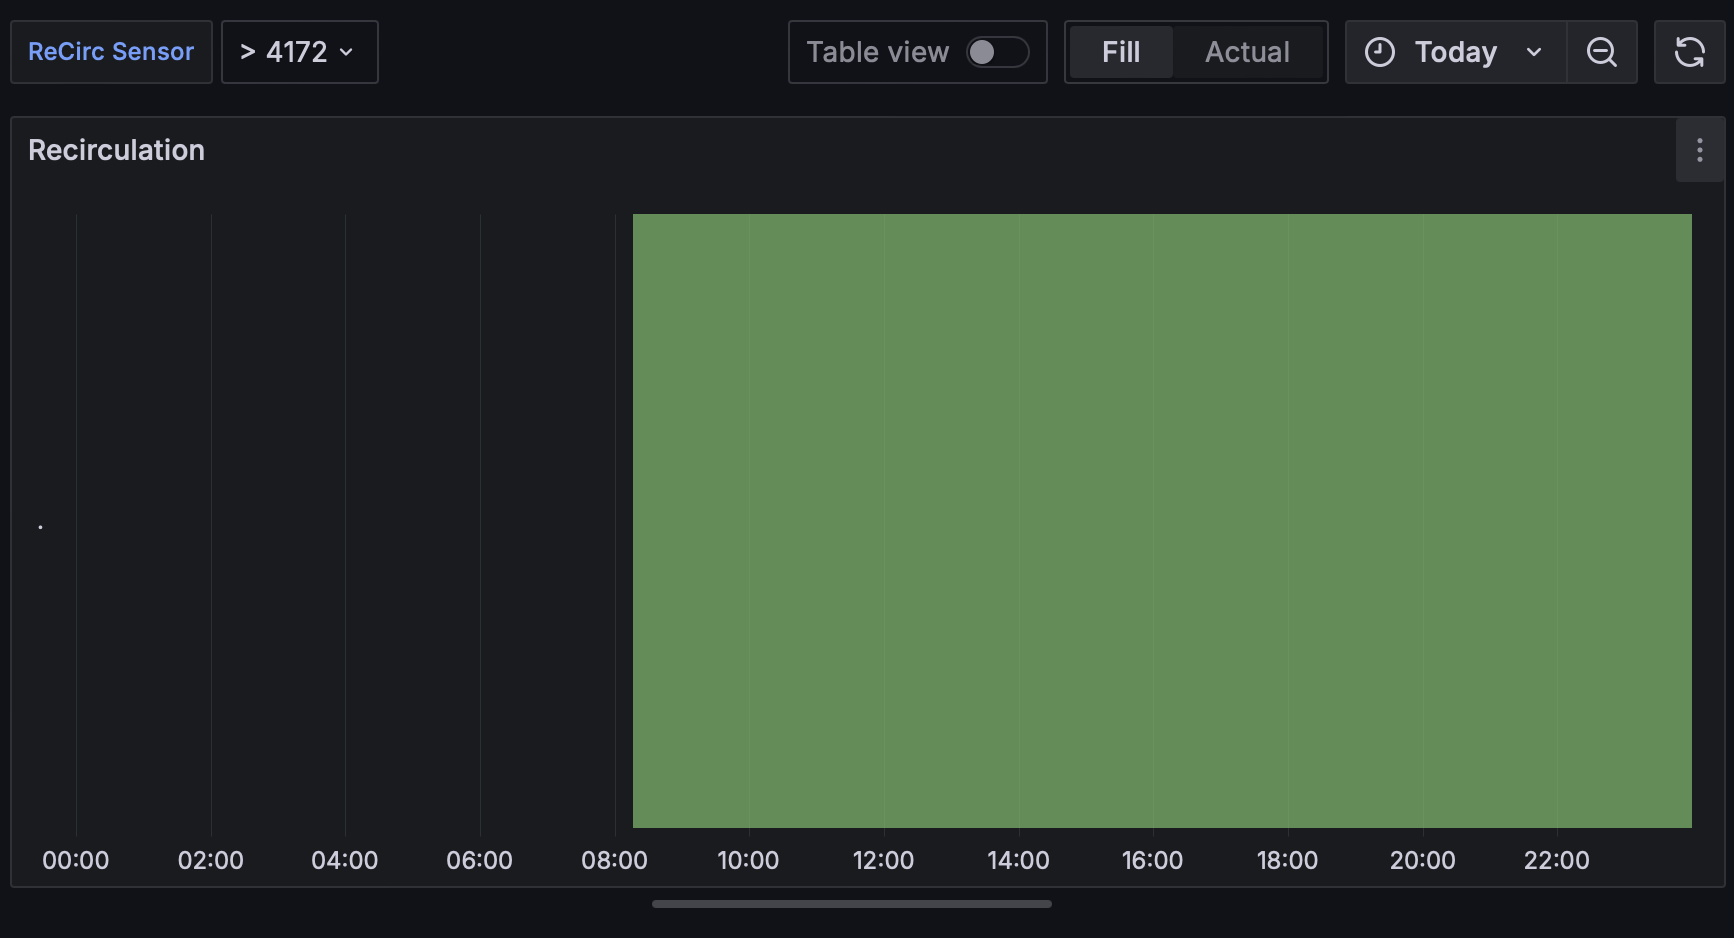
When the time for the timeline is selected as "Today" , though, the last state is extrapolated all the way to the end of today, rather than stopping at the current time as expected:
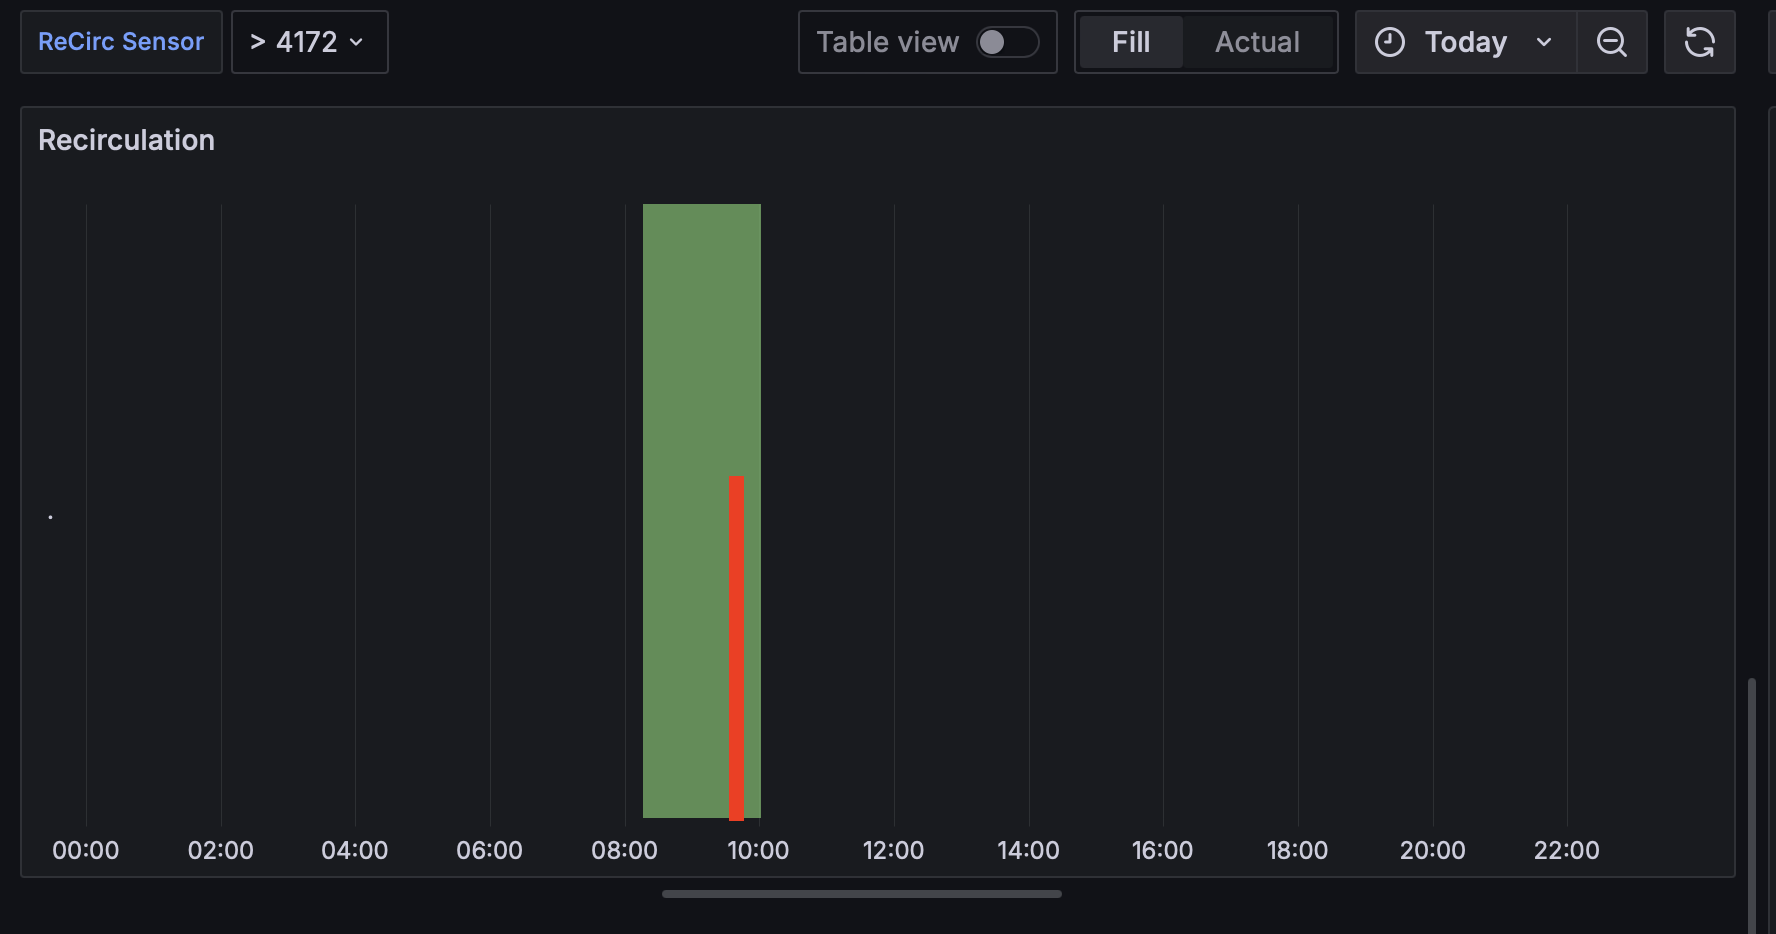
If I choose "Disconnect values" with "Threshold > 1h" that somewhat works, but it seems it extends the last state beyond the current time. (shown in red below):
Yes, that is a great resource (edited the first post to mention that). I'm nonetheless desiring to learn myself how to build dashboards, to handle use cases that aren't covered by those yet. And to maybe be able to contribute towards that at some point.
Easy solution woud be to not have the chart show you times in the future by selecting Last 2 Days as your time range. You can modify it to be last 1 day also if desired.
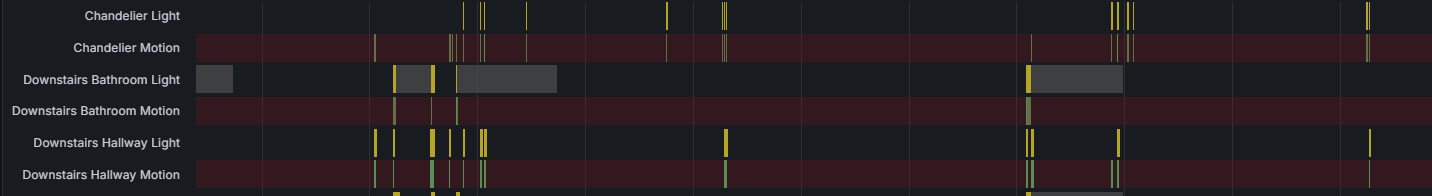
Are you trying to make something like this?
(The two at the bottom are meant to shows hours activated over the range, and numbr of activation but I could never get them to look right for some reason)
This chart was great for troubleshooting automations instead of digging in event logs you can see it visually here.
I also made one for someone else that stacks the motion sensor activation and lights on/off in the same chart so you can see if the lights are properly activation when the motion triggers.
Yeah, I see those other chart options, but prefer the Today view for some things. It just keeps the view more consistent rather than changing so much over the course of the day. Rather than having to hunt the x-axis for the time, it's just always know that the middle is noon, etc. So would still be great if there's a solution that would make the Today view work....
I do like all those charts, though - going to be great once i get this going. I like offloading the hub too.
So what it is doing is just taking the last value and it assumes it stays in that state until there is a new value, so when the last value is ON, it just extends that to the end of the chart. The Threshold you set makes it forget about that last value after 1hr so that would break the entire thing unless you have soft-polling for < 1hr enabled.
I think you would have to make some sort of complicated query that saves the output to a variable, and then joins an "off" value for every device at the current time. That would force them all to the off state at the current time.
Another option would be to do soft polling at a faster rate, say 10 minutes, and then set the disconnect values threshold to > 10m, that would shrink your window from 1hr to 10 mins. This would create a lot of (fake IMO) data points in the database though, and extra work for the hub. I am not a fan of the soft polling except in special cases.
Another thing to keep in mind is that Influx v3 is they discontinuing support for Flux queries and going back to a more SQL like query, but not exactly the same as Influx v1. It seems they cannot make up their minds and it is frustrating.
Uh, sheesh, I'm glad you told me about this! About spent all this time learning Flux and building Flux-based panels only to have them discontinued! So, what should I be doing now to get started?
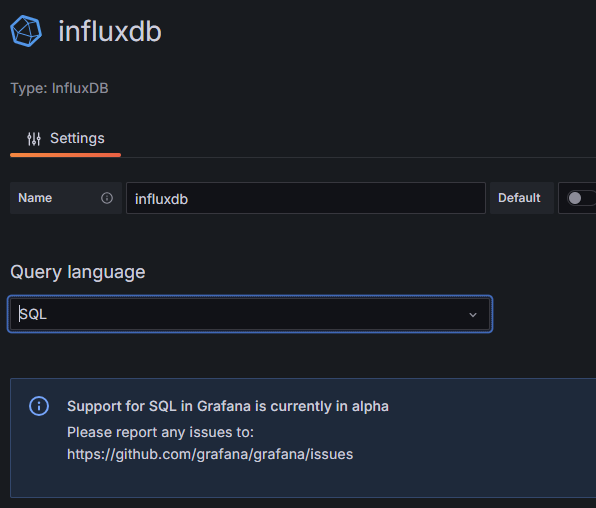
Using alpha support in Grafana to build SQL-based panels? (do i need to install anything special or is alpha support already baked into my install?)
I have no idea, I have not started messing with it. Probably wont until they fully start phasing it out. I dont even know if Influx v3 is out yet for my system, I am still running v2
Oh, hmm. So would Influx v3 be needed to start writing Grafana dashboards with SQL data source? Seems silly to spend any time on Flux dashboards at this point....
It's as close to future proof as you can currently get. Flux, while perhaps a good idea, gained almost no traction in the real world. In InfluxDB 3, Flux is being dropped in favor of additional enhancements to InfluxQL.
And there is more to it than that, Influx V2 does not directly support the original InfluxQL queries, you need to setup a DBRP mapping which basically allows you to talk to Influx v2 as if it was v1.
So, am I reading that InfluxDB blog post right? That, InfluxQL will still be supported in Influx 3, in addition to native SQL? As in, Influx 3 will support both InfluxQL and SQL, so spending time on InfluxQL panels will be worthwhile?
Although, I am leaning towards just going directly to SQL queries if that's possible... will be looking into that...
I have not been keeping up with it but that's what it sounds like. It will support v1 InfluxQL in a similar style as how V2 supports it, with a DBRP mapping and legacy API support. Underneath that it will convert everything to traditional SQL as the primary query language.
InfluxQL is the query language for InfluxDB. To my knowledge, there is no "native SQL" API outside of the cloud implementation, and that is not meant to be part of the general use server. For general use, there is only InfluxQL, or the now deceased Flux. And even if native SQL were going to be part of the general use product, you could not simply use SQL in Grafana and be done with it. You would loose the time series capabilities that Grafana depends upon.
Really, don't stress about this. InfluxQL is very much like SQL. It's incomplete in some areas (like join), and has non standard extensions in other areas (like time series operations). If you know SQL, InfluxQL should be easy to work with.
“Because InfluxDB 3.0 now returns tables rather than table streams, the V3 plugin defaults to the Grafana table format. Let’s build a query and transform it into the time series format for visualization as a line graph.”
Either way, though, I'm guessing the InfluxDB Logger HE app would need to be updated to support Influx v3 anyway...seems like I picked a bad time to finally try to get this up and running.
No, not really. Read through the InfluxQL link I sent. The focus seems clear to me, and I just don't see pure SQL coming anywhere near overtaking InfluxQL for InfluxDB. There has been far too much momentum behind InfluxQL, and Influx knows this (this is why Flux died). Same with Prometheus and PromQL. While Grafana does have interest in pure SQL, this is for their own market reasons. Smiles and handshakes aside, I really don't see Grafana investing in anything for the sake of Influx... they are competitors after all.
In general, all time series DBs have suffered because they "aren't SQL," and standard SQL reporting tools don't work as expected. So now, everybody wants to be able to say "we're SQL" for market acceptance reasons. But that doesn't mean that pure SQL actually ends up as a good choice for processing time series data. I think this will continue to be InfluxQL and PromQL.
The need for the logger to be updated is unclear at this point. Keep in mind that insertion and query are disjunct activities in InfluxDB. My guess is that the current implementation will continue to work with either of the current permission models.
Also, bear in mind that InfluxDB 3 is not available for general use. As it sits, it's commercial only. No general distribution, GitHub tags, docker images, etc. Until such time as I see movement with 3.X for non commercial general use, I don't plan to worry about it for use with home automation.
FWIW, I think you picked a great time in that you won't waste effort on Flux.
If you are really worried about obsolescence, I would recommend using InfluxDB 1.8. 1.X is well established, and will likely be around for a very long time even if Influxdata dies. Only time will tell if InfluxDB 2 or 3 will survive.