Just a warning: This is a LONG read.
I'm a NodeRed junkie for home automation tasks. I find it easy to do everything from network monitoring to rotating log files and firing off complex automations in Hubitat that I don't find Rule Manager suitable for.
With that said, the topic here is getting your logs and events from your Hubitat hub and finally into Grafana. I chose Hubitat because I want everything running in my house locally (with some exceptions like Alexa/Google Home, etc). Part of that means my logs and events aren't going to get shipped out to a third party. That's what this project solves. Having an enterprise IT background, I want logs going back as far as I can and right now, Hubitat doesn't provide that (nor do I ever expect them to because I want my hub to be a hub and nothing else). I also wanted a solution that didn't require any custom code or drivers within the Hubitat hub itself. So, I came up with this solution.
Hardware: What do you need?
You'll need an always-on "server" (or servers depending on what you have at hand) for running NodeRed, MySQL and Grafana. My platform of choice is Linux, but you could accomplish the same thing on Windows or Mac. For hardware, you could run this using something as simple as a Raspberry Pi, but be warned that this will probably tax that poor little machine to death, especially if you have a busy house with a lot of devices. If you have 2 or 3 of them lying around, that'd be a lot better (my current setup is running on a machine with 32GB of RAM and 16TB of drive space). However, I've also done this exact same setup on 2 RPis with a 1TB external drive attached to each. YMMV depending on what hardware you have available to you.Software: What do you need?
Personally, I prefer Debian based Linux systems, but I know that each of the platforms needed here run on pretty much anything.- NodeRed (https://nodered.org/) is the brains behind all of this and required to get logs and events out of Hubitat. This needs to be on an always on server.
- MySQL: This is pretty much a "pick your flavor" decision. I personally prefer Percona or MariaDB, but any "sql" type of server will work. For this tutorial, I'll be using MariaDB 10.1. This also needs to be on an always-on server.
- Grafana (https://grafana.com/): This doesn't need to be on an always-on server, but I'd highly recommend it.
How do I set it all up?
I'm going to bypass setting up the various server pieces as each of the 3 required components each have excellent documentation for themselves. I'm going to start off assuming you've setup NodeRed, MySQL, and Grafana already and get right into the configurations.MySQL Configuration
I've created 6 tables in MySQL to handle the logging. I *could* have gone with just 2 tables, but I wanted to separate out battery, temperature, switch and motion events into their own tables for ease of indexing and querying, especially when my hub gets really chatty. With that said, if you feel comfortable with your own table structure, feel free to implement it. :slight_smile: One thing to note about the user. If you are running NodeRed and MySQL on separate servers, you'll need to change the @'localhost' to match your environment and **CHANGE PASSWORD TO SOMETHING SECURE!**I've created a SQL script for setting up the database, tables and indexes:
https://raw.githubusercontent.com/code-in-progress/Hubitat/master/Node-Red/flows/database_setup.sql
This is how your database layout will look after running the SQL file:
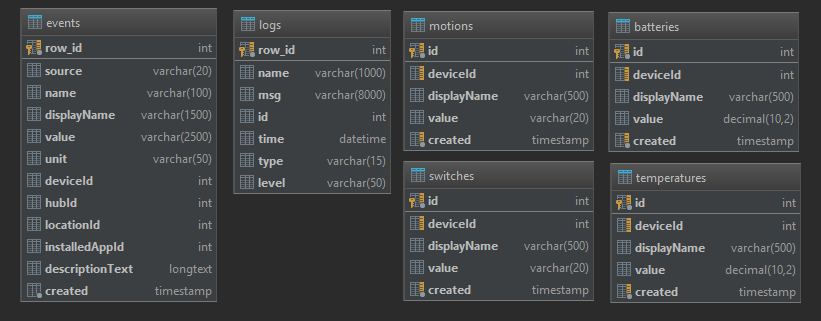
With the tables created, let's move on to NodeRed.
Node-Red configuration
You'll need to add 2 NPM packages to your pallet in NodeRed (3-slash menu > Manage Pallet > Install).- node-red-contrib-advance-logger (node-red-contrib-advance-logger - npm)
- node-red-node-mysql (node-red-node-mysql - npm) [If you choose to use another database platform (postgres, oracle, mssql, no-sql db, etc), you'll need to find and add a npm package for it].
Once you add those two packages, everything else is pretty easy to assemble. My flow below looks complicated. It actually isn't and I'll go over each part.
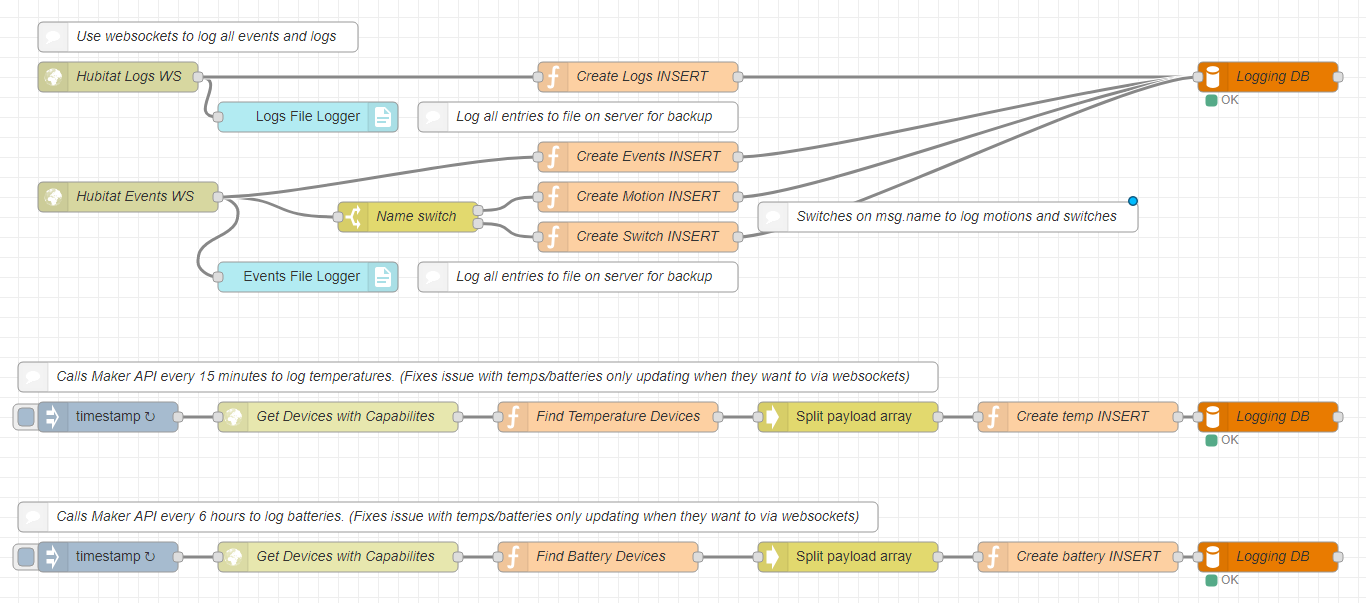
This part deals with logging everything from Hubitat's two exposed websockets, eventsocket and logsocket. What I've done is created two websocket listeners and pointed them to ws://[hubitat_ip]/eventsocket and ws://[hubitat_ip]/logsocket. These catch everything that you see in the /logs page on your hub.

Logs File Logger and Events File Logger each writes the raw log/event data to files. The logger node is part of the advance-logger npm package. I have it configured to write a log file on my server that gets split at 500mb and also gets rotated as needed.

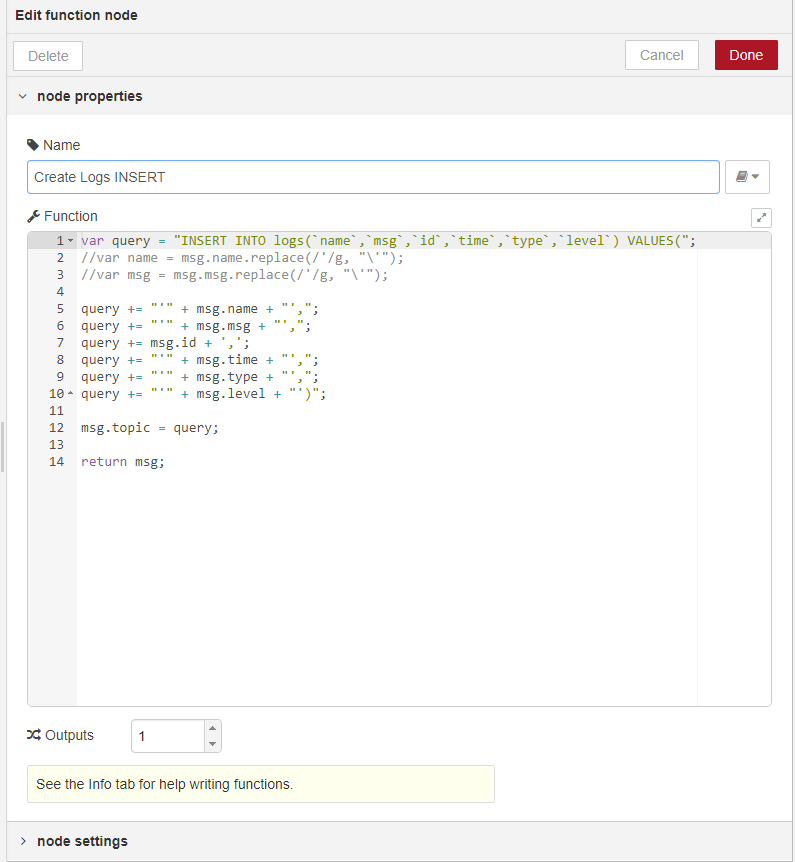
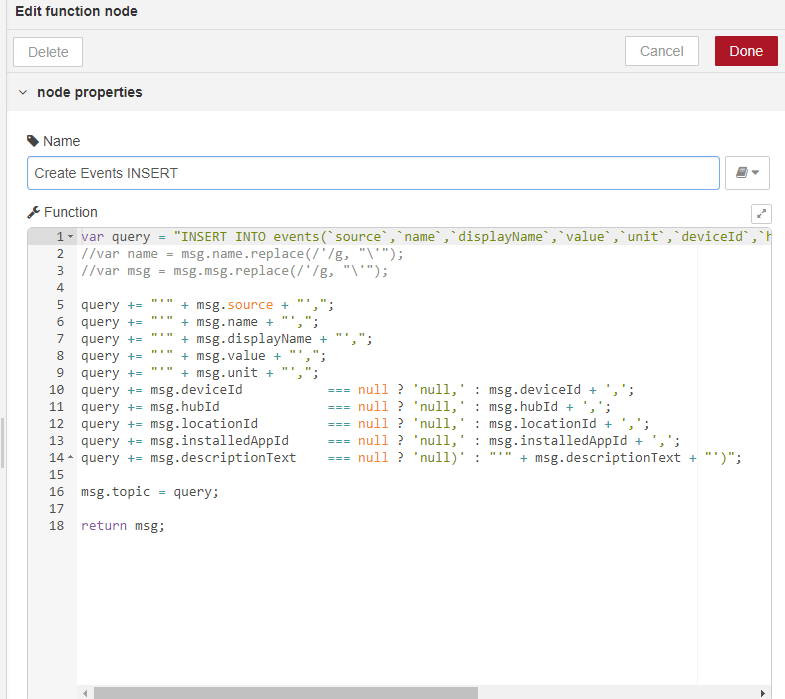
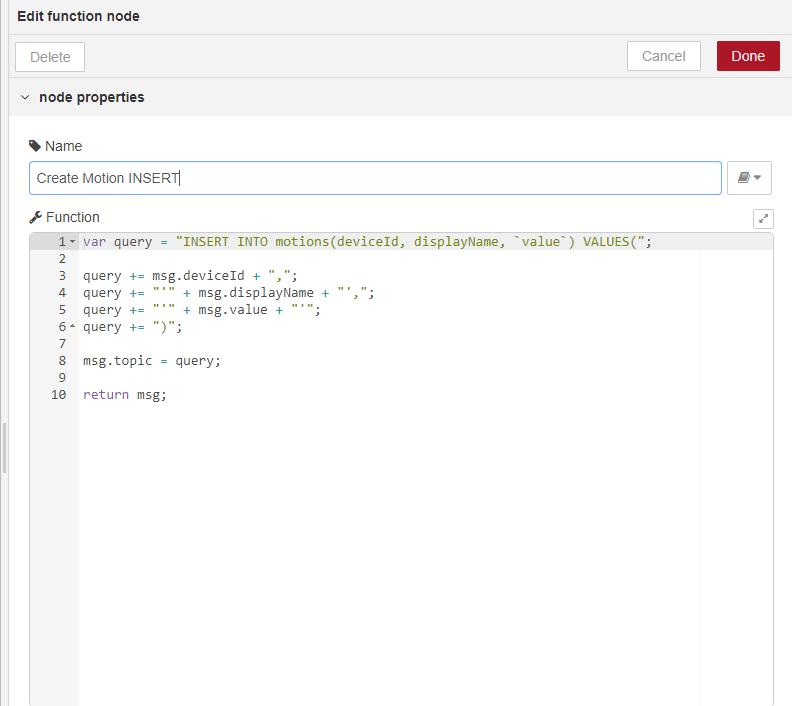
For the "CREATE * INSERT" nodes, these are function nodes each one just creates an INSERT statement for the Logging DB node.
Create Logs Insert:
Create Events Insert:
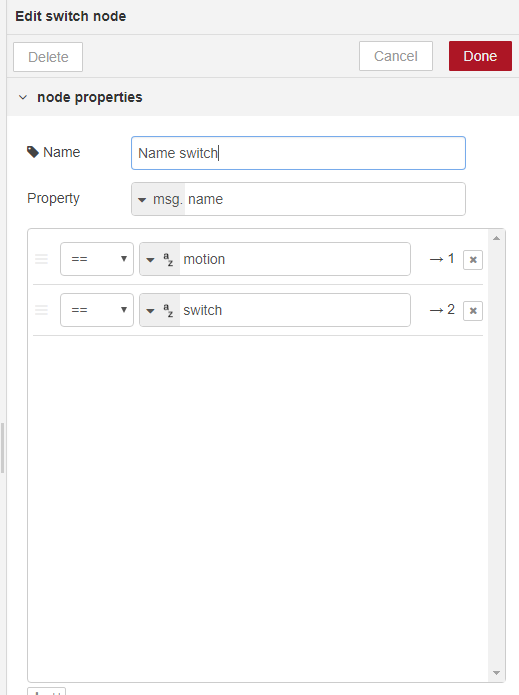
For Create Motions and Create Switches, I use a switch node to switch on msg.name:
Create Motions Insert:
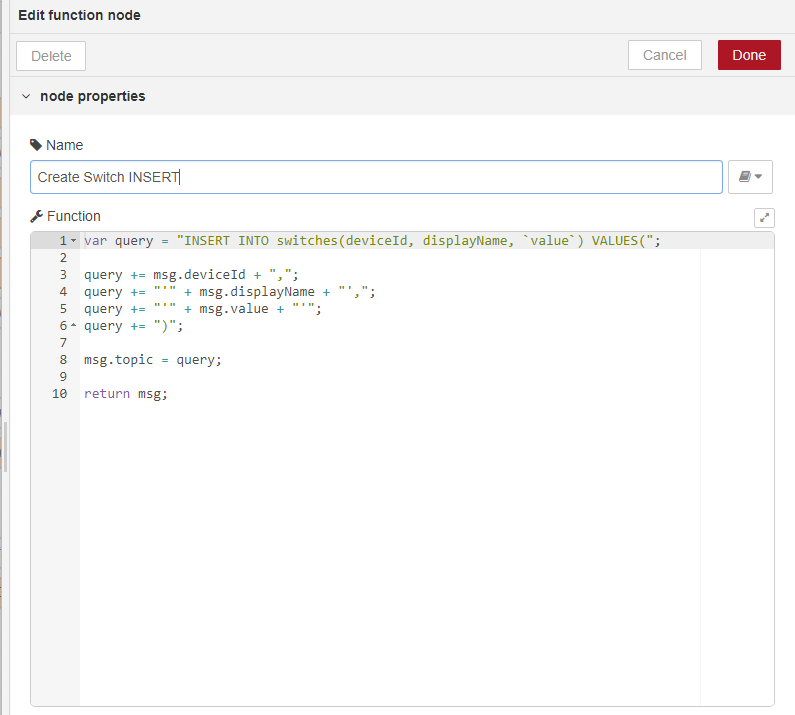
Create Switches Insert:
Finally, configure your Logging DB node and hit deploy. Within a few seconds, you should start seeing data flowing into your MySQL tables.
For the temperature and battery values, I found that using websockets didn't work out well because there's no rhyme or reason on some battery devices as to when they report in. So, the Maker API comes to our rescue (you DO have the Maker API setup, right?!). To access the Maker API from NodeRed, we use a http request node. Use a GET request and point it to http://[hubitat_ip]/apps/api/[app_id]/devices/all?access_token=[access_token].

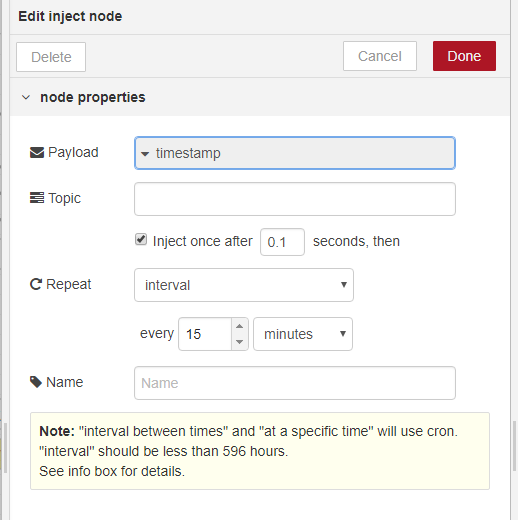
The first node in this section is the Inject node. The Inject node is probably one of the most versitile nodes in all of NodeRed. For temperatures and batteries, I have it configured as follows:
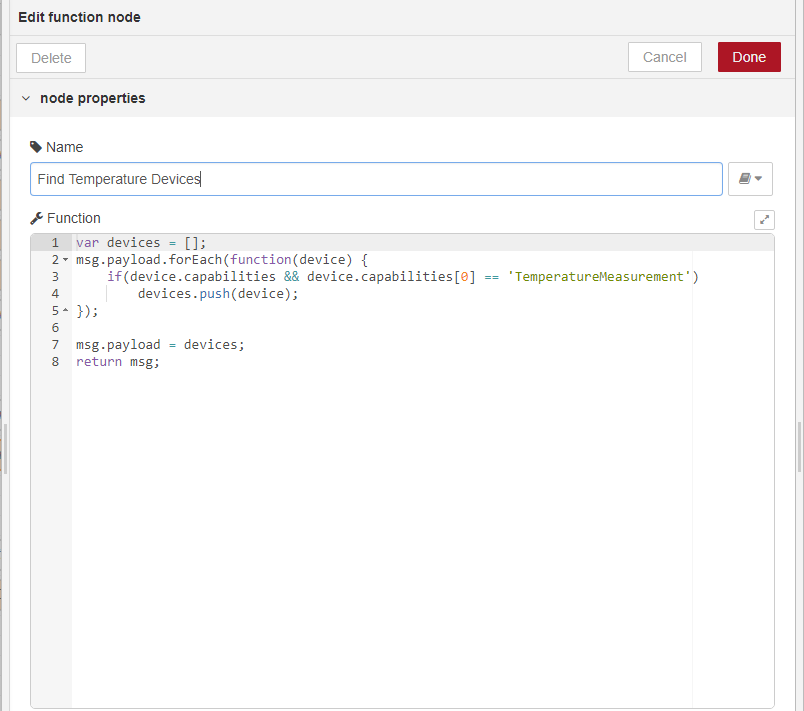
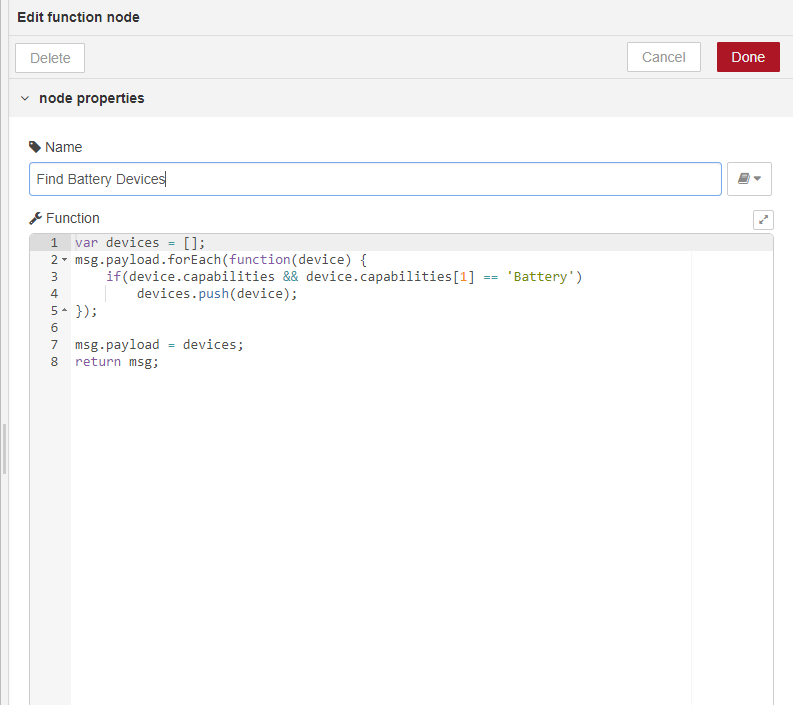
This section functions a bit differently from websockets as we have to parse out the device list from the Maker API. On a large amount of devices, it could take a minute or two for the full device list to be returned from the hub. However, once you have your device list, we pass it through a function node looking for temperature or battery capabilites:
Then, we pass that through a simple split node, splitting on msg.payload. Finally, pass that through to a CREATE INSERT function (as shown above), and then to the database. Deploy again and you should see data in your MySQL tables.
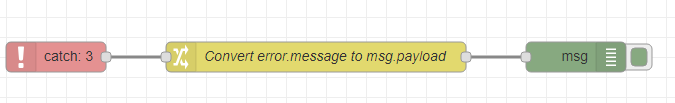
The last part of the flow is error handling. Currently, I just pass the error to the debugger, but there are lots of things you could do here like alerts, emails, tweets, etc. The sky is the limit really.
That's it for the NodeRed configuration. At the end of the post is the exported flow for you to import, should you choose to.
Grafana Configuration
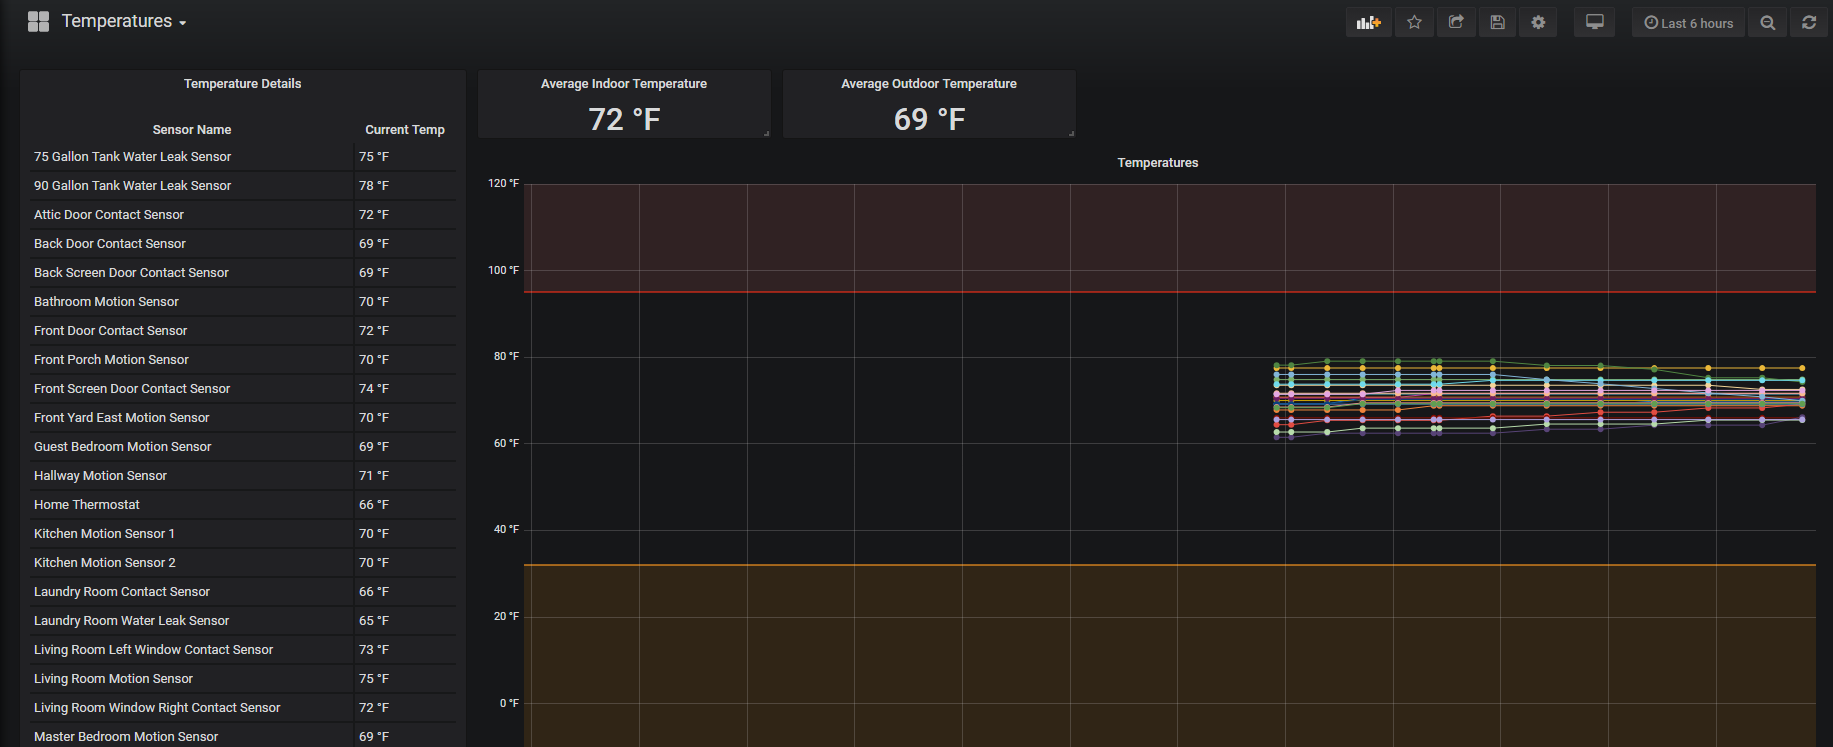
Lastly, we come to Grafana. Setting up Grafana is extremely simple, but to use this solution, you'll need to add the MySQL DB Data source plugin. After that, it's simply a matter of creating your dashboards as you see fit.This is my temperatures dashboard that reads from the temperatures table. The setup here is extremely simple as it's a combination of a table, a graph and two singlestats. Basically, read values from MySQL and display in graphs. 
If you've made it this far, thank you. It looks complicated, but once you have it up and running, it pretty much removes the need for ANY external resources. I've tested this on a completely isolated network with no internet access and it works flawlessly.
To import this flow, import the JSON contained here:
https://raw.githubusercontent.com/code-in-progress/Hubitat/master/Node-Red/flows/he-logging.json


 .
. ..will have to check that. I already have Infludb with Grafan configured but had to disable it because I'm trying to tshoot biweekly hub crashes and I think that is the culprit.