I did click on that green square. Trying it again to see.
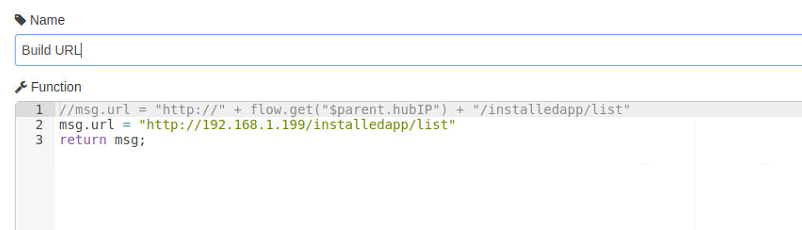
Interesting. Did you have to drill down into a subflow to get to the "Build URL" node, or did the export somehow flatten it all into the main flow?
Might be interesting to replace flow.get("$parent.hubIP") with flow.get("hubIP") and see what happens.
I did have to drill into the subflow. flow.get("hubIP") still show the error.
Thanks for this. I'm new to node-red, and linux in general.
Any chance you could show me what format to create the table for the database? I've got it all set up, but for that. Appreciate your work here. It's awesome!
The MySQL database is the one that's created in the post linked at the bottom of the OP:
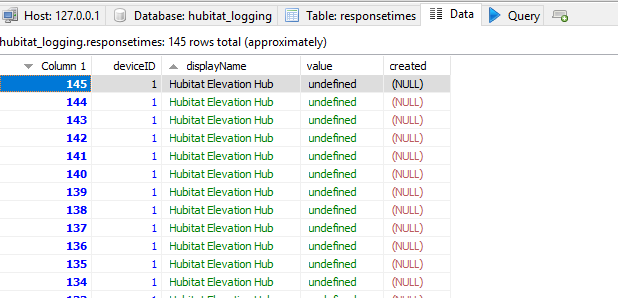
Thanks, yes I had already added the table responsetimes to the DB hubitat_logging, I was meaning the format of the table. At present, I'm getting this:
Here's the table definition:
CREATE TABLE `responsetimes` (
  `id` int(11) NOT NULL AUTO_INCREMENT,
  `deviceId` int(11) DEFAULT NULL,
  `displayName` varchar(500) DEFAULT NULL,
  `value` decimal(10,2) DEFAULT NULL,
  `created` timestamp NOT NULL DEFAULT CURRENT_TIMESTAMP,
  PRIMARY KEY (`id`),
  KEY `responsetimes_deviceId_index` (`deviceId`),
  KEY `responsetimes_created_index` (`created`)
) ENGINE=InnoDB AUTO_INCREMENT=6039 DEFAULT CHARSET=utf8mb4;
1 Like
Anyone else finding their hub rebooting a lot during the maintenance period? I have my CriticalsForReboot set to 6 and Criticalthreshold to 15. I could raise the threshold, but I do not want to go too high because then when its out of the maintenance window it may be an issue.
I am seeing response times on average from 20-30 seconds during 2-3am, so curious on what others have experienced.
Maybe an option can be added to allow a longer threshold only during maintenance.
20-30 seconds...wow.
What are your response times normally?
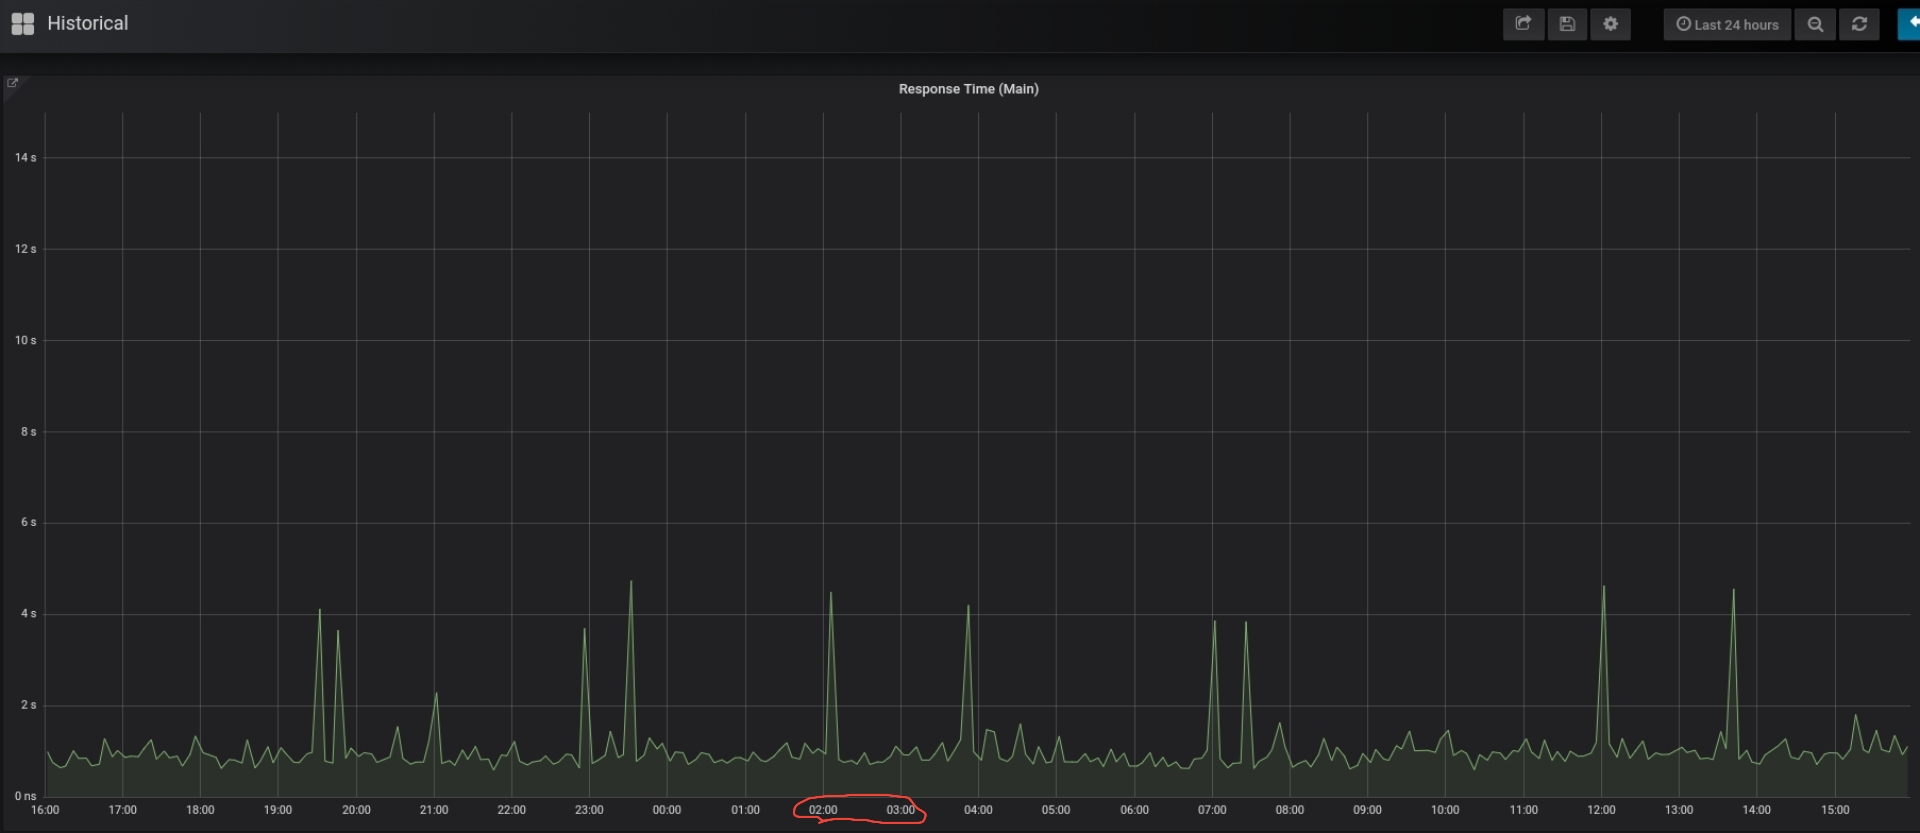
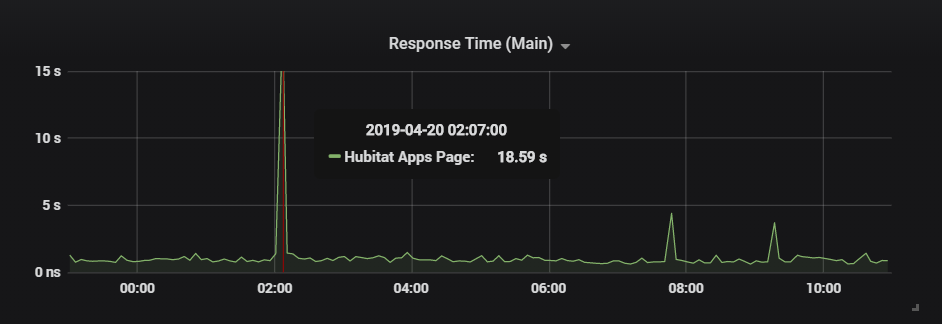
When My main hub spikes above 5 seconds I get worried. The worst I've seen is 10seconds and that was because Ihad other nodes running Maker Api calls and backing up logs at the same time. Are you running anything else on a repeat interval through Node Red? I spaced my node interval timings out to reduce the chances of them happening at the same time. Here's my response time graph for the past 24hours.
I am not sure why then, I am not evening using the maker API. I just have two eventsockets, one is for device monitoring and the other is to refresh the InfluxDB for devices to report properly. The average time you can see is around 2 second, although this has gone up recently, used to be below 2.
I do have a Node-Red flow that backs up the config, but this runs at 4:30 which is outside the maintenance window.
I also stripped down as many third party apps/drivers as I could from the hub, whats left I can't really replicate with stock apps/drivers.
Below is all the custom Apps/drivers I run currently, not sure if any of these could cause issues.
Custom apps: Alarmdecoder, MyQ Lite, Presence Central and WATO
Custom drivers: Alarmdecoder, ApiXU, Logitech Harmony Hub, My Aeon Home Energy Monitor v3, My Q Garage Door, Virtual Presence Plus, Switch Timer
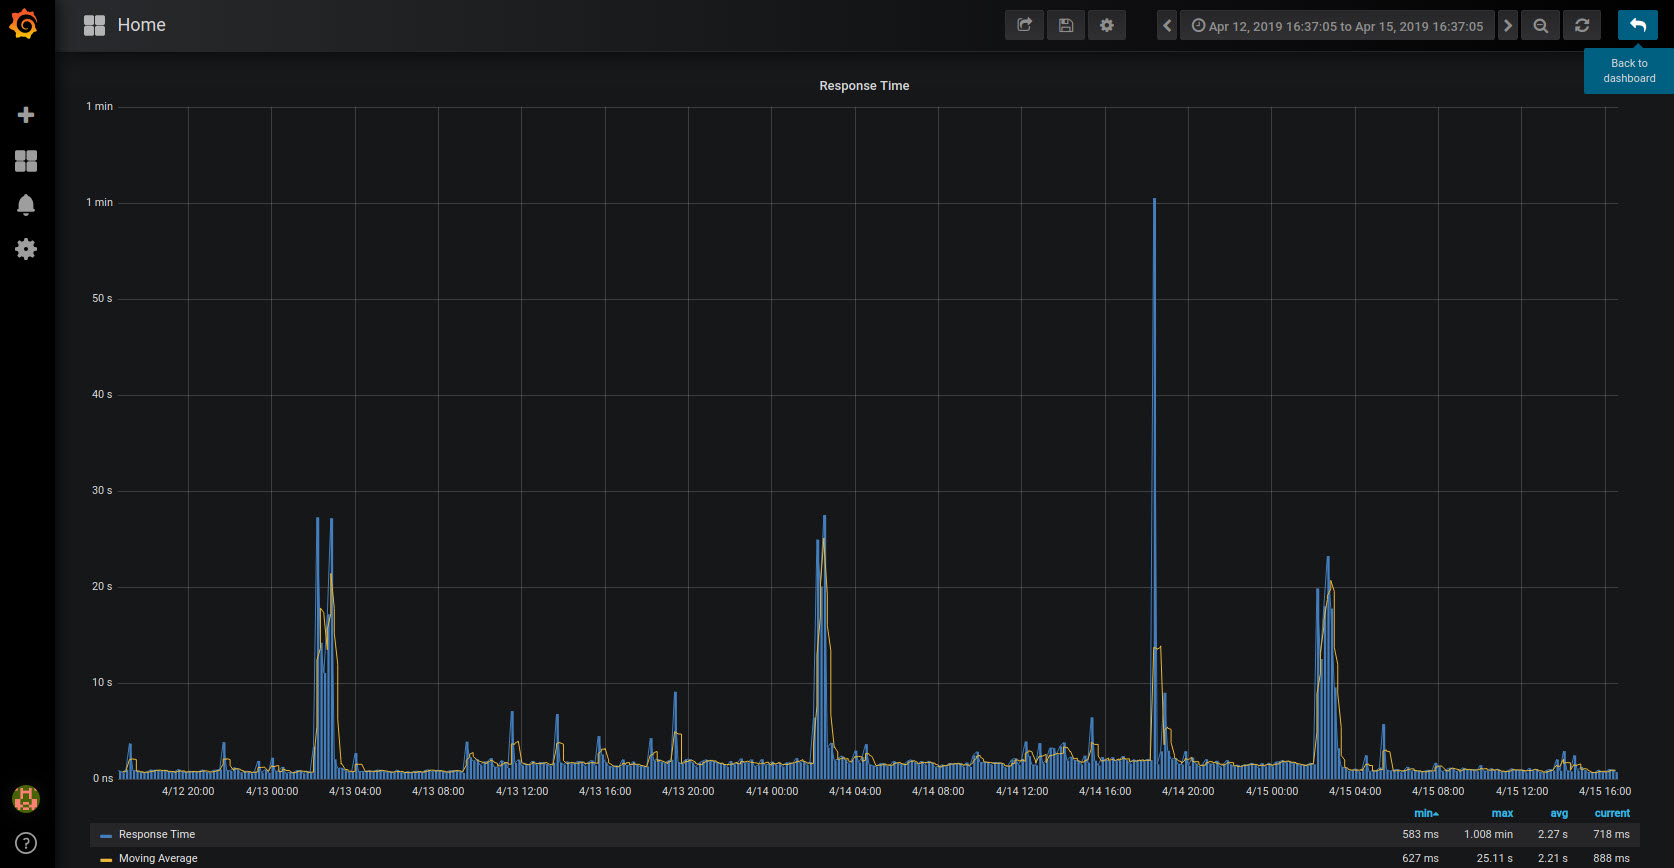
Not sure what that 1 minute was, but I normally do not see that.

Here is 3 days you can see its consistent during the maintenance window.
This is probably not your issue, but why do you need two event sockets? Can't just have 2 separate outputs or setup socket relay in nodered?
What is the size of you backups? Mine are usually around 15MB.
Websocket relay wasn't working because it was adding a leading "/" in the path field for the "Listen On" websocket node. So if I used ws://127.0.1:1880 Node-Red would change it to /ws://127.0.0.1:1880 which won't work.
Mine are also about 15MB.
Thanks for this. I found an error in a node, which was causing an error with my table, which was formatted exactly the same as yours.
In the "insert" node after "Check Page",
var query = "INSERT INTO responsetimes(deviceId, displayName,
value) VALUES(";
query += "1,";
query += "'Hubitat Elevation Hub',";
query += "'" + msg.responseTime + "'";
query += ")";msg.topic = query;
return msg;
I think it was totaltime, in the downloaded version, and causing errors in my DB.
2 Likes
I've noticed that my hub slows down every 15 minutes. So I did some digging, and discovered that the maker api call for temperature (other Node-Red thread) was running a few seconds just before this was run/called.
I'll move them away from one another. The maker api call takes about 15 seconds to report in all my temp devices - 21 devices in total.
1 Like
Wow, it makes a big difference to schedule this at a different time to the temp/batteries maker-api call. FYI, a huge difference.
2 Likes
@btk, this perfmon has been working great for me. The only strange thing I'm seeing is that "Critical" messages are not being logged unless they are above a threshold. I may have bad assumptions so I figured I'd reach out to understand your flow logic.
My assumption:
- Critical alerts should be logged and sent to pushover...just within the rate limiter(depending on time etc)
What's happening:
- Critical messages are only logged or sent to pushover if it is greater than the criticalsForReboot.
Therefore, if my hub gets 1 critical value, it never logs and I never receive a notification. Is this by design? Please see the section of code that is creating this "issue".
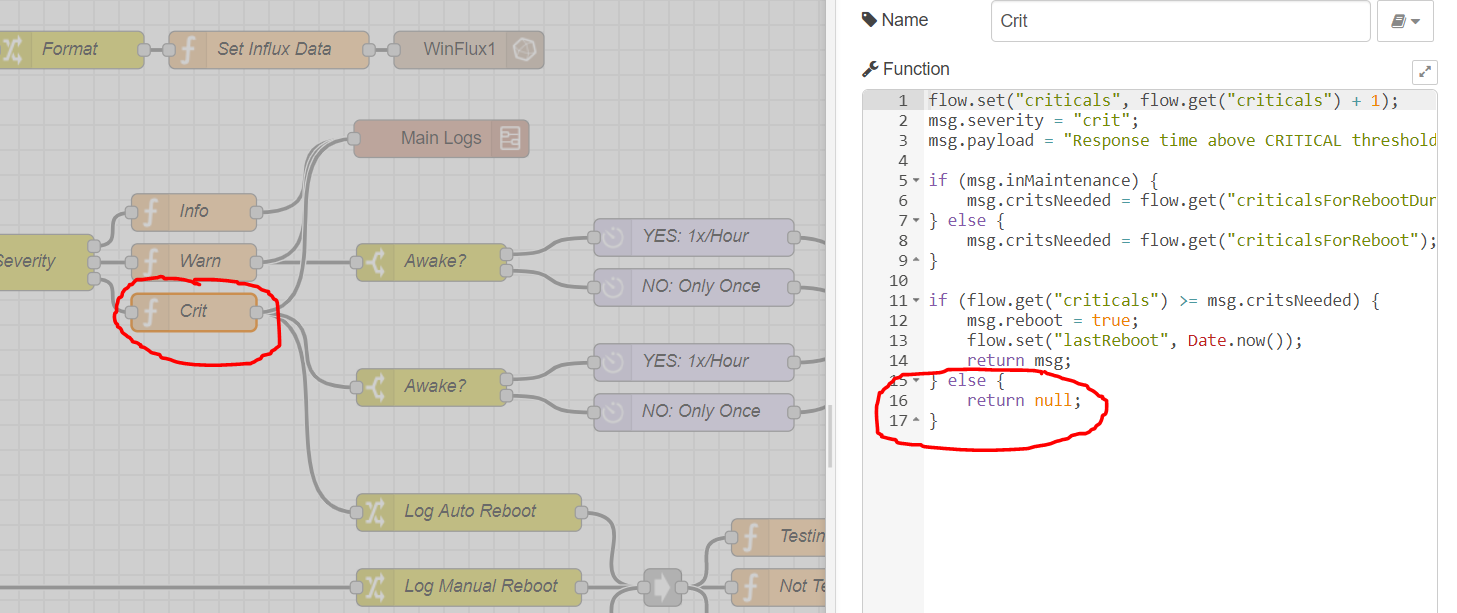
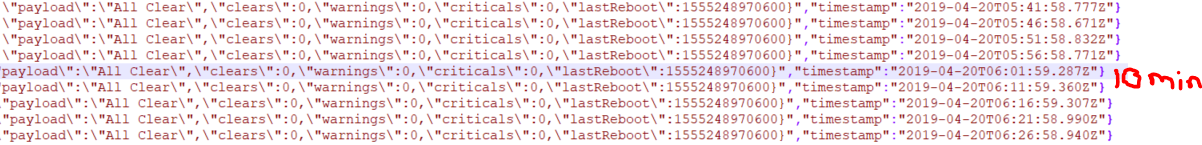
This doesn't affect my influxdb/grafana data because that occurs earlier in the flow. That's actually how I realized this problem. My grafana showed a spike during maintenance that I could not find anywhere in my log file. See the skipped log below (check should occur every 5 mins)
So I un-paired my Aeotec Gen v1 HEM and my response time went from an average of around 2 seconds down 1. I couldn't believe the HEM could cause such a load on the hub for energy reporting.
Also my response time during maintenance has dropped down to an average of 15 seconds, which is significantly better.
I still want to use the HEM so I may need to dig into the driver I was using. I have tried the stock driver but the energy level never updates, so I had to use a custom one.
I had a hub lockup yesterday, but my web socket and log socket both continued to run fine.
Not sure what happened.
All my http stuff was failing, suck as yeelight, and my alarm system, unable to navigate to hub, but the node red was chugging along fine. Ideas?
As I understand it, the websockets run on their own threads outside of the Hub UI. I could be 100% wrong about that, but it's what I have noticed. I think they function the same way as the hub utilities to reboot and shutdown.
Were they still pushing out data or were they just "up"?

