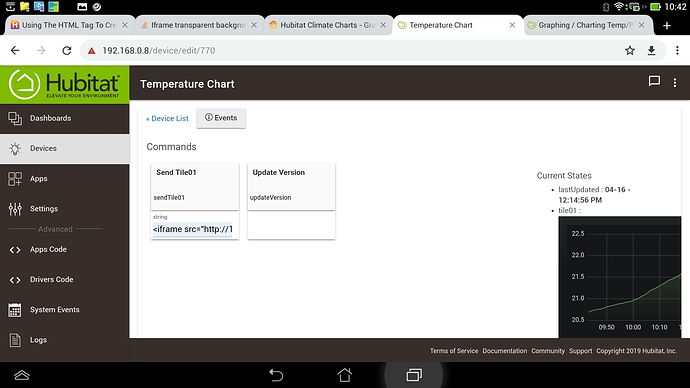
Hi @potts.mike,
I noticed your post from back in Jan trying to get Grafana charts on your dashboard. I was able to achieve this recently and thought I'd share my solution. I posted briefly about it here, showing the outcome, but didn't include any of the details. There would be a neater solution than this, but..
- I setup a new virtual device using the Tile Master tile driver. The normal use of this driver is for devices created using the App of the same name, but I simply created a new virtual device manually through the HE Web UI.
- In the Grafana web front-end I opened my dashboard, clicked the drop-down menu above any panel on the dashboard and selected "Share Panel", grabbing the embed code from the pop-up that appears. I then swapped the panel's URL in the embed code with the URL for the entire dashboard.
Before we can use this embed code in HE, some configuration changes need to be made to Grafana, in my case on my raspberry pi.
2.1) Update the Grafana config file to enable embedding, achieved by (in my case) updating the /etc/grafana/grafana.ini file, uncommenting and adjusting the settings shown below. Note, any hashes or semi-colons need to be removed, otherwise the changes will be ignored.
allow_embedding = true
cookie_samesite = lax
See this article for more details
2.2) Update the auth_anonymous section of the grafana.ini config file to enable anonyous login
2.3) Remember to restart your grafana service once the configuration changes are saved - Back in HE, on the device configuration screen for the virtual Tile Master device, paste the dashboard embed code into the parameter text field for the sendTile01 command button and click the button to run the command. An example of the embed code is shown below:
<iframe src="http://192.168.0.29:3000/d/fZew_iiRk/hubitat-climate-charts?orgId=1&refresh=30s&from=now-1h&to=now&var-Sensor=Kitchen %2F Dining&var-Sensor=Master Bedroom&var-Sensor=Study&var-Sensor=Third Bedroom&kiosk" width="900" height="2000" frameborder="0"></iframe>
In addition to the embed code from previous steps, the following adjustments may also be needed:
- The width and height settings may need to be adjusted based on the HE dashboard layout where the tile will be displayed
- The from and to settings can be provided as part of the URL, e.g. the last 1 hour
- The &kiosk parameter will remove all the menus and other Grafana UI elements around the dashboard
- Lastly, add the Tile Master device to a HE dashboard, selecting the attribute template and the tm-tile01 attribute. Some adjustments may be necessary to some of the settings listed in the IFRAME from step 3.
Hope this helps,
Simon


