I just installed the Vue 2 in my house. May look at setting this up. In habitat.
I already have a influx db running in docker. Can I used that or do I need to spin up another one?
Should work with Docker Version.
This was helpful, but I have the following problem:
I can see the plot on my dashboard in Firefox, but when I try to view from Fully Kiosk Browser, it doesn't work:
Firefox:
I saw something about using a Grafana image renderer plugin, but it required more horsepower than my RPi 4 can manage.
Any suggestions to getting this data onto my dashboard? Maybe I'll need to store the data on the Hubitat rather than in InfluxDB on my RPi.
I was actually working on a new Phython Engine/App/Driver that avoids the use of influxDB and Grafana - It will just send power readings every few seconds to hubitat - then we can use hubigraph or other Apps to show/track... I guess I need to get back on that... 
Where did you get your flexible red current transformers from - it appears Emporia are no longer selling them… was there a known problem or safety issue with them? Only listed from China/eBay now.
Yeah I'm thinking I might need to pull the readings from my Raspberry Pi and store them on the Hubitat. Otherwise I might find another graphing server for the Pi.
I bought them as part of the of my kit --> Emporia Vue Home Energy Monitor with individual appliance meters – Emporia Energy
It says "out of stock"... hmm I would contact support (if you haven't already) it is excellent. If you've already contacted them, is that where you heard about the safety issue?
The new thing I'm building just uses the Raspberry Pi to pull the data from Emporia and pushes it to Hubitat..... Super basic, but should be super stable... Given that, I will share when I'm done.
1 Like
I hadn't heard anything re safety, support say it's a pure supply/logistics issue and not any product concern. They will come back into stock over time. China lockdown I guess.
Did you make any progress on this? I am getting the system soon and can test the code.
I've made progress. I'll try to focus on getting it done next week. Sorry for the delay.... life is just busy. Thanks for the interest.
Hi @nielsen411 !!
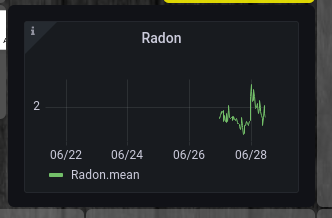
This post was fantastic, after more than two months of trying, today I finally managed to display a graph of Granfana in the HE dashboard, THANK YOU!
However, I am still facing a problem, and I would like to get some help.
When I open the HE dashboard in a browser on a computer on the local network, the graphic is presented without any problem, but if I use the APP on the phone, the same dashboard presents an empty tile, with no graphic.
I imagine that extrapolating the situation, if I am outside the local network, the problem will repeat itself.
Any solution for this situation?
Thanks.
Old thread, but I'm trying to get this to work...
Yes, this happens outside the local network. The odd thing is that, when connecting from outside the local network, in the device page the image displays correctly under Current States-->iFrame. But in a dashboard, it doesn't display.
Does any one know of a solution? Thanks.
EDIT:
I'll answer my own question, partially: The issue for dashboards not displaying the Grafana iFrame is due to browsers blocking non-secure content. If that's changed in the site info for the Hubitat dashboard in the browser, it displays properly.
I don't see a way to change that in the mobile Hubitat app.
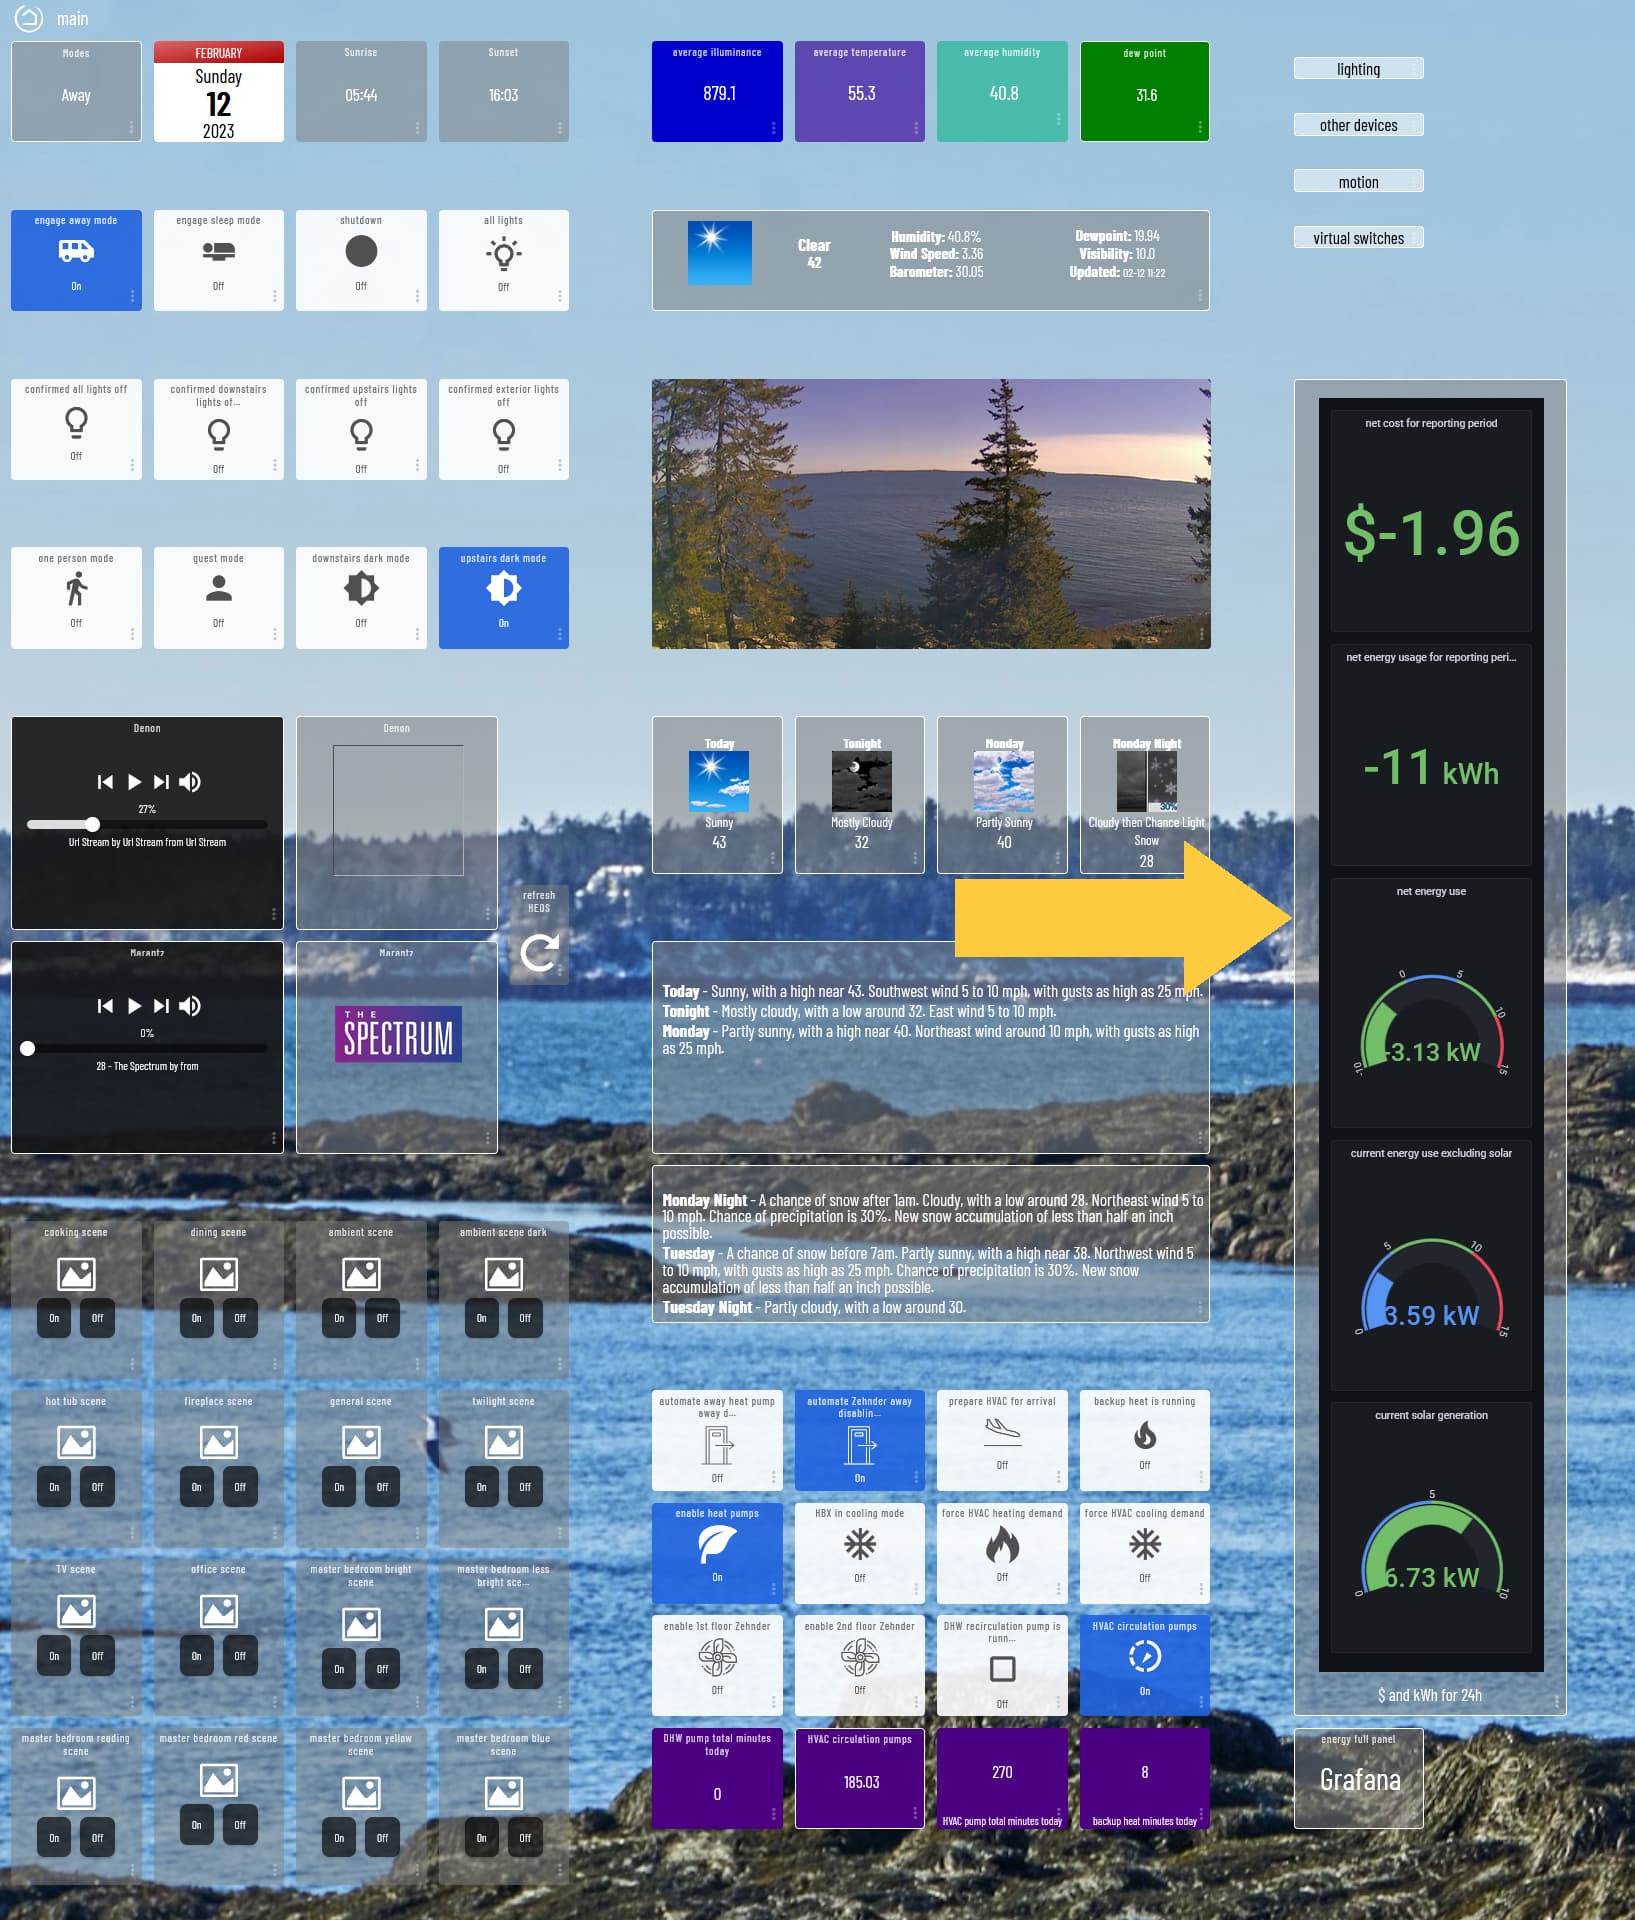
Here is what I ended up with in my dashboard, which now displays correctly remotely. I found this post very helpful in getting the iFrame to display properly.
1 Like
That would be awesome! It would make me buy the Emporia...
....wait - I read downthread that is still requires a Raspberry Pi. It is physically possible to simply get the Emporia readings direct into Hubitat, or will it always require additional devices and software?
It does require a server. I installed influxDB and Grafana in Docker running on a Windows computer. Being new to all of those things, I did not find it straightforward.
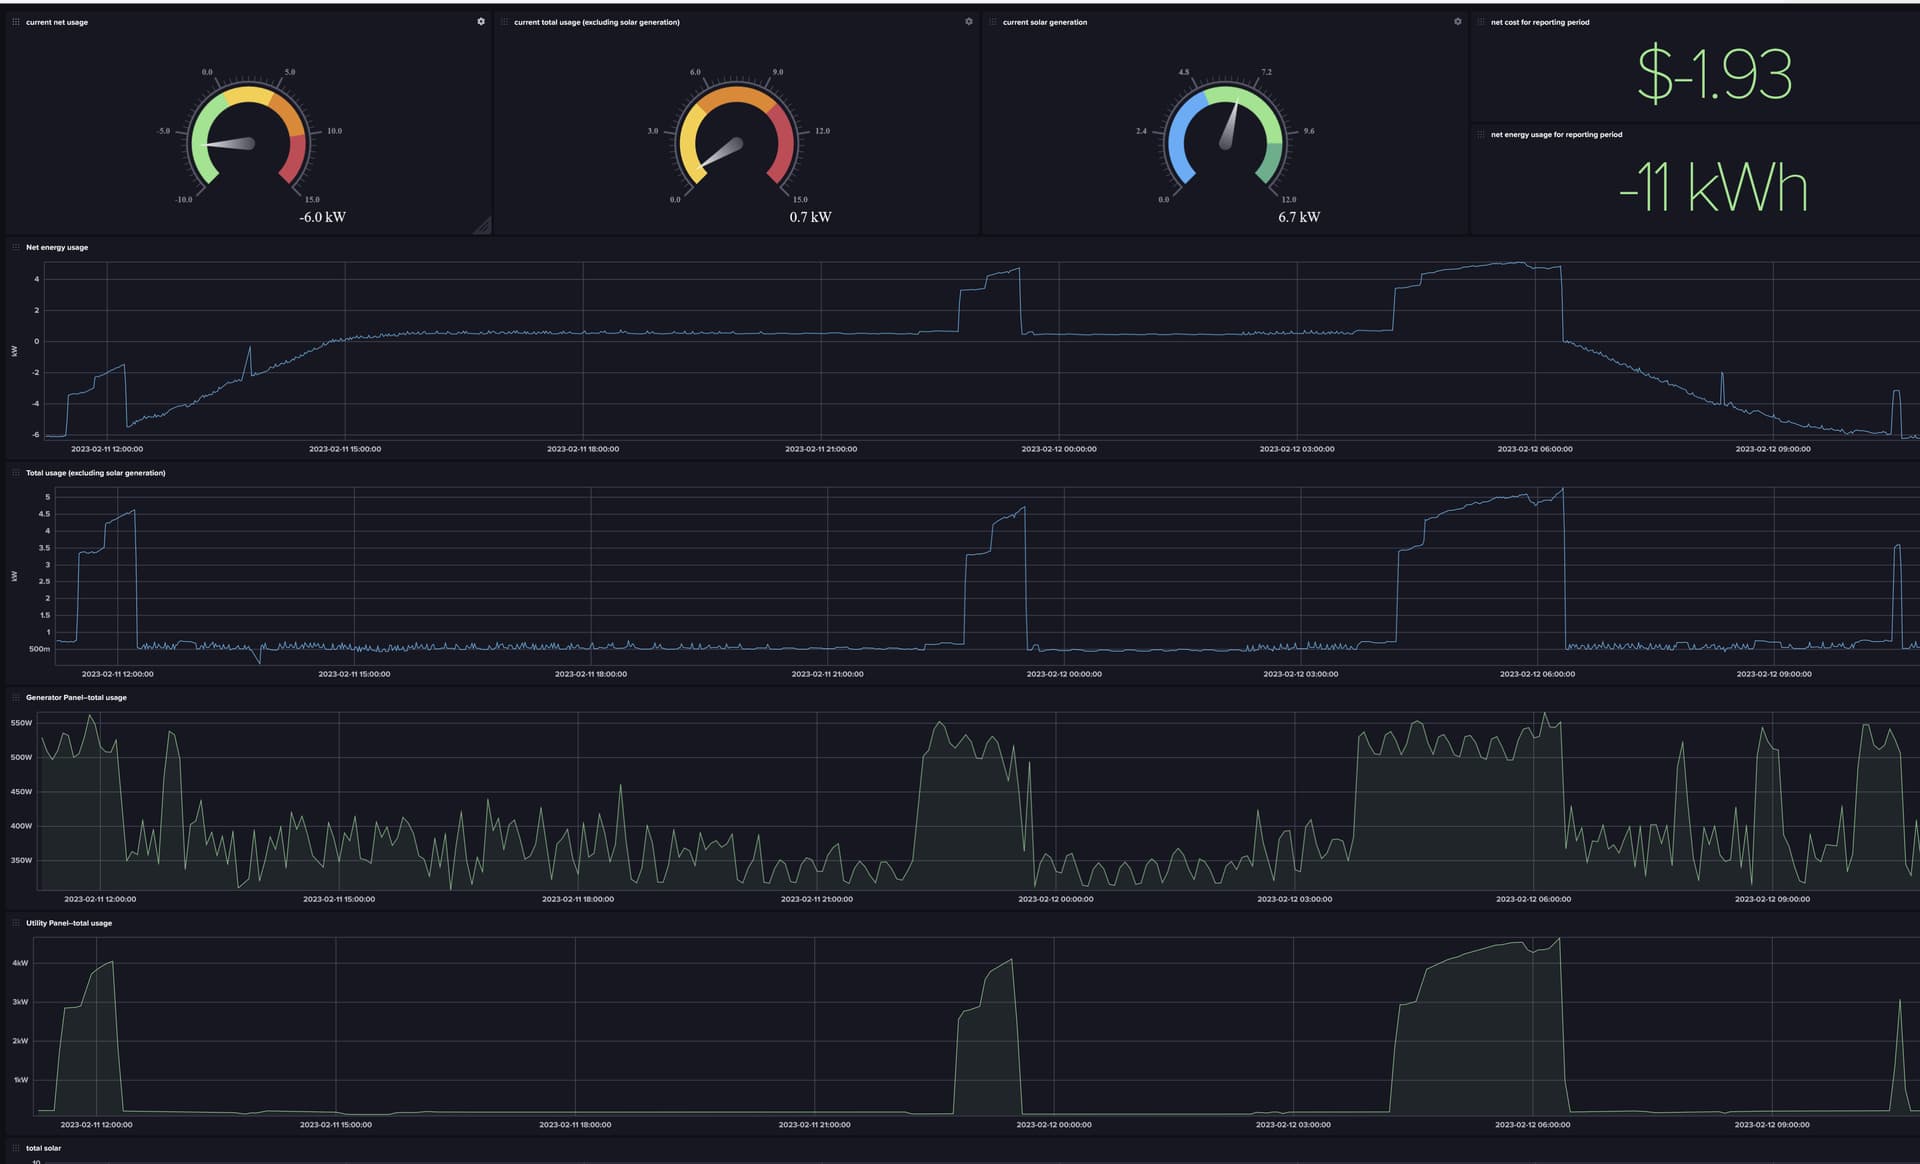
Incidentally, using influxDB to display the data is easier and more useful, and avoids a lot of bother getting things into the Hubitat dashboard. Here is a screenshot of data displayed in influxDB (without needing Grafana). There are a lot more graphs when scrolling down the page, including one for each circuit:
1 Like
That looks cool. However I don't have a windows computer that is always on, and installing "influx DB and Grafana in Docker" is way above my skillset. I have no idea what that even means...
Yeah, I didn't either when I started. I gave up several times along the way, but kept coming back to it. These instructions were what made it possible for me.
1 Like
How did you get the background image on your dashboard?
With the dashboard page open, click on the gear icon at the upper right. At the bottom of the dialog window that opens, it says "background image." Enter the url of the image you want--I use images stored on Google Photos; right click on the image and choose "copy image link." That will give you a direct link to the photo.
I have tried local and your method of copying a link. It still does not work. I looked at the JSON file and the link is there. Is it possible that because I have a C5 it will not work?

