I have some data that I'd like to put on my Hubitat dashboard, which then shows up on my tablets. The data comes from a Radon monitor, gets read by a Python script on a Raspberry Pi and saved to InfluxDB running on the same RPi. I also have Grafana installed on the RPi, and it generates a plot that looks fine. I've put the plot into an iframe, and displayed that on the dashboard using iFrameAdvanced.:
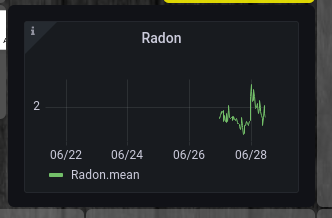
That's the image when viewing my dashboard from Firefox.
However, that plot won't show up from Fully Kiosk Browser, which is running on my tablets. Instead, I get an error from Grafana:
If you’re seeing this Grafana has failed to load its application files
- This could be caused by your reverse proxy settings.
- If you host grafana under subpath make sure your grafana.ini root_url setting includes subpath. If not using a reverse proxy make sure to set serve_from_sub_path to true.
- IF you have a local dev build make sure you build frontend using: yarn start, yarn start:hot, or yarn build
- Sometimes restarting grafana-serve can help
- Check if you are using a non-supported browser. For more information, refer to the list of supported browsers.

I've also posted about this problem at:
I already edited some config for Grafana (not sure if the cookie setting is needed):
cookie_samesite = none
allow_embedding = true
That didn't help with Fully Kiosk Browser, though.
I'm running Grafana v9.0.1, and InfluxDB v1.8.10.
So, what I'm wondering is, does anyone have a solution to getting data from InfluxDB and plotting it on a dashboard viewable from Fully? It seems like Fully isn't compatible with rendering Grafana in an iframe. Maybe I need another application for plotting this instead of Grafana?
Is there a quick way to pull data from InfluxDB and use HubiGraphs to plot it?