Audience: Habitat users trying to get the most out of their Emporia Vue purchase. Users that want to display a Panel from Grafana on their Hubitat Dashboard.
Caveats: I’m a hack… I’m happy to help but always in a learning mode.. so, I won’t be able to answer every question (aka not an expert on anything below) but I’m happy to contribute to Hubitat and its community.
Project:
- Install Emporia Vue Energy Monitor for my home (How the Gen 2 Vue Energy Monitor Works).
- Set up vuegraf
- Display vuegraf panels in Hubitat Dashboard
- Send Data to Hubitat (not ready for Prime time…. I have it working but I want to get this integrated into vuegraf - haven't asked yet as an option and clean up the code a little.) If you are interested in this please PM me.
What you need:
- Emporia Vue Energy Monitor
- Raspberry pi (or some other compute device capable of running Grafana, Influx, and Python 3 code
- vuegraf by JJason Ertel and contributors (GitHub - jertel/vuegraf: Populate metrics from your Emporia Vue energy monitoring devices into an InfluxDB)
- iFrame Device by @mbarone (GitHub - michaelbarone/hubitat)
- My hack (not ready for prime time.. PM me if you want code/drivers/tips… As a hack, I could use the help)
Credits:
- Emporia for their impressive product at a great price point
- Jason Ertel (GitHub - jertel/vuegraf: Populate metrics from your Emporia Vue energy monitoring devices into an InfluxDB) for his work to get Vue data into grafana
- Everyone who contributed to (GitHub - magico13/PyEmVue: Python Library for the Emporia Vue Energy Monitor) that allows connections to Emporia API
- @mbarone for his tips/code for iFrame in a tile and how to access Grafana
NOTE: This is not a supported product from Emporia. They could/may stop access at any time.
Step 1: Installation of Energy Monitor
WARNING: If you don’t understand electricity and/or how it’s delivered to your home, I strongly suggest you hire an electrician to install the Energy Monitor. This is not trivial task and could lead to injury, death, a fire… please be safe.
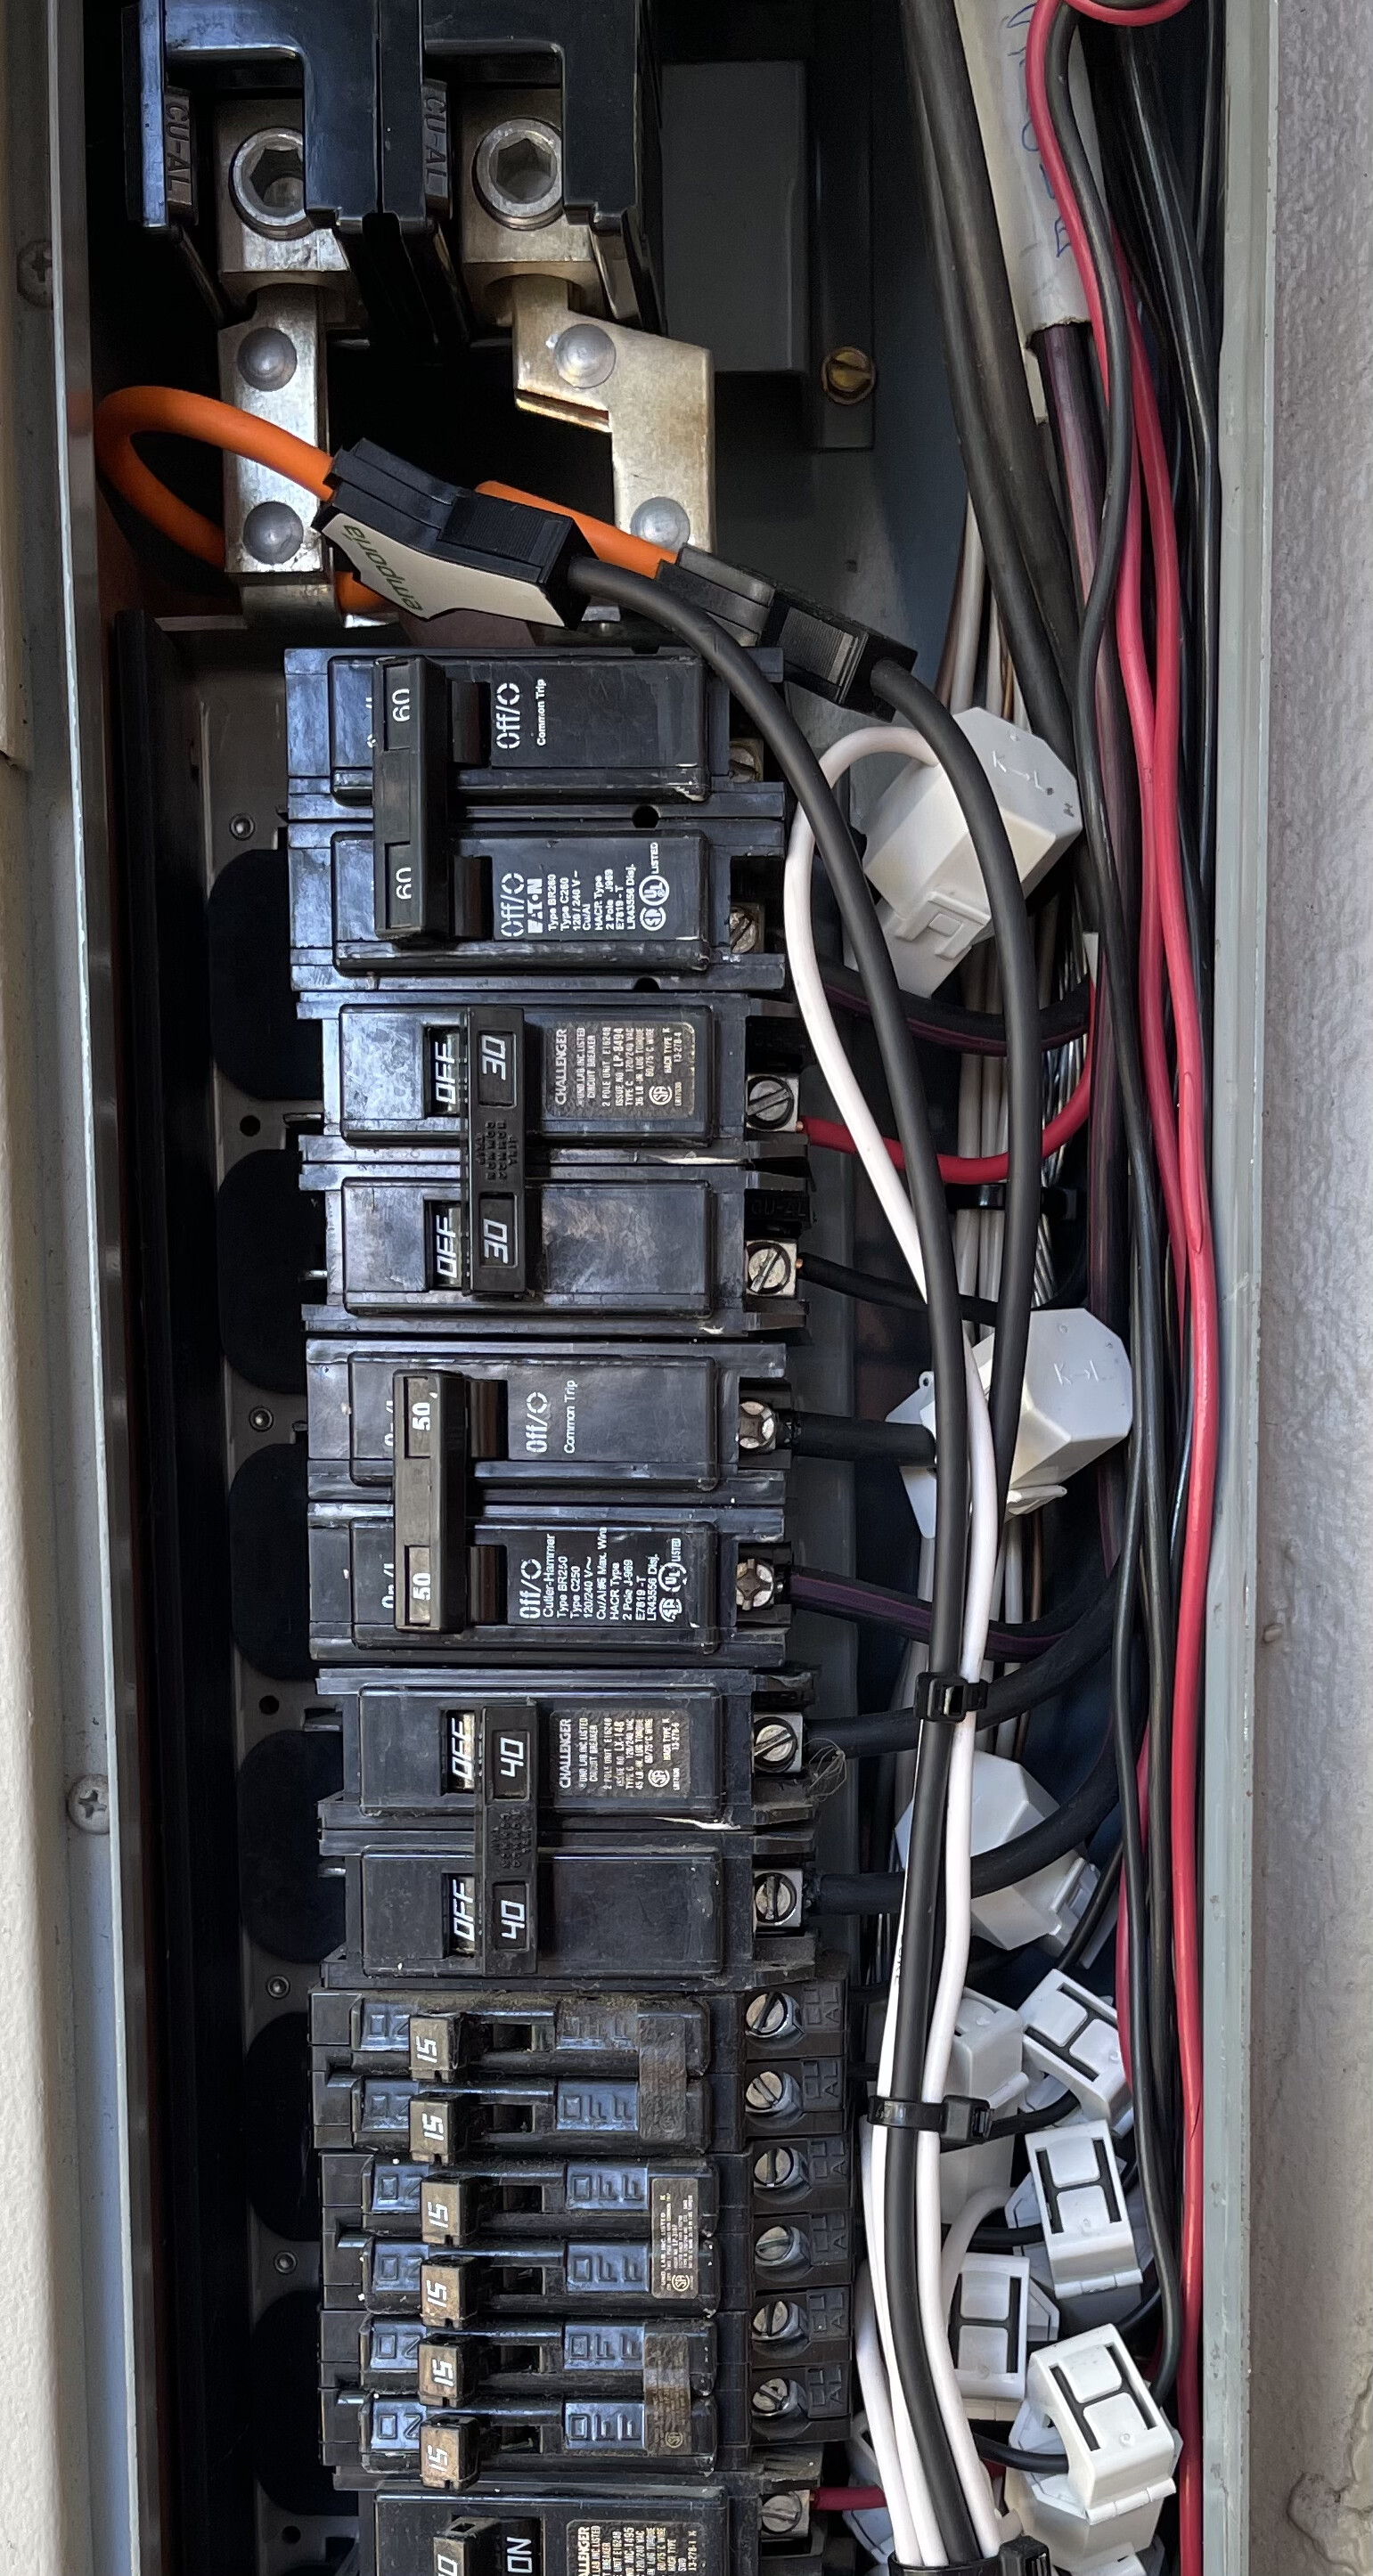
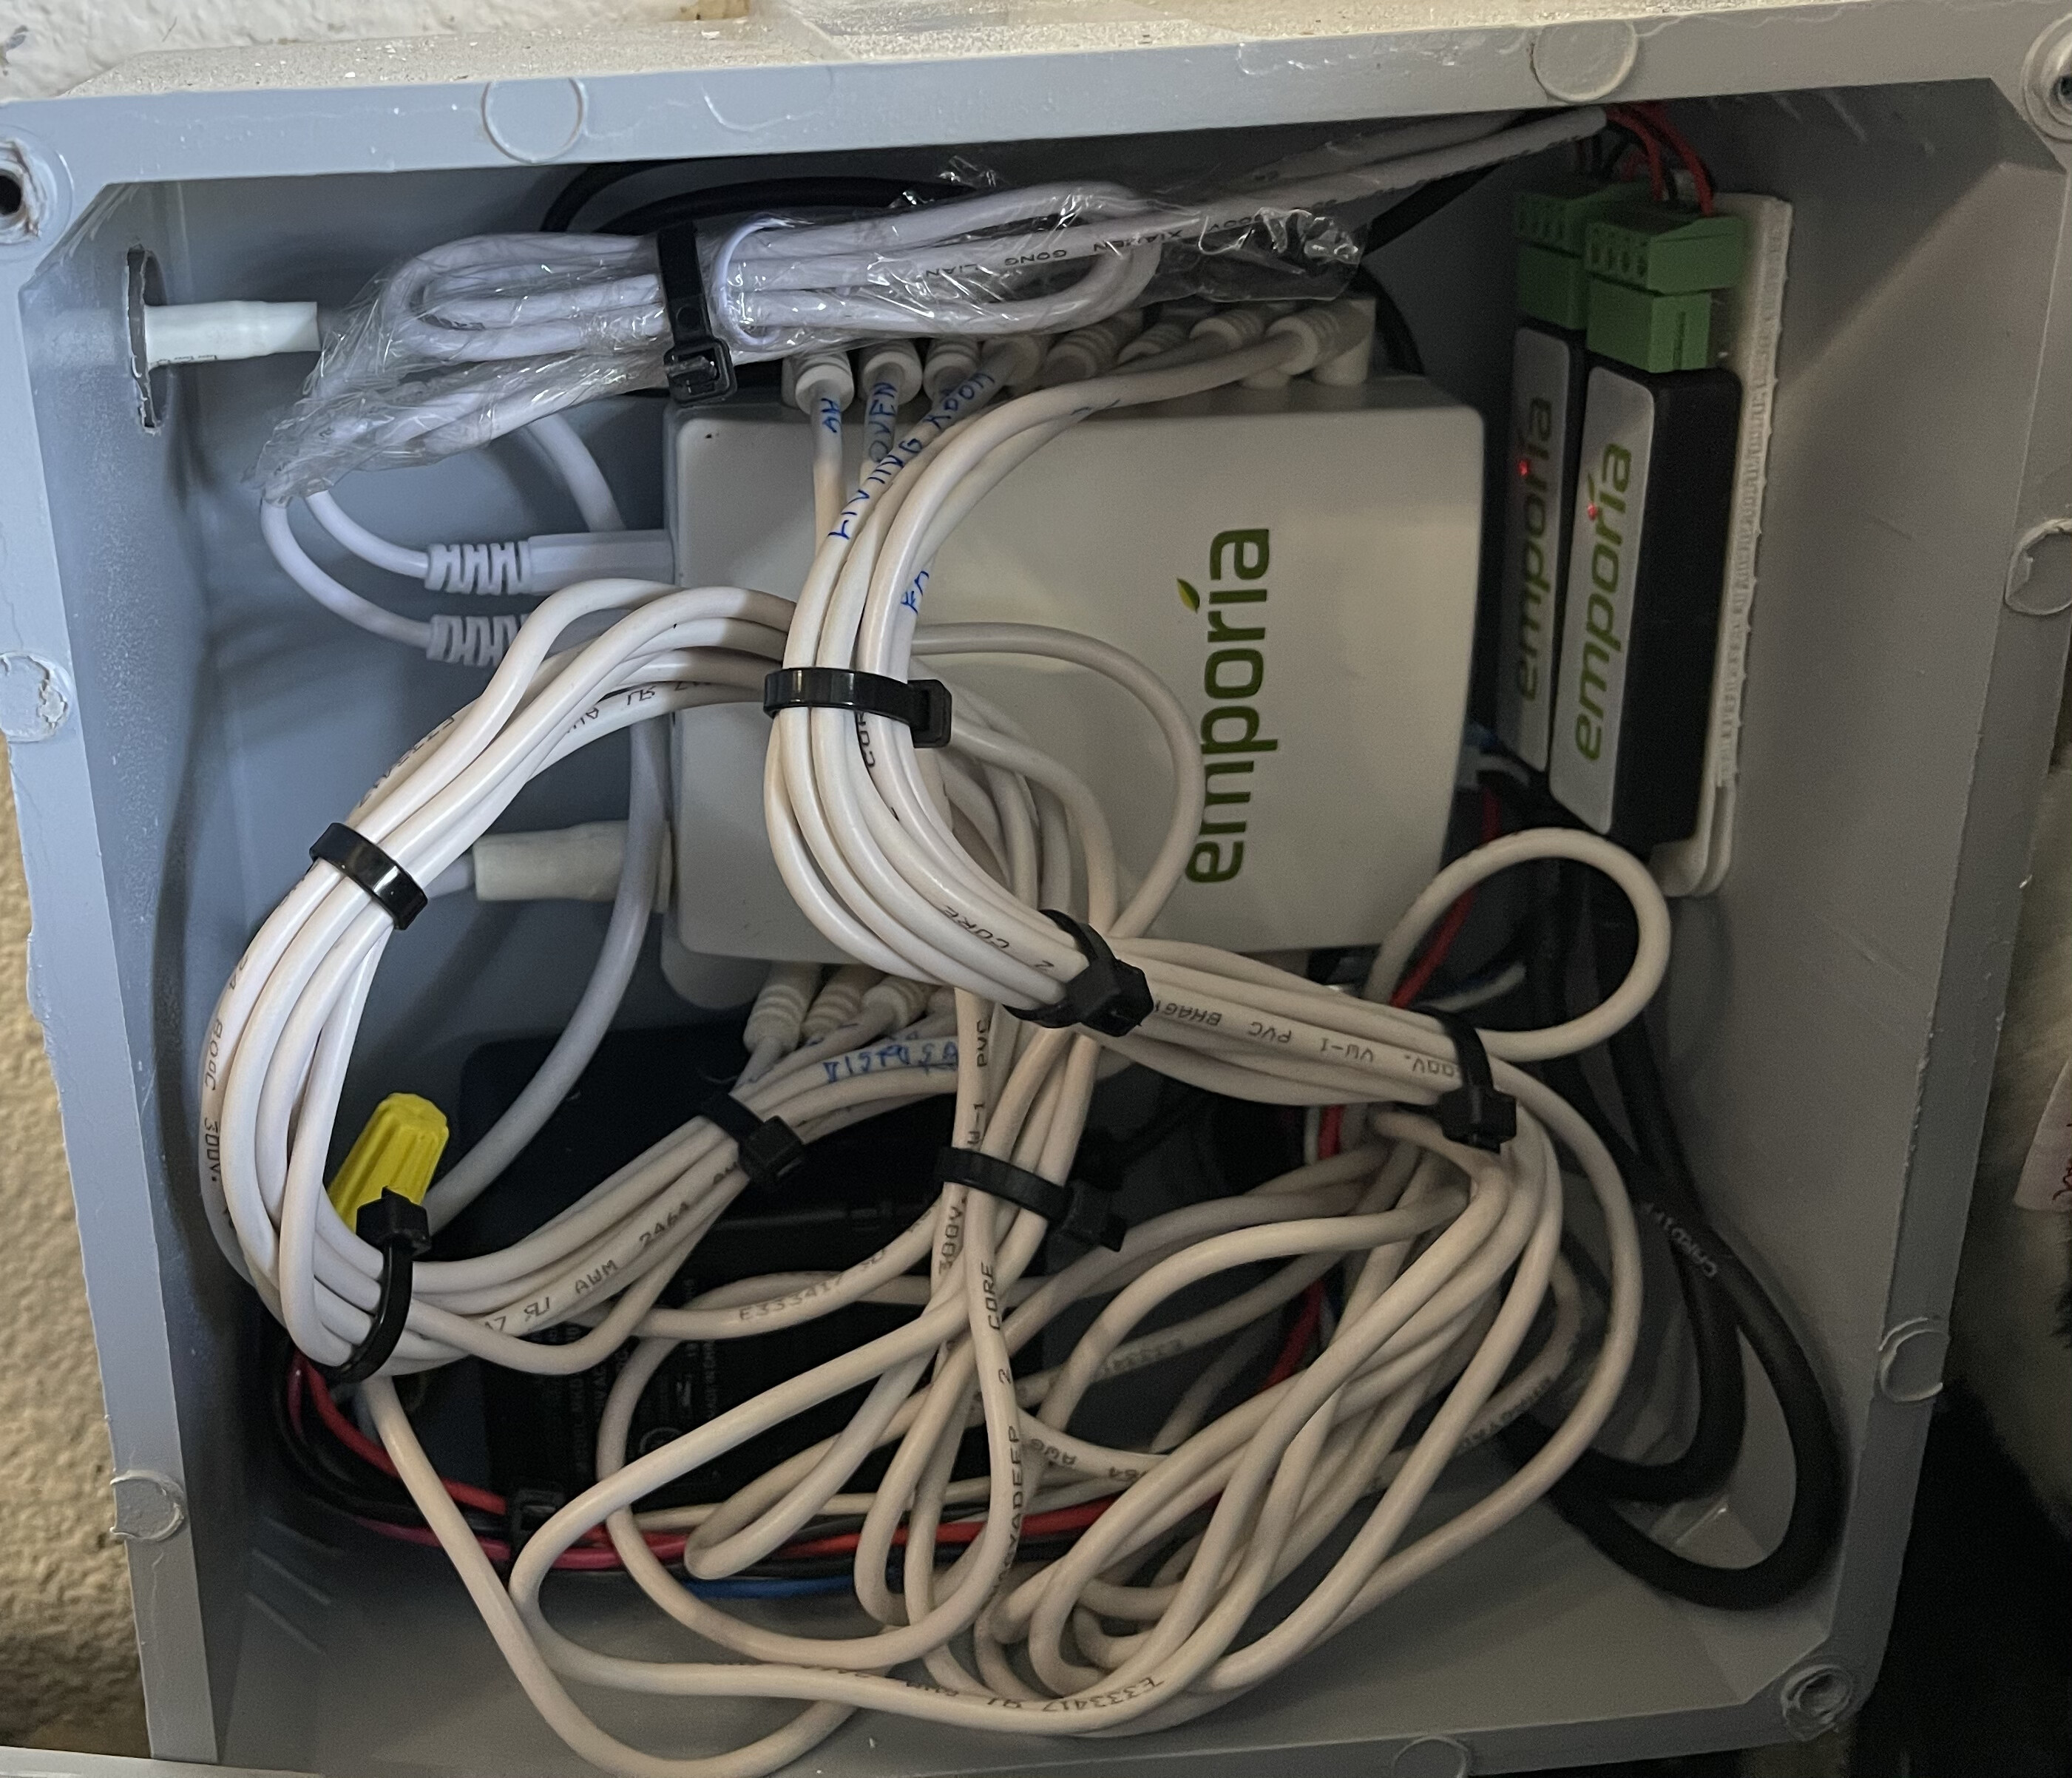
Here are pictures of my install:
Main Breaker Panel with current sensors
Emporia device in separate box (no way this would fit in my panel - something to assess/plan before purchase)
Once installed (per the instructions) you should have something like the following in your iOS or Android Emporia App

Step 2: Install vuegraph on your compute device. I used a raspberrypi 3.
Instructions are found here —> GitHub - jertel/vuegraf: Populate metrics from your Emporia Vue energy monitoring devices into an InfluxDB
Notes: I did not use the container install… however, agree that’s preferred if you are comfortable with containers. The standard install worked fine although I did run into issues with python3 not playing nice with python2 libraries. Lots of info on how to fix library PATHs but it can be a hassle.
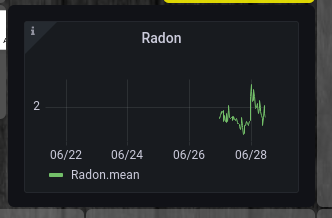
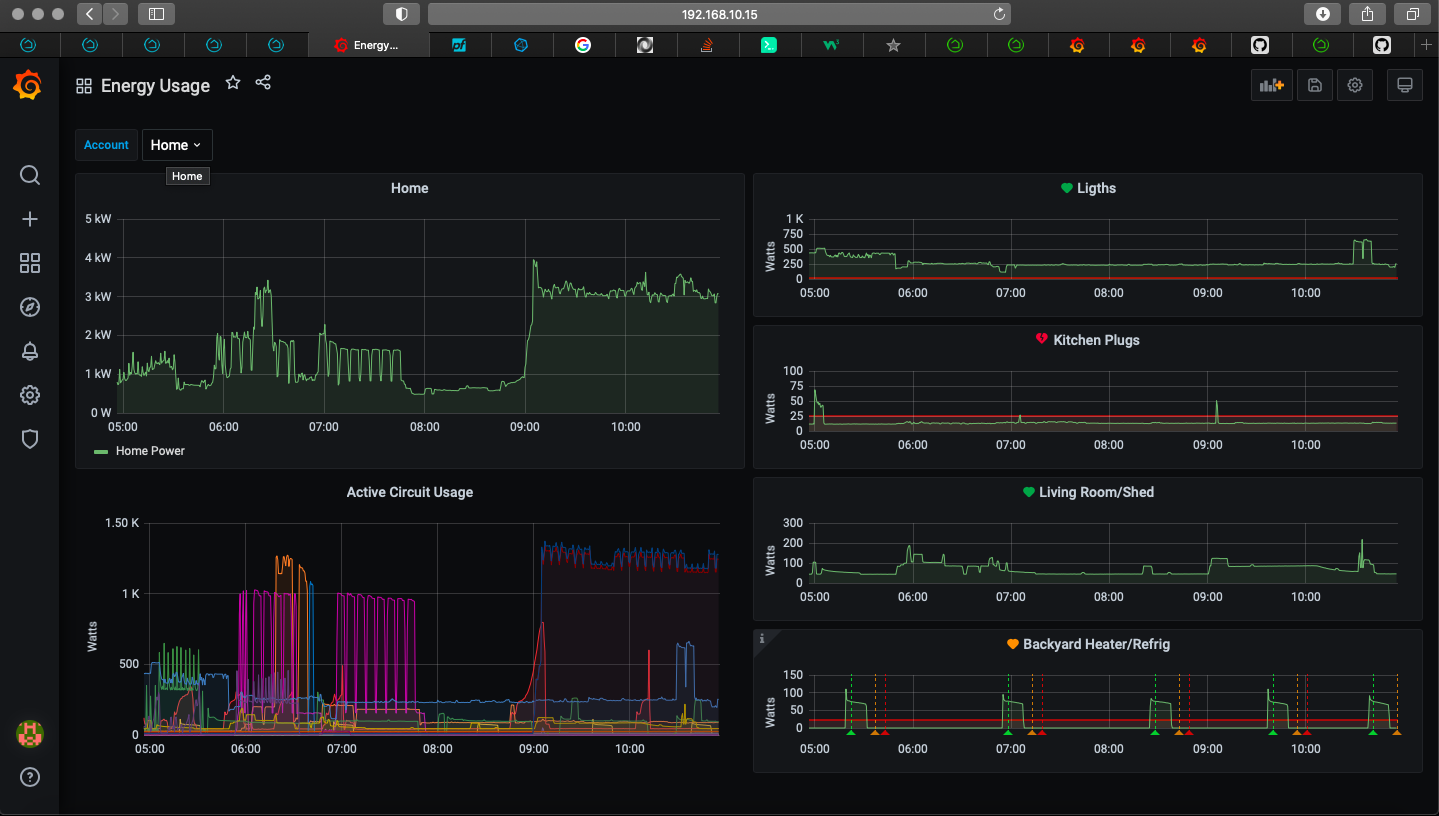
Log into Grafana and upload your Grafana Dashboard. If you’re using the single Vue device (aka one Vue Energy Monitor), make sure you start with the dashboard-single-panel.json
you should see something like this…
Step 3: Display vuegraf panels in Hubitat Dashboard
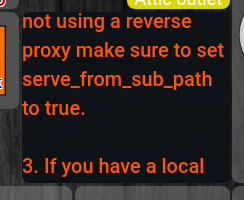
First steps first we need to allow iframe and unauthenticated connections to Grafana.
Make the following changes in grafana.ini (/etc/grafana/grafana.ini)
#This allows iframe calls
[security] <— this section
allow_embedding = true
#This allows viewer access without authentication
[auth.anonymous] <— this section
enabled = true
org_name = Main Org.
org_role = Viewer
Install iFrame.groovy device driver in hubitat —> iFrame.groovy
Follow instructions provided in comments section of driver.
Once the device has been created set the URL as follows:
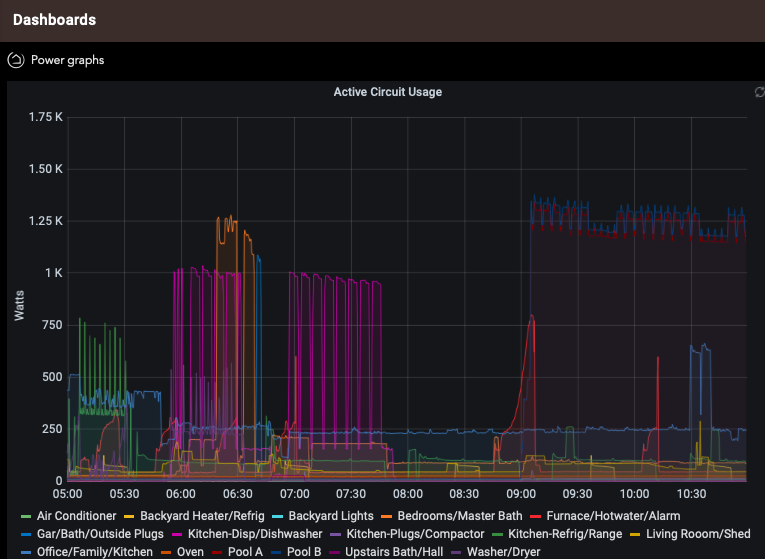
For a whole panel —> click the down arrow at the top of the panel and select share. Select Link tab and copy the URL. Past that URL info the device in hubitat created from the iFrame.groovy device driver.
For just the Graph on the Panel —> click the down arrow at the top of the panel and select share. Select Embed tab and copy the URL, starting at http://, ending at panelId=X (additionally remove the “from=xxxxxxx and to=xxxxxx” parameters from the URL. Past that URL info the device in hubitat created from the iFrame.groovy device driver.
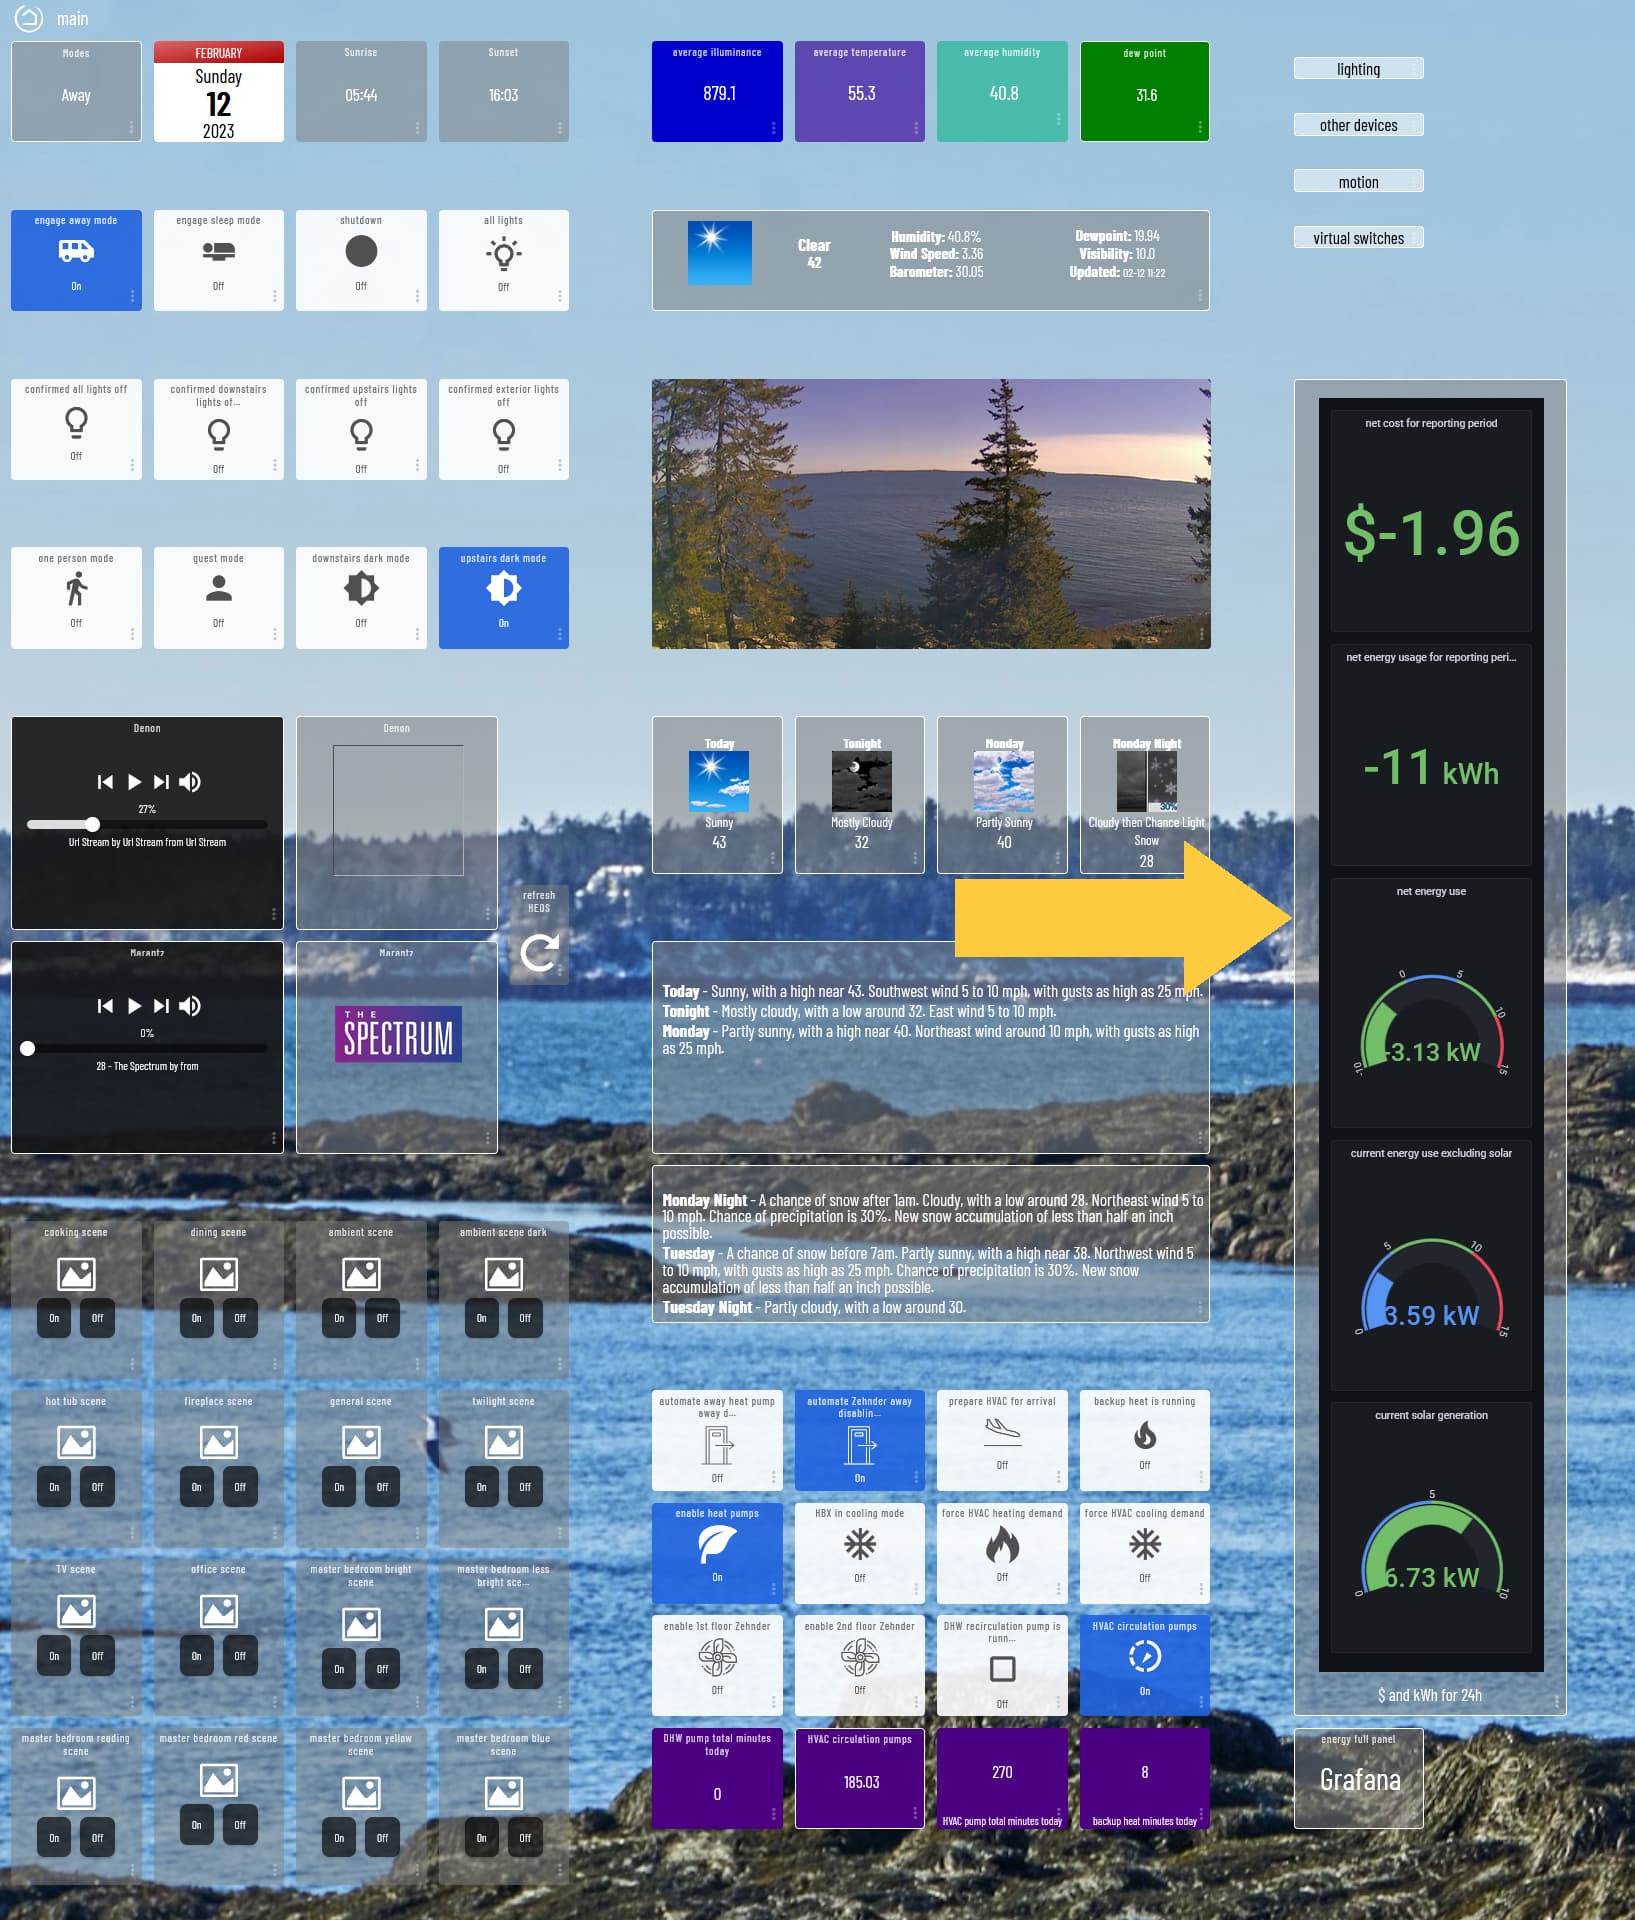
Add the device to a Dashboard… it should look like this once it’s sized properly. You can add whatever you want with other tiles.
Step 4: Send Data to Hubitat
I will update as soon as I feel comfortable. PM me if you have a Vue and want to give it a try before I release the drivers and Python Code needed. Note: you’ll need everything above to make the push to hubitat work (at least the way I’ve hacked it together).

That’s it… good luck and I will be adding the push to Hubitat as time permits.
Cheers,
Paul