That would be awesome! It would make me buy the Emporia...
....wait - I read downthread that is still requires a Raspberry Pi. It is physically possible to simply get the Emporia readings direct into Hubitat, or will it always require additional devices and software?
It does require a server. I installed influxDB and Grafana in Docker running on a Windows computer. Being new to all of those things, I did not find it straightforward.
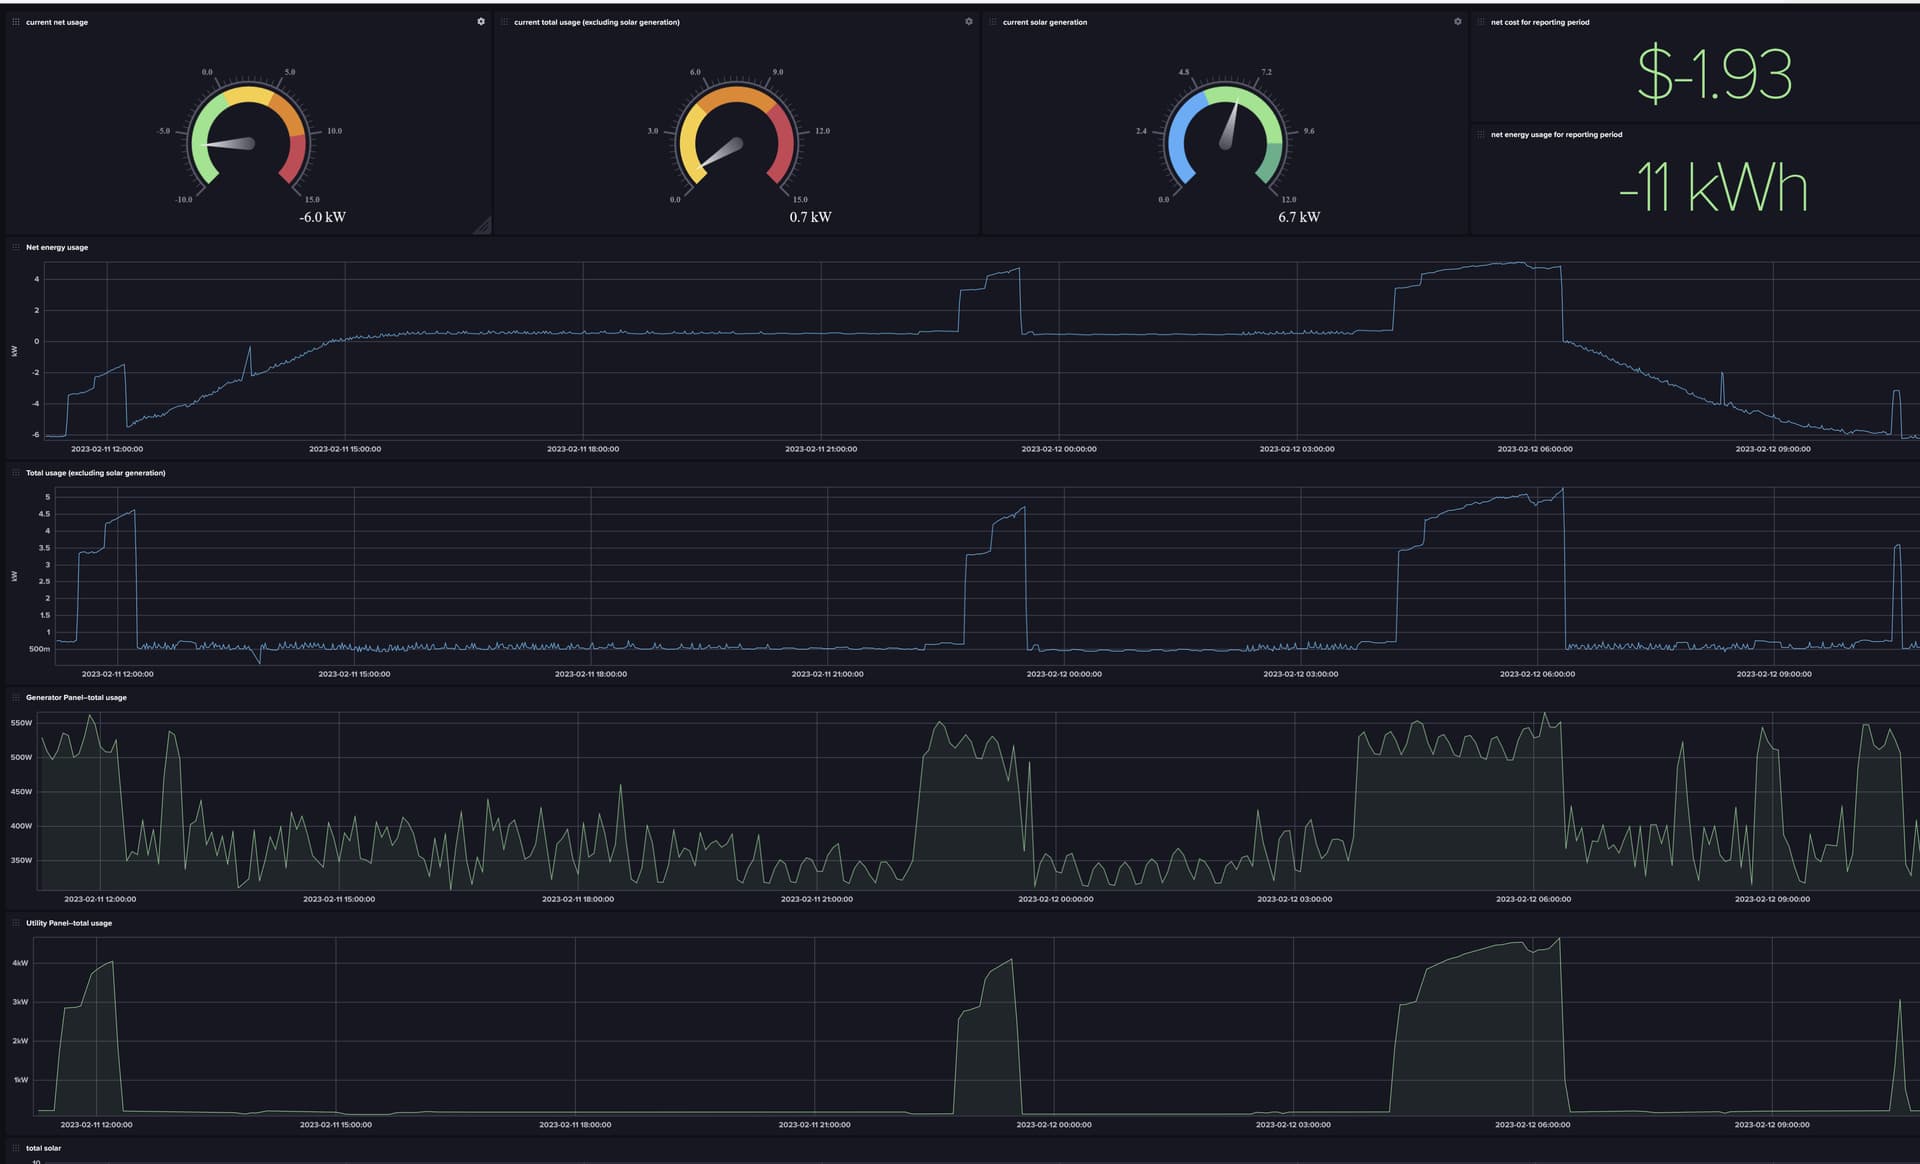
Incidentally, using influxDB to display the data is easier and more useful, and avoids a lot of bother getting things into the Hubitat dashboard. Here is a screenshot of data displayed in influxDB (without needing Grafana). There are a lot more graphs when scrolling down the page, including one for each circuit:
1 Like
That looks cool. However I don't have a windows computer that is always on, and installing "influx DB and Grafana in Docker" is way above my skillset. I have no idea what that even means...
Yeah, I didn't either when I started. I gave up several times along the way, but kept coming back to it. These instructions were what made it possible for me.
1 Like
How did you get the background image on your dashboard?
With the dashboard page open, click on the gear icon at the upper right. At the bottom of the dialog window that opens, it says "background image." Enter the url of the image you want--I use images stored on Google Photos; right click on the image and choose "copy image link." That will give you a direct link to the photo.
I have tried local and your method of copying a link. It still does not work. I looked at the JSON file and the link is there. Is it possible that because I have a C5 it will not work?