Ok, maybe I didn't need to tidy it up too much.... ![]() It's a fairly long post, so might compress it up...
It's a fairly long post, so might compress it up...
Setup
Note, I'm using the old version of Grafana / InfluxDB, I baulked at the change in query language that one of them introduced, and haven't bothered to upgrade. InfluxDB and Grafana are running on a rpi4.
It does still have an issue that I never got to the bottom of, the Master Bedroom doesn't display as an actual chart for some reason, in this example, but it only happens randomly and not all the time...
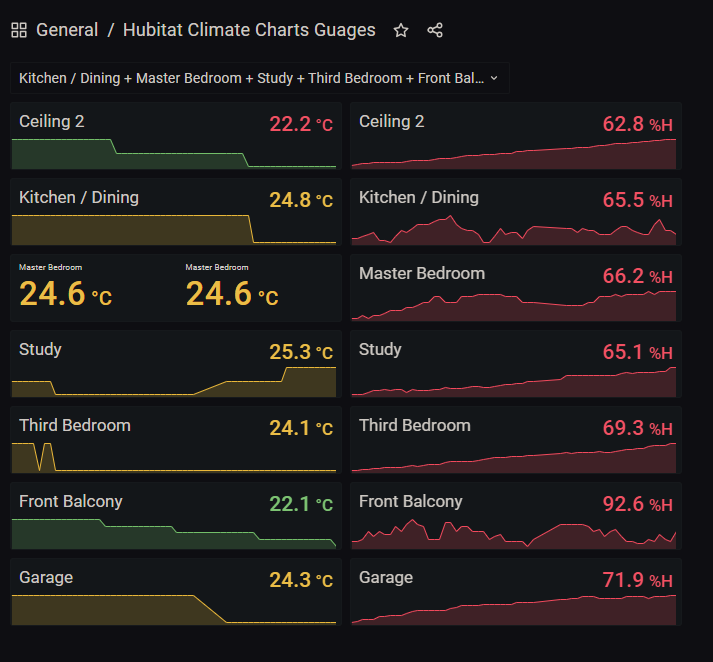
I'm basically using the Stat Panel chart repeated using a variable, which is also used to filter the sensors that are selected.
The variable is setup as a hard-coded list of device names from HE:

The chart is setup using the Stat Panel (I think it may have been a plugin). The query uses the variable in the filtering of the temperature / humidity readings. It also includes the repeat option, using a vertical repeat.

I talk here about embedding these charts in a HE dashboard using Tile Master. I don't use this anymore, but if I do it again I would use one of the more recent iFrame drivers to do this.
Here is the JSON Model if it's useful:
JSON Model
{
"annotations": {
"list": [
{
"$$hashKey": "object:35",
"builtIn": 1,
"datasource": "-- Grafana --",
"enable": true,
"hide": true,
"iconColor": "rgba(0, 211, 255, 1)",
"name": "Annotations & Alerts",
"type": "dashboard"
}
]
},
"editable": true,
"gnetId": null,
"graphTooltip": 0,
"id": 6,
"iteration": 1701458296280,
"links": ,
"panels": [
{
"datasource": null,
"description": "",
"fieldConfig": {
"defaults": {
"color": {
"mode": "thresholds"
},
"decimals": 1,
"displayName": "$Sensor",
"mappings": ,
"thresholds": {
"mode": "absolute",
"steps": [
{
"color": "green",
"value": null
},
{
"color": "#EAB839",
"value": 24
},
{
"color": "red",
"value": 26
}
]
},
"unit": "celsius"
},
"overrides":
},
"gridPos": {
"h": 2,
"w": 6,
"x": 0,
"y": 0
},
"id": 2,
"interval": "",
"links": ,
"options": {
"colorMode": "value",
"graphMode": "area",
"justifyMode": "auto",
"orientation": "auto",
"reduceOptions": {
"calcs": [
"lastNotNull"
],
"fields": "",
"values": false
},
"text": {},
"textMode": "auto"
},
"pluginVersion": "8.0.5",
"repeat": "Sensor",
"repeatDirection": "v",
"targets": [
{
"alias": "$tag_deviceName",
"groupBy": [
{
"params": [
"deviceName"
],
"type": "tag"
}
],
"measurement": "temperature",
"orderByTime": "ASC",
"policy": "default",
"query": "SELECT "value" AS "Temperature" FROM "temperature" WHERE $timeFilter GROUP BY "deviceName"",
"rawQuery": false,
"refId": "A",
"resultFormat": "time_series",
"select": [
[
{
"params": [
"value"
],
"type": "field"
},
{
"params": [
"Temperature"
],
"type": "alias"
}
]
],
"tags": [
{
"key": "deviceName",
"operator": "=~",
"value": "/^$Sensor$/"
},
{
"condition": "AND",
"key": "deviceName",
"operator": "!=",
"value": "Third Bedroom Sliding Door Sensor"
},
{
"condition": "AND",
"key": "deviceName",
"operator": "!=",
"value": "Bathroom Window Sensor on HELIGHTS01"
},
{
"condition": "AND",
"key": "deviceName",
"operator": "!=",
"value": "Garage Door Sensor"
},
{
"condition": "AND",
"key": "deviceName",
"operator": "!=",
"value": "Garage Exterior Door Sensor"
},
{
"condition": "AND",
"key": "deviceName",
"operator": "!=",
"value": "Garage Window Sensor"
},
{
"condition": "AND",
"key": "deviceName",
"operator": "!=",
"value": "Master Bedroom Sliding Door Sensor on HELIGHTS01"
},
{
"condition": "AND",
"key": "deviceName",
"operator": "!=",
"value": "Master Bedroom Window Sensor on HELIGHTS01"
},
{
"condition": "AND",
"key": "deviceName",
"operator": "!=",
"value": "Study Window Sensor on HELIGHTS01"
},
{
"condition": "AND",
"key": "deviceName",
"operator": "!=",
"value": "Third Bedroom Sliding Door Sensor on HELIGHTS01"
},
{
"condition": "AND",
"key": "deviceName",
"operator": "!=",
"value": "Study Button on HELIGHTS01"
},
{
"condition": "AND",
"key": "deviceName",
"operator": "!=",
"value": "Garage Window Sensor on HELIGHTS01"
}
]
}
],
"timeFrom": null,
"timeShift": null,
"type": "stat"
},
{
"datasource": null,
"fieldConfig": {
"defaults": {
"decimals": 1,
"displayName": "$Sensor",
"mappings": [],
"thresholds": {
"mode": "absolute",
"steps": [
{
"color": "green",
"value": null
},
{
"color": "red",
"value": 60
}
]
},
"unit": "humidity"
},
"overrides": []
},
"gridPos": {
"h": 2,
"w": 6,
"x": 6,
"y": 0
},
"id": 3,
"interval": "",
"links": [],
"options": {
"colorMode": "value",
"graphMode": "area",
"justifyMode": "auto",
"orientation": "horizontal",
"reduceOptions": {
"calcs": [
"lastNotNull"
],
"fields": "",
"values": false
},
"text": {},
"textMode": "auto"
},
"pluginVersion": "8.0.5",
"repeat": "Sensor",
"repeatDirection": "v",
"targets": [
{
"alias": "$tag_deviceName",
"groupBy": [
{
"params": [
"deviceName"
],
"type": "tag"
}
],
"measurement": "humidity",
"orderByTime": "ASC",
"policy": "default",
"query": "SELECT "deviceName", "value" AS "Temperature" FROM "temperature" WHERE ("deviceName" = 'Study Temperature') AND $timeFilter GROUP BY "deviceName"",
"rawQuery": false,
"refId": "A",
"resultFormat": "time_series",
"select": [
[
{
"params": [
"value"
],
"type": "field"
},
{
"params": [
"Temperature"
],
"type": "alias"
}
]
],
"tags": [
{
"key": "deviceName",
"operator": "=~",
"value": "/$Sensor$/"
}
]
}
],
"timeFrom": null,
"timeShift": null,
"type": "stat"
}
],
"refresh": "",
"schemaVersion": 30,
"style": "dark",
"tags": ,
"templating": {
"list": [
{
"allValue": null,
"current": {
"selected": true,
"text": [
"Kitchen / Dining",
"Master Bedroom",
"Study",
"Third Bedroom",
"Front Balcony",
"Garage",
"Ceiling 2"
],
"value": [
"Kitchen / Dining",
"Master Bedroom",
"Study",
"Third Bedroom",
"Front Balcony",
"Garage",
"Ceiling 2"
]
},
"description": null,
"error": null,
"hide": 1,
"includeAll": true,
"label": null,
"multi": true,
"name": "Sensor",
"options": [
{
"selected": false,
"text": "All",
"value": "$__all"
},
{
"selected": false,
"text": "Ceiling",
"value": "Ceiling"
},
{
"selected": true,
"text": "Ceiling 2",
"value": "Ceiling 2"
},
{
"selected": false,
"text": "Courtyard",
"value": "Courtyard"
},
{
"selected": true,
"text": "Kitchen / Dining",
"value": "Kitchen / Dining"
},
{
"selected": true,
"text": "Master Bedroom",
"value": "Master Bedroom"
},
{
"selected": true,
"text": "Study",
"value": "Study"
},
{
"selected": true,
"text": "Third Bedroom",
"value": "Third Bedroom"
},
{
"selected": true,
"text": "Front Balcony",
"value": "Front Balcony"
},
{
"selected": true,
"text": "Garage",
"value": "Garage"
},
{
"selected": false,
"text": "SensorPush (Temperature Sensor - Living Room)",
"value": "SensorPush (Temperature Sensor - Living Room)"
},
{
"selected": false,
"text": "SensorPush (Humidity Sensor - Living Room)",
"value": "SensorPush (Humidity Sensor - Living Room)"
}
],
"query": "Ceiling,Ceiling 2,Courtyard,Kitchen / Dining,Master Bedroom, Study,Third Bedroom,Front Balcony,Garage,SensorPush (Temperature Sensor - Living Room),SensorPush (Humidity Sensor - Living Room)",
"queryValue": "",
"skipUrlSync": false,
"type": "custom"
}
]
},
"time": {
"from": "now-1h",
"to": "now"
},
"timepicker": {
"refresh_intervals": [
"10s",
"30s",
"1m",
"5m",
"15m",
"30m",
"1h",
"2h",
"1d"
],
"time_options": [
"5m",
"15m",
"1h",
"6h",
"12h",
"24h",
"2d",
"7d",
"30d"
]
},
"timezone": "browser",
"title": "Hubitat Climate Charts Guages",
"uid": "Rfj4fmkgk",
"version": 41
}

