uptime should be updated by every poll queue, firmwareVersionString is updated with the base data, so it can be updated during a poll, at hub restart, or by either the Refresh, Configure or Initialize command.
1 Like
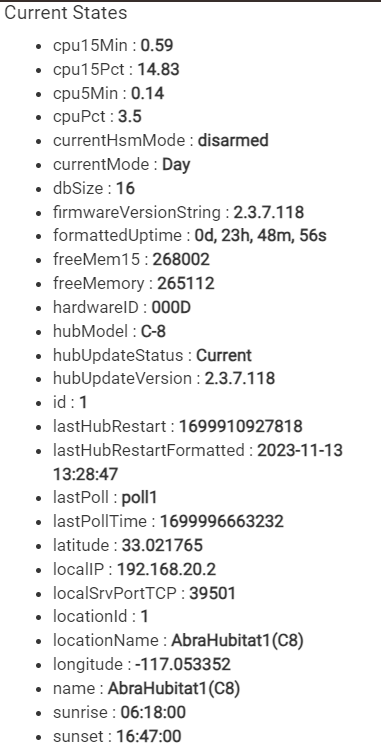
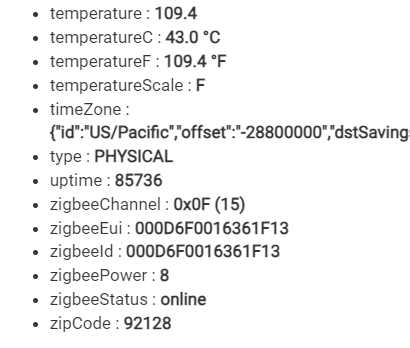
Thanks for your time on this...details below.
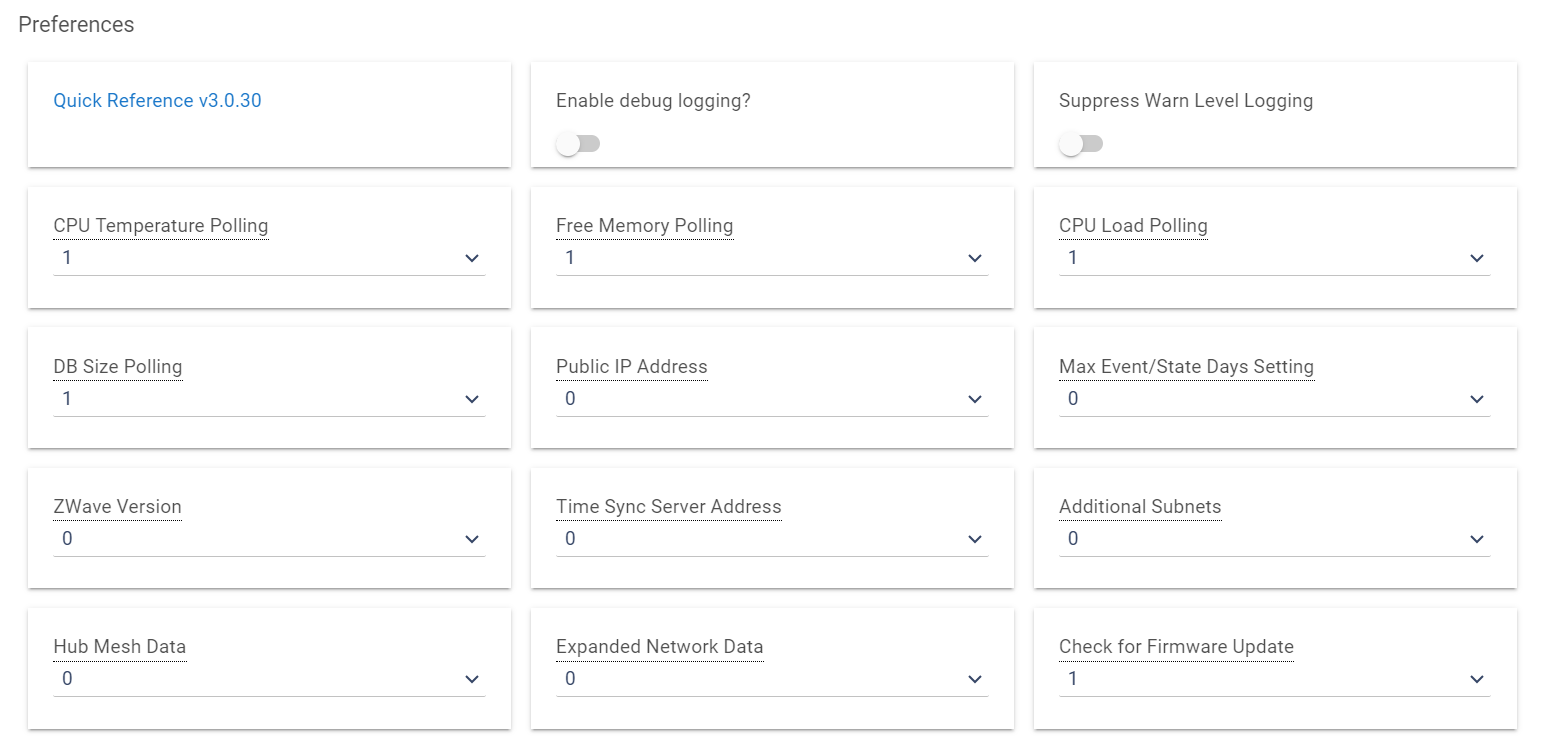
If every item is set to '0', won't uptime just update on startup/shutdown?
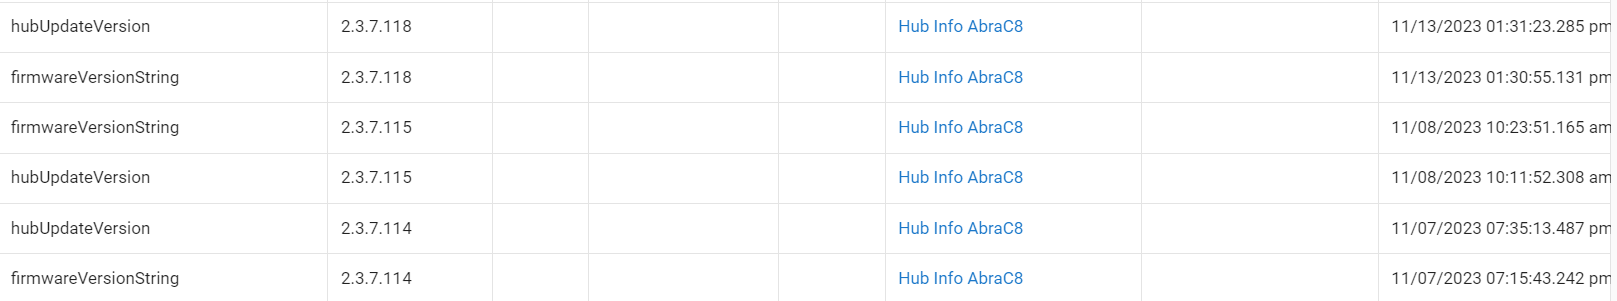
Thanks for the info. Just tested and I'm not getting the firmware info in Events on a Refresh...just ran a refresh but the most recent FW event is from yesterday:
Did you somehow change the firmware value without rebooting, i.e. if the value doesn't change you don't get an event.
By default, an event will only be recorded in the device if the value changes.
If you want to post everything, even if the value does not change, you can force that by unchecking the box in InfluxDB Logger entitled "Only post device events to InfluxDB when the data value changes"
Regardless of that, I would expect to the uptime to change constantly, so it should be posted with each polling interval. What do you see in the logs for InfluxDB Logger?
I don't think I could do that, the only way I know to change the FW value is to do a FW update...which always includes a re-boot.
Just checking, I've learned to never make the assumption that you couldn't do something if you set your mind to it. ![]()
3 Likes
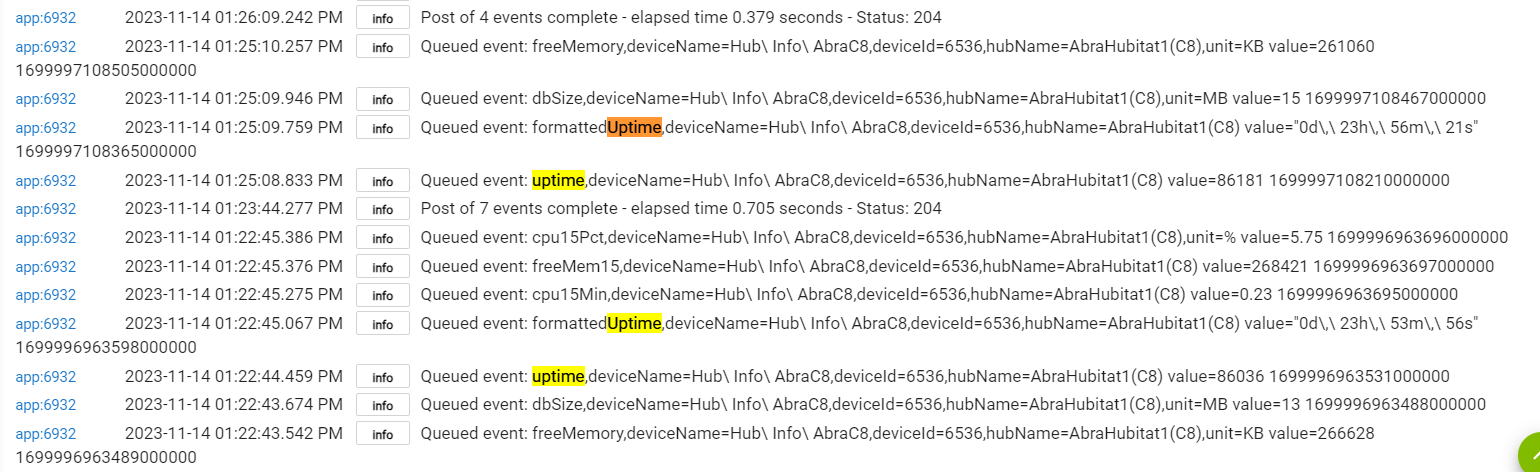
See uptime highlighted below:
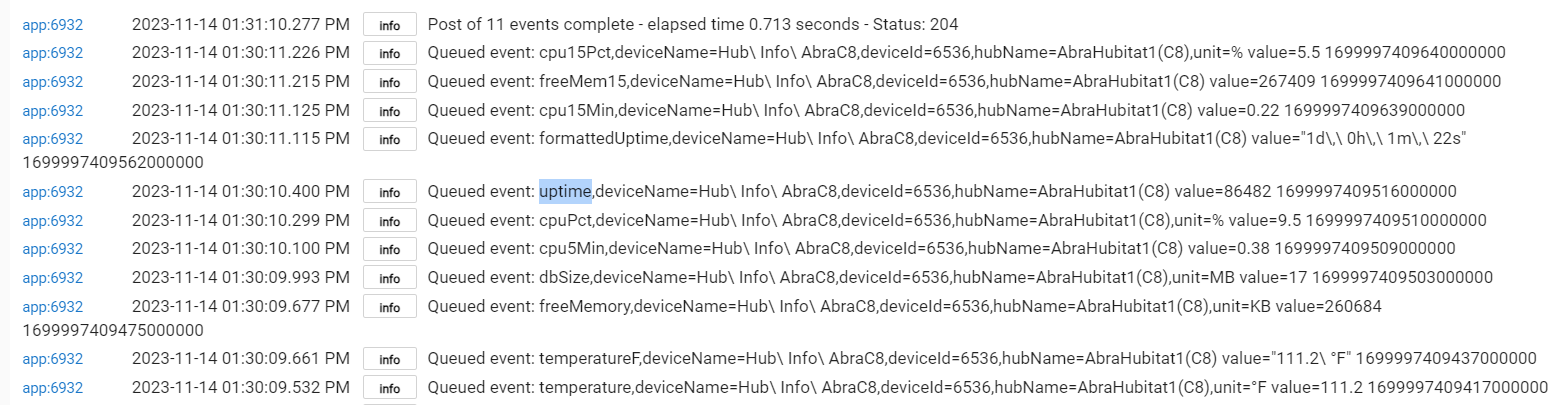
It's been queued and posted repeatedly.
I'll try changing the option to enable posting static values.
I changed the setting and saved, Refreshed Hub Info, refreshed and reloaded the dashboard and the Uptime and FW version still aren't showing on the dashboard. I tried it in Firefox just in case (I'm using Chrome) and same result, so not a browser cache issue.
Frankly, I feel guilty about wasting your guys time with this, since the actual interesting data (CPU, memory, etc.) is posting and I can easily see current uptime on the Hub Info device page.
With regard to the uptime data, it appears clear that the data is being successfully posted to InfluxDB.
I haven't looked at the dashboard you are using, but the reason that you aren't seeing uptime in the dashboard should be an issue associated with the Grafana query rather than the data not being in InfluxDB.
1 Like
Make sense...it's Jeffs Hub Info Dashboard. I'll take a look at the JSON to see if I can figure out what the dashboard is looking for what the Hub Info device is providing,
[Please ignore this post--it is flat out wrong]

Just occurred to me... we're looking in the wrong place. It's not data from the Hub Information device that the dashboard is looking for.
The dashboard is looking for the information that is natively posted by the InfluxDB Logger. See the checkbox entitled "Post Hub information (IP, firmware, uptime, mode, sunrise/sunset) to InfluxDB" in the InfluxDB Logger app.
1 Like
LOL...no face-palm required, that option has been checked from the beginning:
Which does make this issue more confounding. 
Hmm, actually Jeff explicitly says that he's using the values from Hub Info Driver v3.
Now that I've totally embarrassed myself, I'm going to go hide in a corner. @jtp10181, can you step in and save the day?
1 Like
Not at all, and certainly you're speaking to an expert in that area so I would know if you had. ![]()
Jeff - any wisdom appreciated...looking at the dashboard JSON (which I really know nothing about) I don't see any thing blindingly obvious like a misspelling (e.g., "uptome"). ![]()
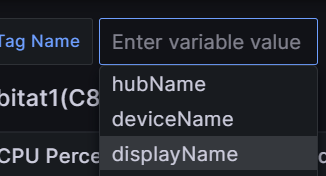
Try changing what is selected in the Tag Name drop down option.
Thanks for the suggestion. That didn't help, unfortunately. Tag was set to hubName, so I tried deviceName and displayName, to no avail.
Would need to see all the settings you have at the top and the time range selected.
Also click the ... on one of the broken charts (top right corner) and select edit, then turn on table view. See if getting any errors in there.

Thanks, Jeff.
OMG... ![]()
![]()
![]()
![]()
At some point, (likely when I selected part of a graph to view?) it appears the time setting was set to:
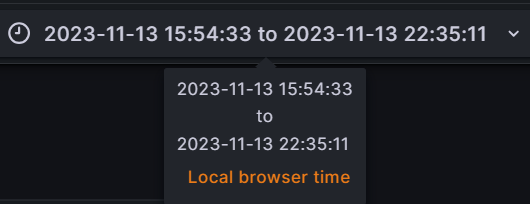
I hadn't even noticed that the dashboard would set a specific time-frame in the header settings when you selected a portion of a graph... (more facepalms...)
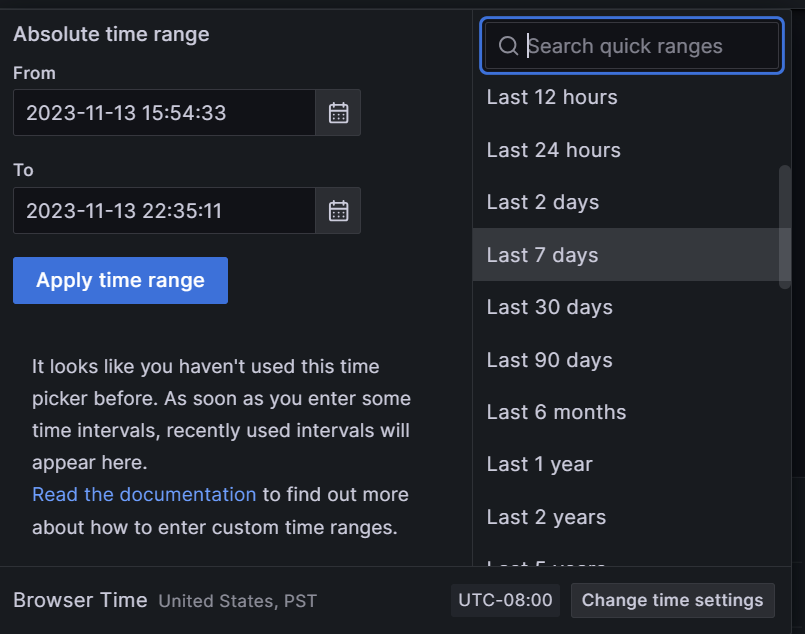
Updated the setting to the last 7 days and the uptime and version filled in.
Apologies to @dennypage for dragging him through my confusion, and thanks, Jeff, for asking the perfect question.

