It was clearly just a trap to lead me into showing how stupid I can be...
![]()
1 Like
Glad it was just the time range, I had a suspicion, and if that was not it I had no clue what was wrong 
1 Like
Jeff - these templates are great, thanks. It looks like the hub performance temperature chart uses as a default all temperature measurements in the bucket. I had to change the filters to get the right data. Adding ' |> filter(fn: (r) => r["deviceName"] == "Hub Information")' to the query also works.
1 Like
Hey, I like these. is this something you could share?
I don't mind sharing, but maybe let me spend some time tidying them up a little first ![]()
2 Likes
I've been wanting to give these a go, but I think I might be bound by Grafana v6.5 on my Pi 3, which uses "armhf" architecture (arm hard float, for 32bit floating point). I believe it may be a 64bit chip but doesn't actually support 64bit software (or something). Try as I might, I can't find an upgrade for 32bit, and these dashboards make use of a bunch of the newer features. It looks like Grafana may have distributed 32bit packages up until recently, but have ceased (temporarily?) due to some nasty bug. I wonder if there are any unofficial packages out there of a later version.
@jtp10181,
Is it possible to combine some of the dashboard devices?
For example, I wanted my light switches and motion sensors to be displayed on the same dashboard.
Thanks
I'd suggest you just do the cloud setup. If all you're using this for is to monitor some of your HE stats I don't think it really warrants the extra work and effort of doing it on a local pi. I did the cloud setups and everything works well zero issues.
![]() I did not know this was a thing. I'll look into this!
I did not know this was a thing. I'll look into this!
*edit: I see, it's a subscription. Question is whether it will use up the limits in the free version. (10k metrics, 50GB logs, 50GB traces, 50GB profiles)
I think you'd have to poll like the devil to get anywhere near those numbers... ![]()
1 Like
I have a clound instance setup of both influxdb and grafana on the free tiers and have had it running for some time. Atleast for simple stuff it isn't a problem.
Only a 14 day retention for the free plan? Does that mean it only hangs onto the last 14 days of data?
My understanding is that it is 30 days, but yes. It means your graphs won't go back further then that.
That is the biggest drawback as i see it in that if you wanted to keep data for months or even a year it may be hard to use that plan. Most people though will want to be able to look at current data and not go back that far. I do go back further on occasion, but not frequently.
Here is my dashboard on my Grafana cloud instance which is accessing INfluxdb Cloud that has 30 days of data to be graphed. It isn't as nice as using grafana, but it shows the 30 day limit. The graph is set to 90 days to show he limit
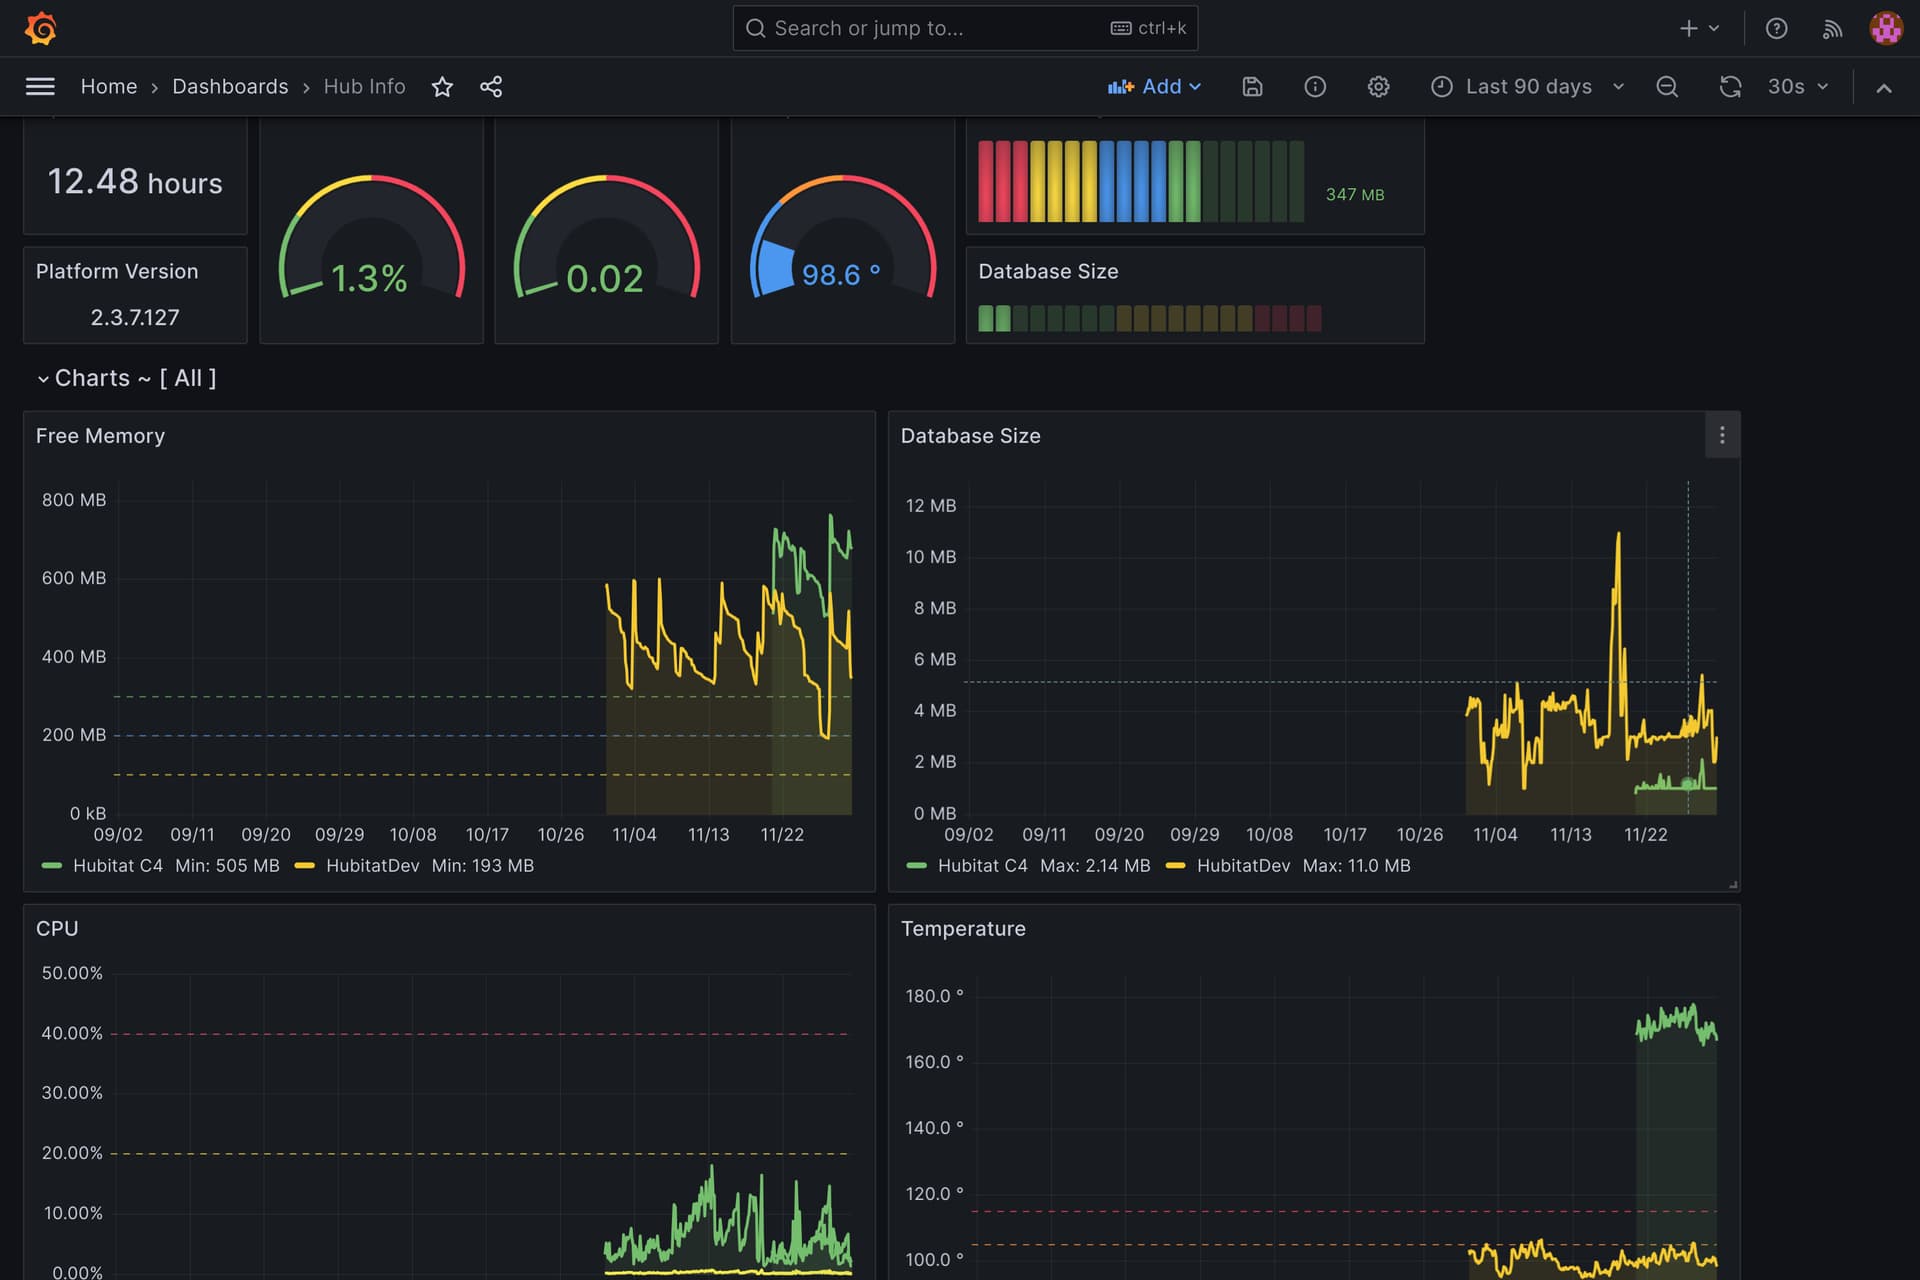
Somewhere along the lines, I changed the auto refrsh to 5 seconds. Probably a bit excessive. what are you guys using?
Ok, maybe I didn't need to tidy it up too much.... ![]() It's a fairly long post, so might compress it up...
It's a fairly long post, so might compress it up...
Setup
Note, I'm using the old version of Grafana / InfluxDB, I baulked at the change in query language that one of them introduced, and haven't bothered to upgrade. InfluxDB and Grafana are running on a rpi4.
It does still have an issue that I never got to the bottom of, the Master Bedroom doesn't display as an actual chart for some reason, in this example, but it only happens randomly and not all the time...
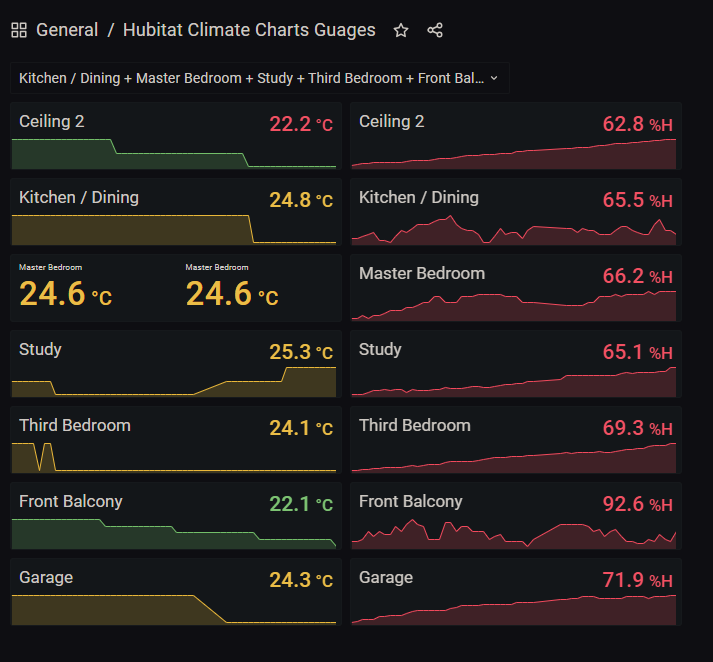
I'm basically using the Stat Panel chart repeated using a variable, which is also used to filter the sensors that are selected.
The variable is setup as a hard-coded list of device names from HE:

The chart is setup using the Stat Panel (I think it may have been a plugin). The query uses the variable in the filtering of the temperature / humidity readings. It also includes the repeat option, using a vertical repeat.

I talk here about embedding these charts in a HE dashboard using Tile Master. I don't use this anymore, but if I do it again I would use one of the more recent iFrame drivers to do this.
Here is the JSON Model if it's useful:
JSON Model
{
"annotations": {
"list": [
{
"$$hashKey": "object:35",
"builtIn": 1,
"datasource": "-- Grafana --",
"enable": true,
"hide": true,
"iconColor": "rgba(0, 211, 255, 1)",
"name": "Annotations & Alerts",
"type": "dashboard"
}
]
},
"editable": true,
"gnetId": null,
"graphTooltip": 0,
"id": 6,
"iteration": 1701458296280,
"links": ,
"panels": [
{
"datasource": null,
"description": "",
"fieldConfig": {
"defaults": {
"color": {
"mode": "thresholds"
},
"decimals": 1,
"displayName": "$Sensor",
"mappings": ,
"thresholds": {
"mode": "absolute",
"steps": [
{
"color": "green",
"value": null
},
{
"color": "#EAB839",
"value": 24
},
{
"color": "red",
"value": 26
}
]
},
"unit": "celsius"
},
"overrides":
},
"gridPos": {
"h": 2,
"w": 6,
"x": 0,
"y": 0
},
"id": 2,
"interval": "",
"links": ,
"options": {
"colorMode": "value",
"graphMode": "area",
"justifyMode": "auto",
"orientation": "auto",
"reduceOptions": {
"calcs": [
"lastNotNull"
],
"fields": "",
"values": false
},
"text": {},
"textMode": "auto"
},
"pluginVersion": "8.0.5",
"repeat": "Sensor",
"repeatDirection": "v",
"targets": [
{
"alias": "$tag_deviceName",
"groupBy": [
{
"params": [
"deviceName"
],
"type": "tag"
}
],
"measurement": "temperature",
"orderByTime": "ASC",
"policy": "default",
"query": "SELECT "value" AS "Temperature" FROM "temperature" WHERE $timeFilter GROUP BY "deviceName"",
"rawQuery": false,
"refId": "A",
"resultFormat": "time_series",
"select": [
[
{
"params": [
"value"
],
"type": "field"
},
{
"params": [
"Temperature"
],
"type": "alias"
}
]
],
"tags": [
{
"key": "deviceName",
"operator": "=~",
"value": "/^$Sensor$/"
},
{
"condition": "AND",
"key": "deviceName",
"operator": "!=",
"value": "Third Bedroom Sliding Door Sensor"
},
{
"condition": "AND",
"key": "deviceName",
"operator": "!=",
"value": "Bathroom Window Sensor on HELIGHTS01"
},
{
"condition": "AND",
"key": "deviceName",
"operator": "!=",
"value": "Garage Door Sensor"
},
{
"condition": "AND",
"key": "deviceName",
"operator": "!=",
"value": "Garage Exterior Door Sensor"
},
{
"condition": "AND",
"key": "deviceName",
"operator": "!=",
"value": "Garage Window Sensor"
},
{
"condition": "AND",
"key": "deviceName",
"operator": "!=",
"value": "Master Bedroom Sliding Door Sensor on HELIGHTS01"
},
{
"condition": "AND",
"key": "deviceName",
"operator": "!=",
"value": "Master Bedroom Window Sensor on HELIGHTS01"
},
{
"condition": "AND",
"key": "deviceName",
"operator": "!=",
"value": "Study Window Sensor on HELIGHTS01"
},
{
"condition": "AND",
"key": "deviceName",
"operator": "!=",
"value": "Third Bedroom Sliding Door Sensor on HELIGHTS01"
},
{
"condition": "AND",
"key": "deviceName",
"operator": "!=",
"value": "Study Button on HELIGHTS01"
},
{
"condition": "AND",
"key": "deviceName",
"operator": "!=",
"value": "Garage Window Sensor on HELIGHTS01"
}
]
}
],
"timeFrom": null,
"timeShift": null,
"type": "stat"
},
{
"datasource": null,
"fieldConfig": {
"defaults": {
"decimals": 1,
"displayName": "$Sensor",
"mappings": [],
"thresholds": {
"mode": "absolute",
"steps": [
{
"color": "green",
"value": null
},
{
"color": "red",
"value": 60
}
]
},
"unit": "humidity"
},
"overrides": []
},
"gridPos": {
"h": 2,
"w": 6,
"x": 6,
"y": 0
},
"id": 3,
"interval": "",
"links": [],
"options": {
"colorMode": "value",
"graphMode": "area",
"justifyMode": "auto",
"orientation": "horizontal",
"reduceOptions": {
"calcs": [
"lastNotNull"
],
"fields": "",
"values": false
},
"text": {},
"textMode": "auto"
},
"pluginVersion": "8.0.5",
"repeat": "Sensor",
"repeatDirection": "v",
"targets": [
{
"alias": "$tag_deviceName",
"groupBy": [
{
"params": [
"deviceName"
],
"type": "tag"
}
],
"measurement": "humidity",
"orderByTime": "ASC",
"policy": "default",
"query": "SELECT "deviceName", "value" AS "Temperature" FROM "temperature" WHERE ("deviceName" = 'Study Temperature') AND $timeFilter GROUP BY "deviceName"",
"rawQuery": false,
"refId": "A",
"resultFormat": "time_series",
"select": [
[
{
"params": [
"value"
],
"type": "field"
},
{
"params": [
"Temperature"
],
"type": "alias"
}
]
],
"tags": [
{
"key": "deviceName",
"operator": "=~",
"value": "/$Sensor$/"
}
]
}
],
"timeFrom": null,
"timeShift": null,
"type": "stat"
}
],
"refresh": "",
"schemaVersion": 30,
"style": "dark",
"tags": ,
"templating": {
"list": [
{
"allValue": null,
"current": {
"selected": true,
"text": [
"Kitchen / Dining",
"Master Bedroom",
"Study",
"Third Bedroom",
"Front Balcony",
"Garage",
"Ceiling 2"
],
"value": [
"Kitchen / Dining",
"Master Bedroom",
"Study",
"Third Bedroom",
"Front Balcony",
"Garage",
"Ceiling 2"
]
},
"description": null,
"error": null,
"hide": 1,
"includeAll": true,
"label": null,
"multi": true,
"name": "Sensor",
"options": [
{
"selected": false,
"text": "All",
"value": "$__all"
},
{
"selected": false,
"text": "Ceiling",
"value": "Ceiling"
},
{
"selected": true,
"text": "Ceiling 2",
"value": "Ceiling 2"
},
{
"selected": false,
"text": "Courtyard",
"value": "Courtyard"
},
{
"selected": true,
"text": "Kitchen / Dining",
"value": "Kitchen / Dining"
},
{
"selected": true,
"text": "Master Bedroom",
"value": "Master Bedroom"
},
{
"selected": true,
"text": "Study",
"value": "Study"
},
{
"selected": true,
"text": "Third Bedroom",
"value": "Third Bedroom"
},
{
"selected": true,
"text": "Front Balcony",
"value": "Front Balcony"
},
{
"selected": true,
"text": "Garage",
"value": "Garage"
},
{
"selected": false,
"text": "SensorPush (Temperature Sensor - Living Room)",
"value": "SensorPush (Temperature Sensor - Living Room)"
},
{
"selected": false,
"text": "SensorPush (Humidity Sensor - Living Room)",
"value": "SensorPush (Humidity Sensor - Living Room)"
}
],
"query": "Ceiling,Ceiling 2,Courtyard,Kitchen / Dining,Master Bedroom, Study,Third Bedroom,Front Balcony,Garage,SensorPush (Temperature Sensor - Living Room),SensorPush (Humidity Sensor - Living Room)",
"queryValue": "",
"skipUrlSync": false,
"type": "custom"
}
]
},
"time": {
"from": "now-1h",
"to": "now"
},
"timepicker": {
"refresh_intervals": [
"10s",
"30s",
"1m",
"5m",
"15m",
"30m",
"1h",
"2h",
"1d"
],
"time_options": [
"5m",
"15m",
"1h",
"6h",
"12h",
"24h",
"2d",
"7d",
"30d"
]
},
"timezone": "browser",
"title": "Hubitat Climate Charts Guages",
"uid": "Rfj4fmkgk",
"version": 41
}
1 Like
Well since you are on the cloud I wouldn't set it any lower then the smallest interval you will get data. So if you collect everything like me probably around 1 min minimum. It just prevents calls that may count against your rate limits for cloud usage and not collect any data.
I also have a local server so on that one I do it every 30 seconds because i don't really worry about load on it ![]()
1 Like
well at first I did, then i backed some off. havent added back yet. Some how i had it down to 5 seconds. 1 minutes seems a bit more reasonable.
1 Like
Curious, for those who use InfluxDB, do you use a single bucket with a single instance of InfluxDB Logger @ HE? Or are you typically using a single bucket across each of your dashboards?
Just trying to think through the advantages/disadvantages....
I send all my hub stats from all hubs to the same bucket. I dont think there is much reason to put different device types into different buckets.
2 Likes
Forgive me if I missed it, as I remember some discussion but can't find anything. Did anyone put together a dash or even add a graph to the (absolute great, btw) sensors dashboard that tracks power as reported by power monitors and/or outlets with monitoring?

