Single HE bucket for me.
I also do not see much use in different buckets.
However, with regard to different instances of InfluxDB-Logger, there are several reasons that you may wish to do this:
- Separating devices/variables that need keep-alive events (softpoll) from those that don't, or that need different keep-alive times. This is highly recommended.
- Separating devices that need Advanced attribute selection from those that don't.
- Having different batch time and size limits, and different backlog size limits.
Sorry if this goes a bit outside your question. ![]()
1 Like
No, not at all. It's definitely part of what I was thinking about. Based on the input here (thanks everyone), I'm going with one Influx bucket, and multiple InfluxDB Logger instances, using @dennypage's direction above.
1 Like
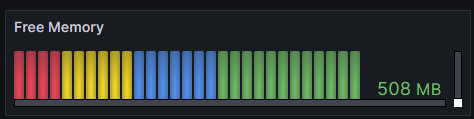
Question, any idea why all of a sudden after week the size of my text is out of whack? I haven't changed anything, changing the zoom or font doesn't change anything at all, any ideas?
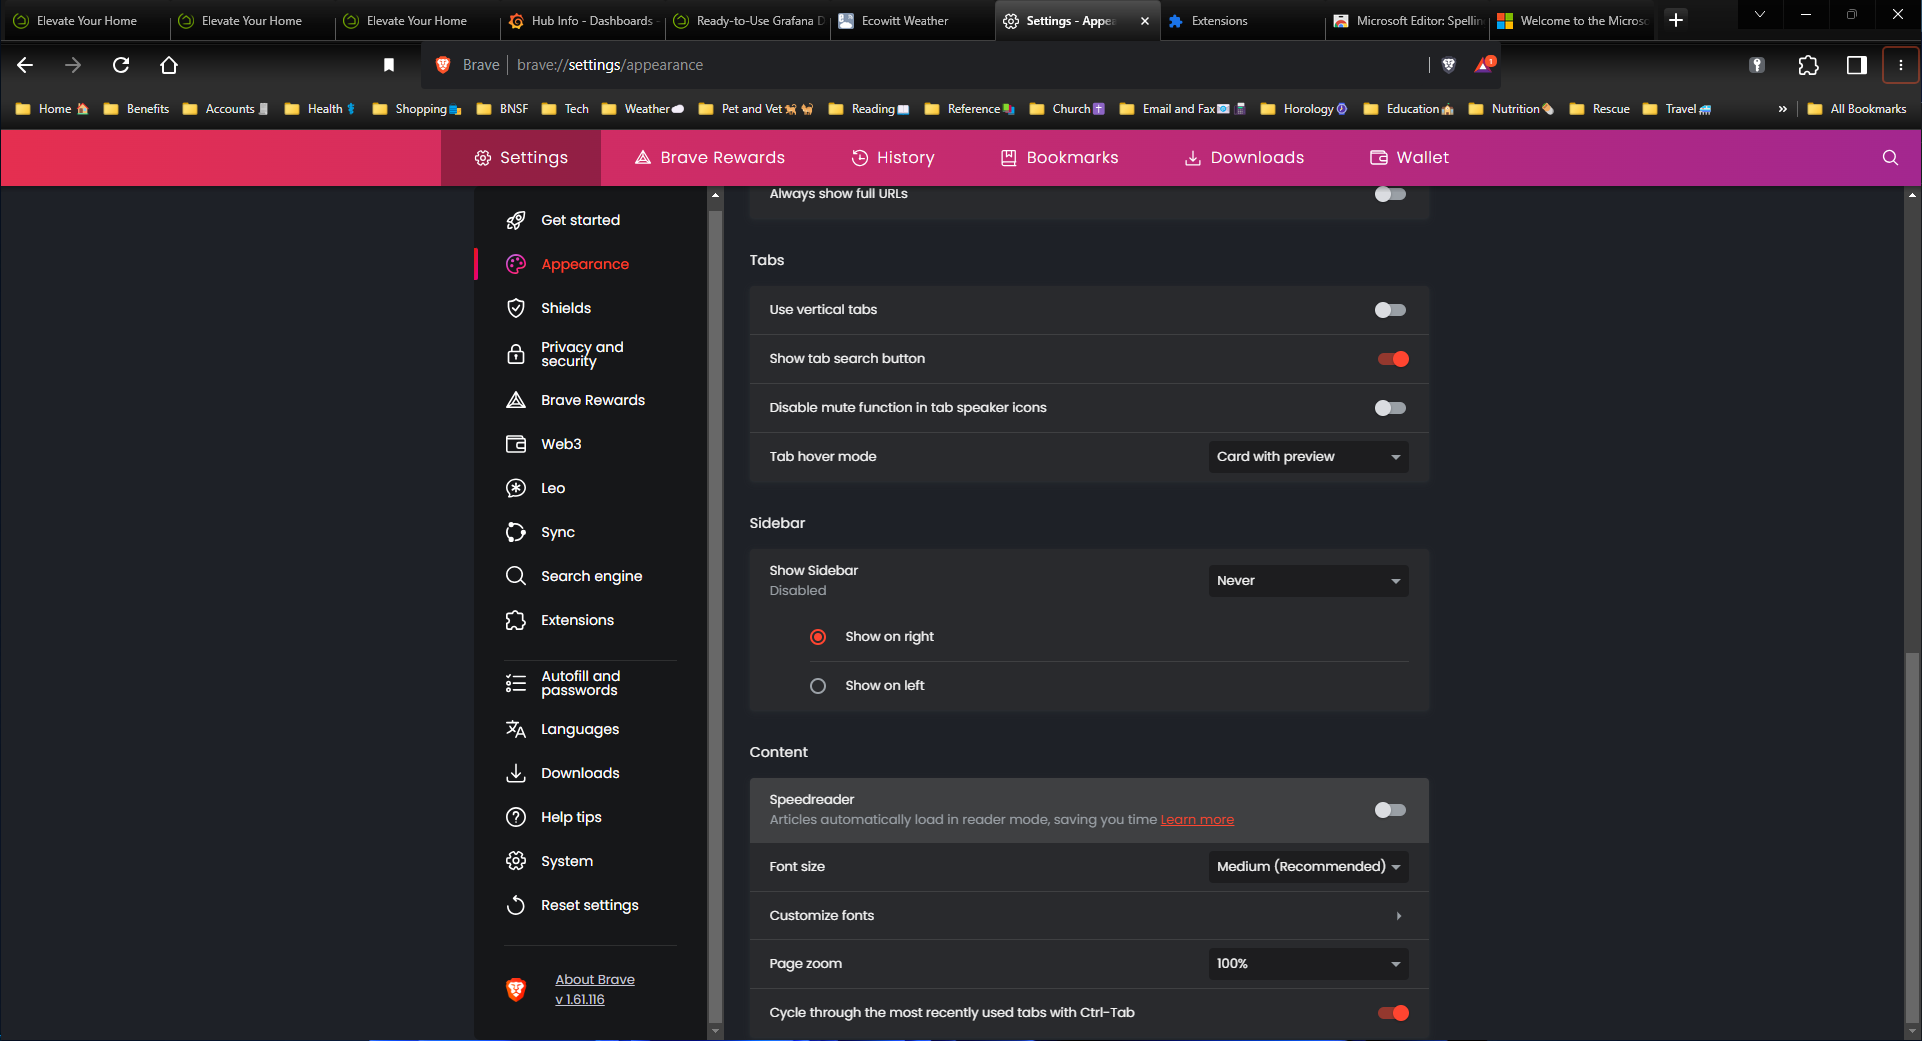
Did you by chance zoom in on the browser on accident? Check the menu on the right (hamburger) and see if there is a zoom option in there.
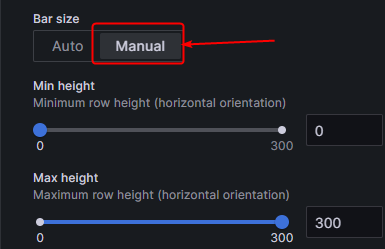
I did notice I was getting odd scroll bars on the bar charts after updating Grafana a few weeks ago, and found the setting to fix it. But it was not effecting everything like you have shown.
Fix is this setting:
1 Like
It’s at 100%. That’s the first thing I thought of. Even if I take below 100% to like 60 or 70% it’s stays the same.
Was looking for the same thing today....
Have you tried another browser?
ewwweeeee..... No, I hadn't I don't like to venture out of Brave too much, it makes me feel, dirty ... I'll try it when I get home...
1 Like
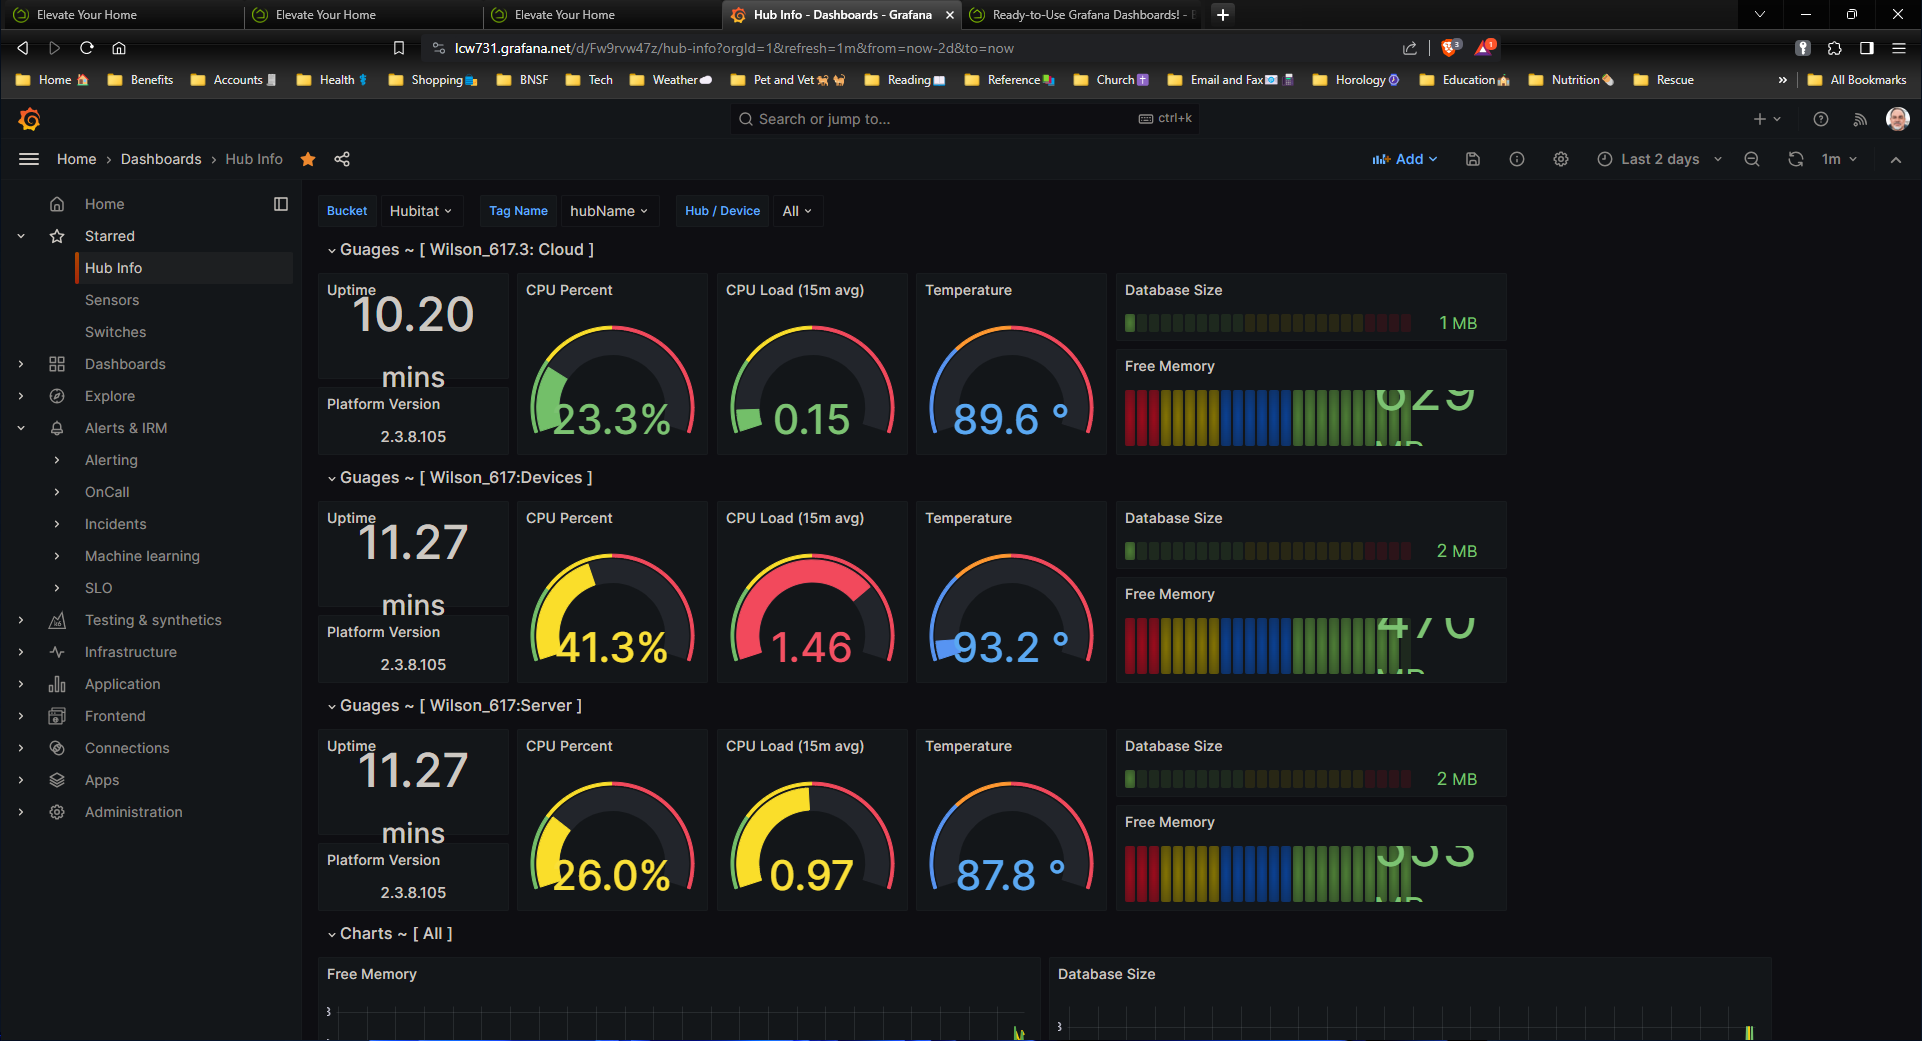
Has anybody done anything with visualizing power use?
I've been a "taker" with a couple of the dashboards shared here, so I'd like to try to build a power dash that I can share back. For me, a good power dashboard would show:
- total current power
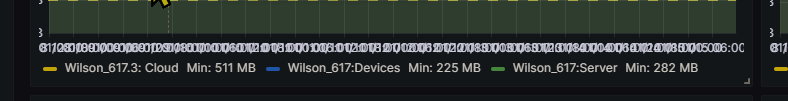
- total power over time
- pie chart of current power by device (the 20% of the devices that driver 80% of the power)
- device power over time for the biggies
- maybe translation of some of the above to $ by assuming a $/kWh.
So I started with the flux query from the Sensors dashboard (see OP). The screenshot below is the Humidity panel, which I thought I'd edit for a few power devices that I've already added to InfluxDB.
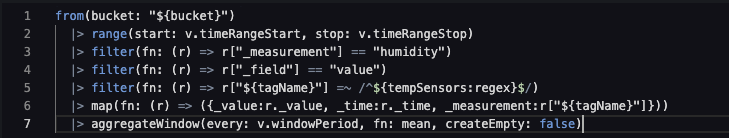
I replaced "humidity" in line 3 with "power", and tempSensors in line 5 with power. Also tried powerSensors and powerMeters, but I get query errors no matter what I try.
Any other Grafana experts see what I'm doing wrong?
The line 3 change is correct, the line 5 is a list of devices, the "tempSensors" is a variable (the selection box at the top of the chart page). You could just remove that line and it would include every device with power attribute data.
1 Like
Well, you are on to something there. Its displaying correctly in Edge. Now how do I figure out why it wasn't in Brave (and more importantly get it back to that state). Zoom on Brave is 100%, font is the recommended Medium.
I can only think you are referring to a Grafana setting? I am wondering if it is somehow font related... Not sure how... Either that, or something to do with text re-sizing by the OS having a different effect between the two browsers... Really not sure tbh...
In Grafana do you have a Text Size setting for the affected panels?
1 Like
I wouldn't even know where to look. However, Went ahead and rebooted and that fixed it. weird.
1 Like
For some reason Hub Info is not being updated/logged. Maybe I am missing something , but I installed the Hub Info Virtual device and enabled polling.
I noticed my hubName is not listed in Grafana either for some reason. All of my sensors/devices are reporting properly in Grafana though, its just the hub Info that does not seem to be logging anything.
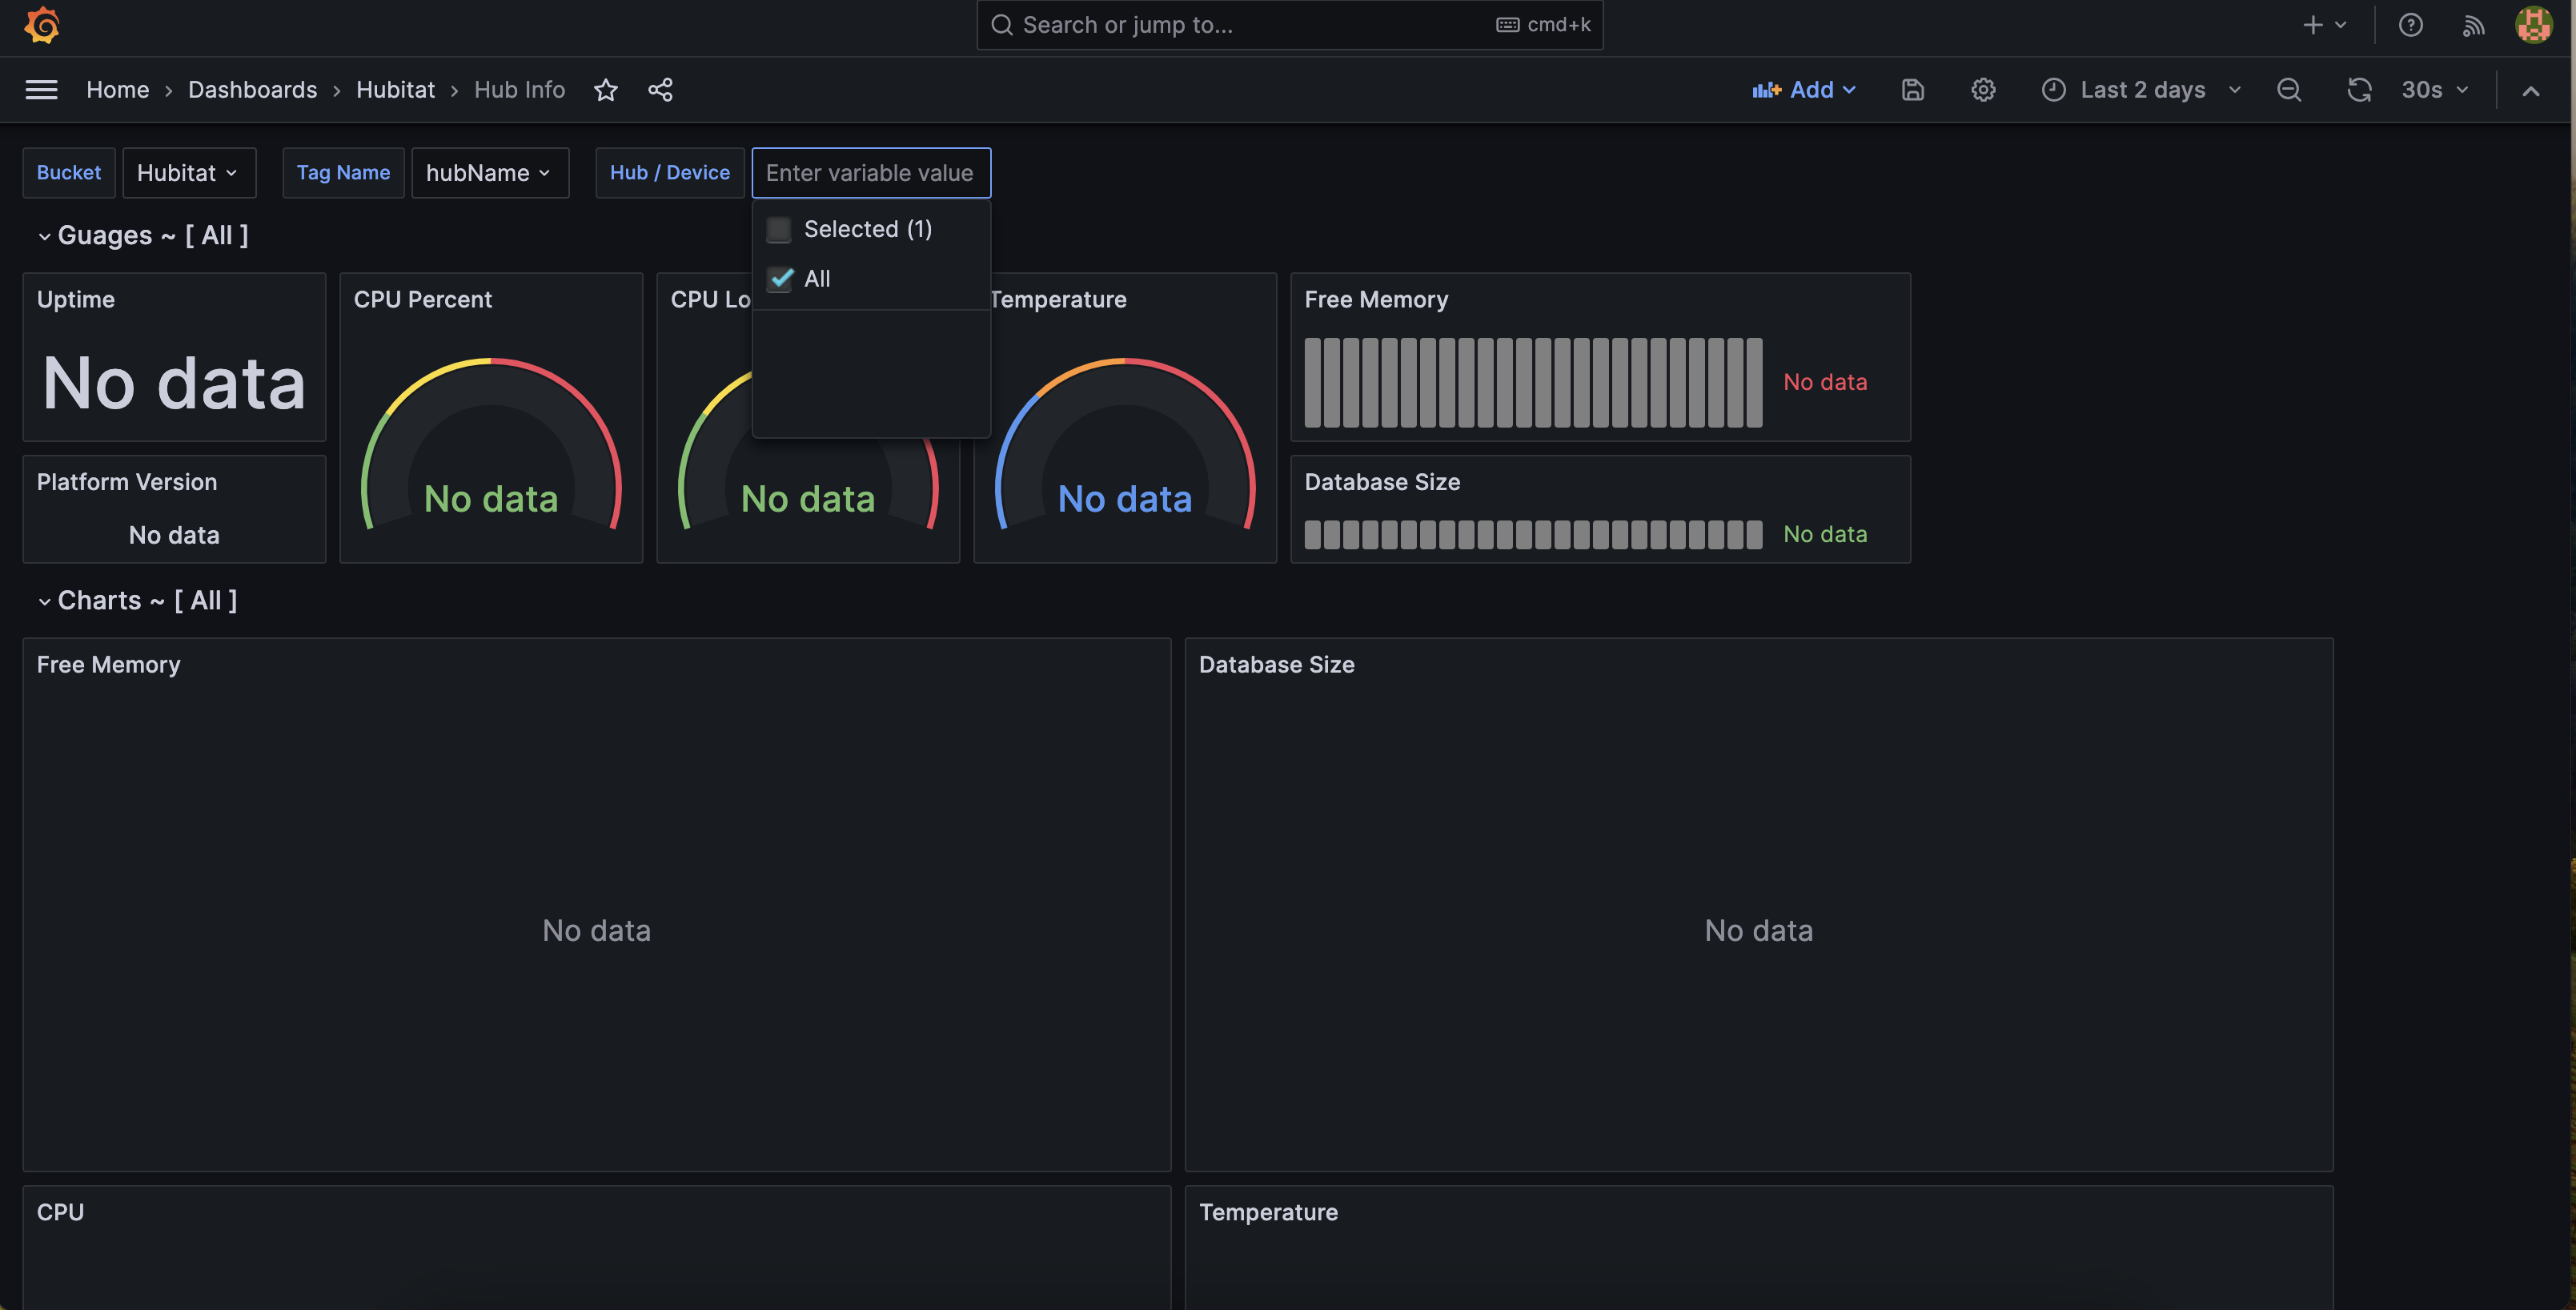
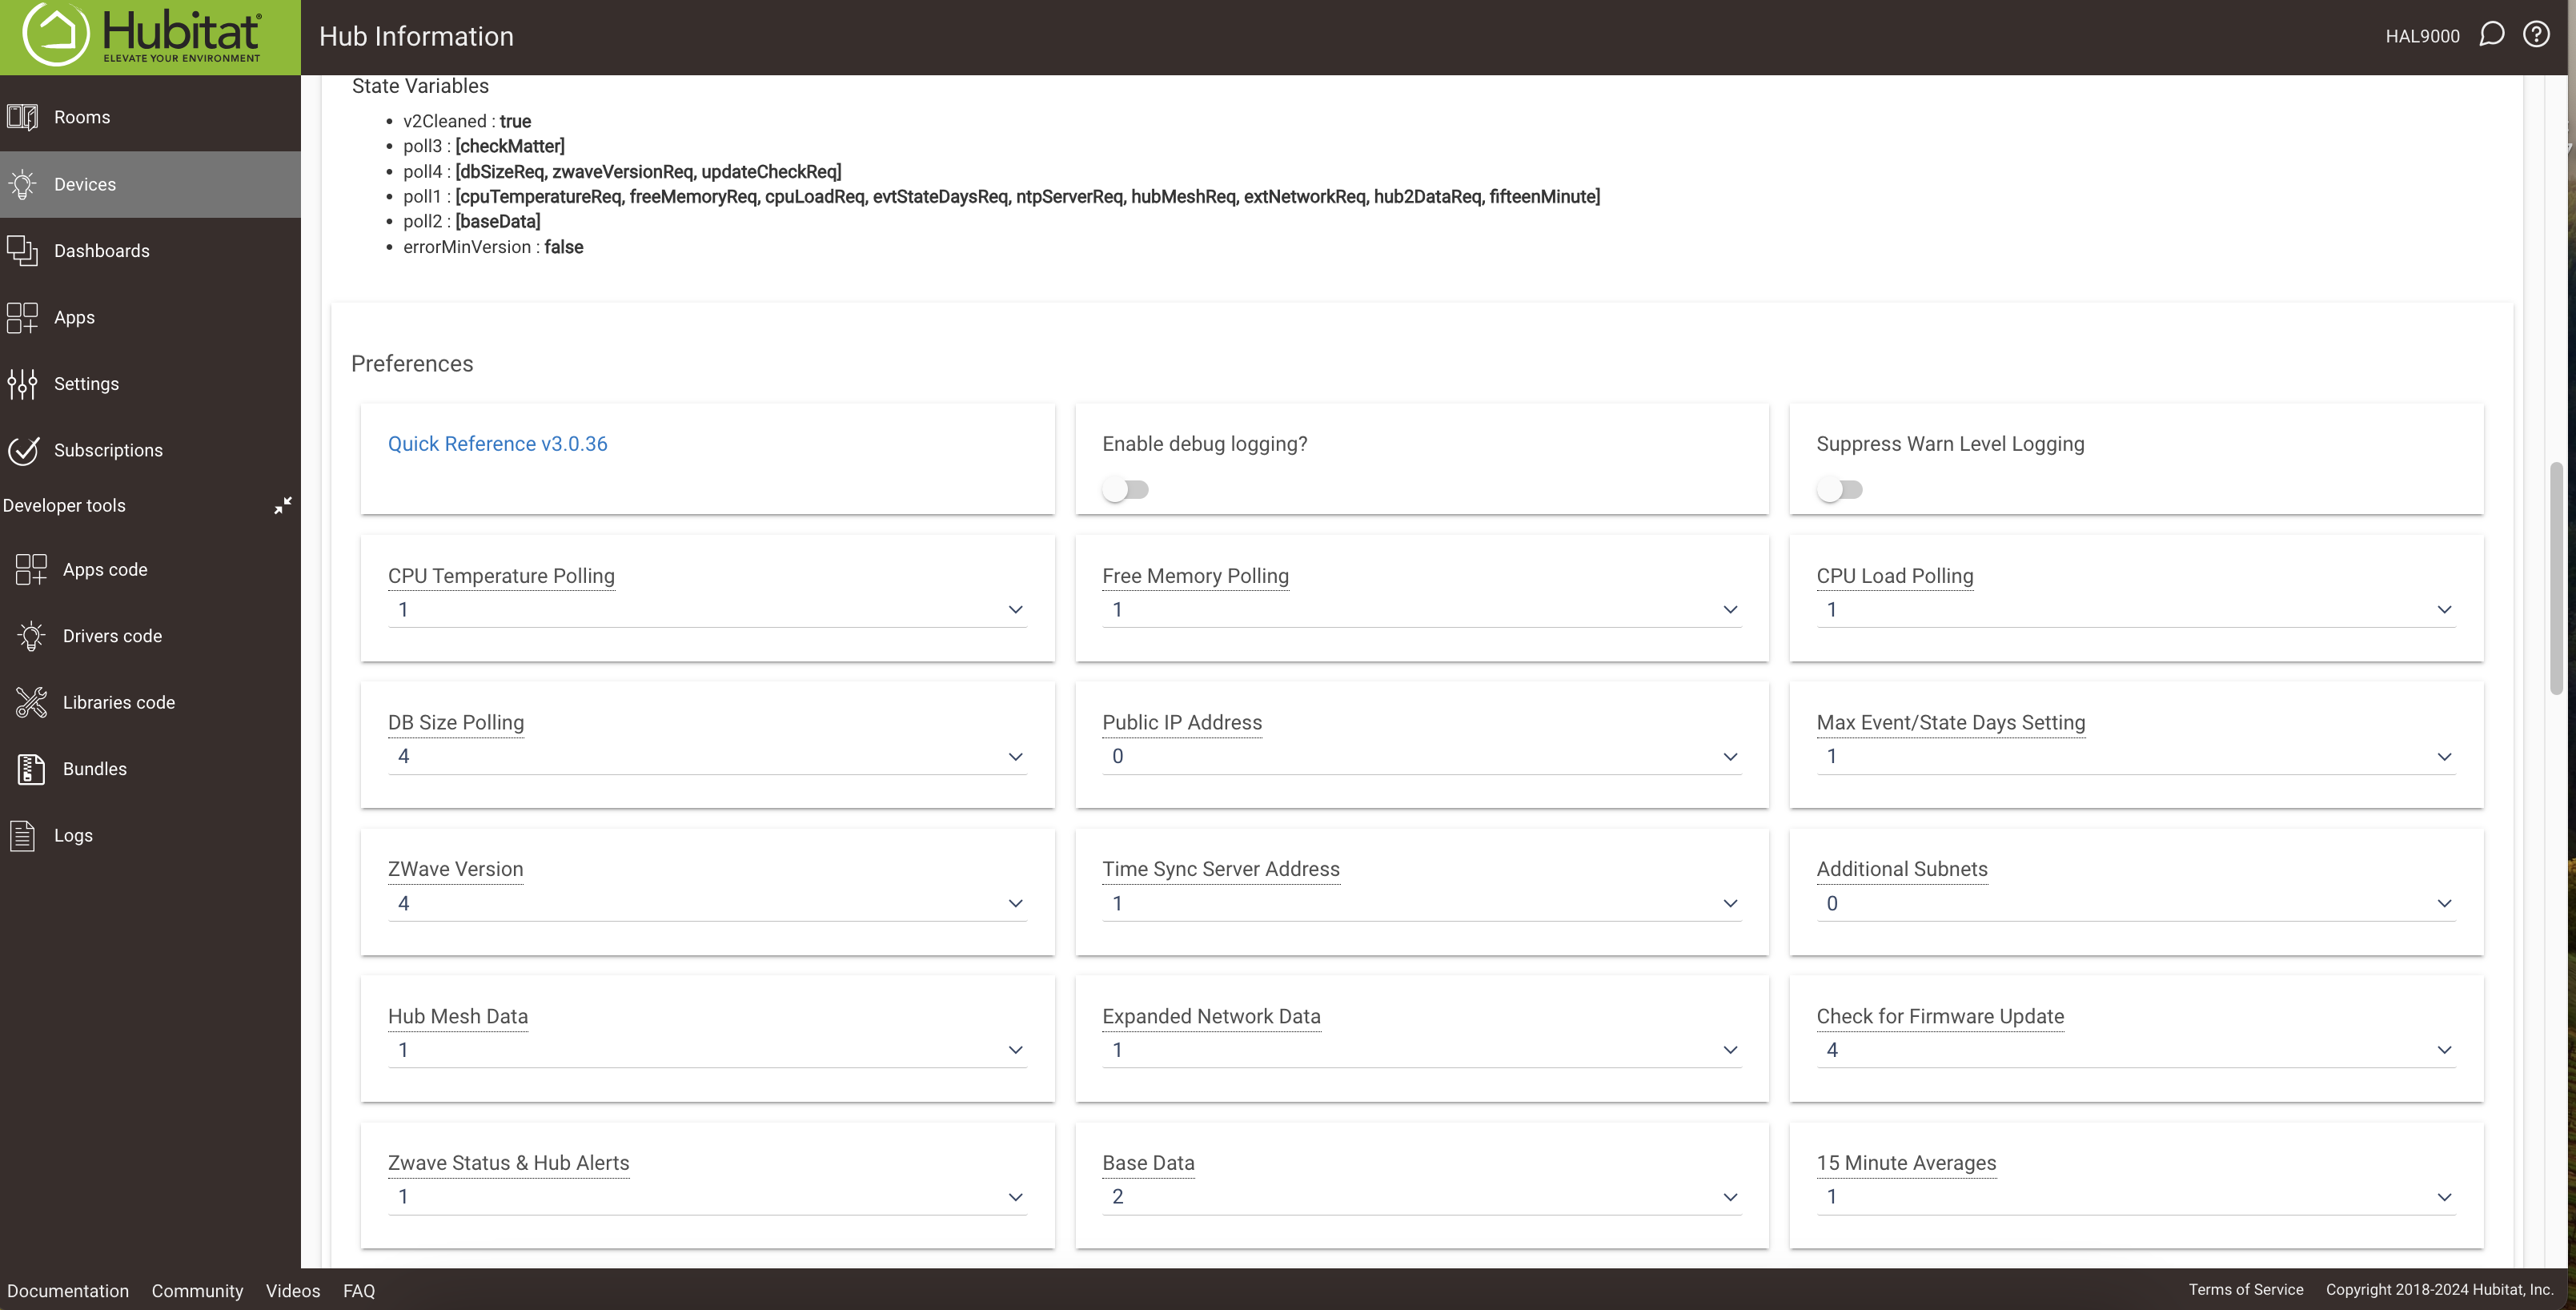
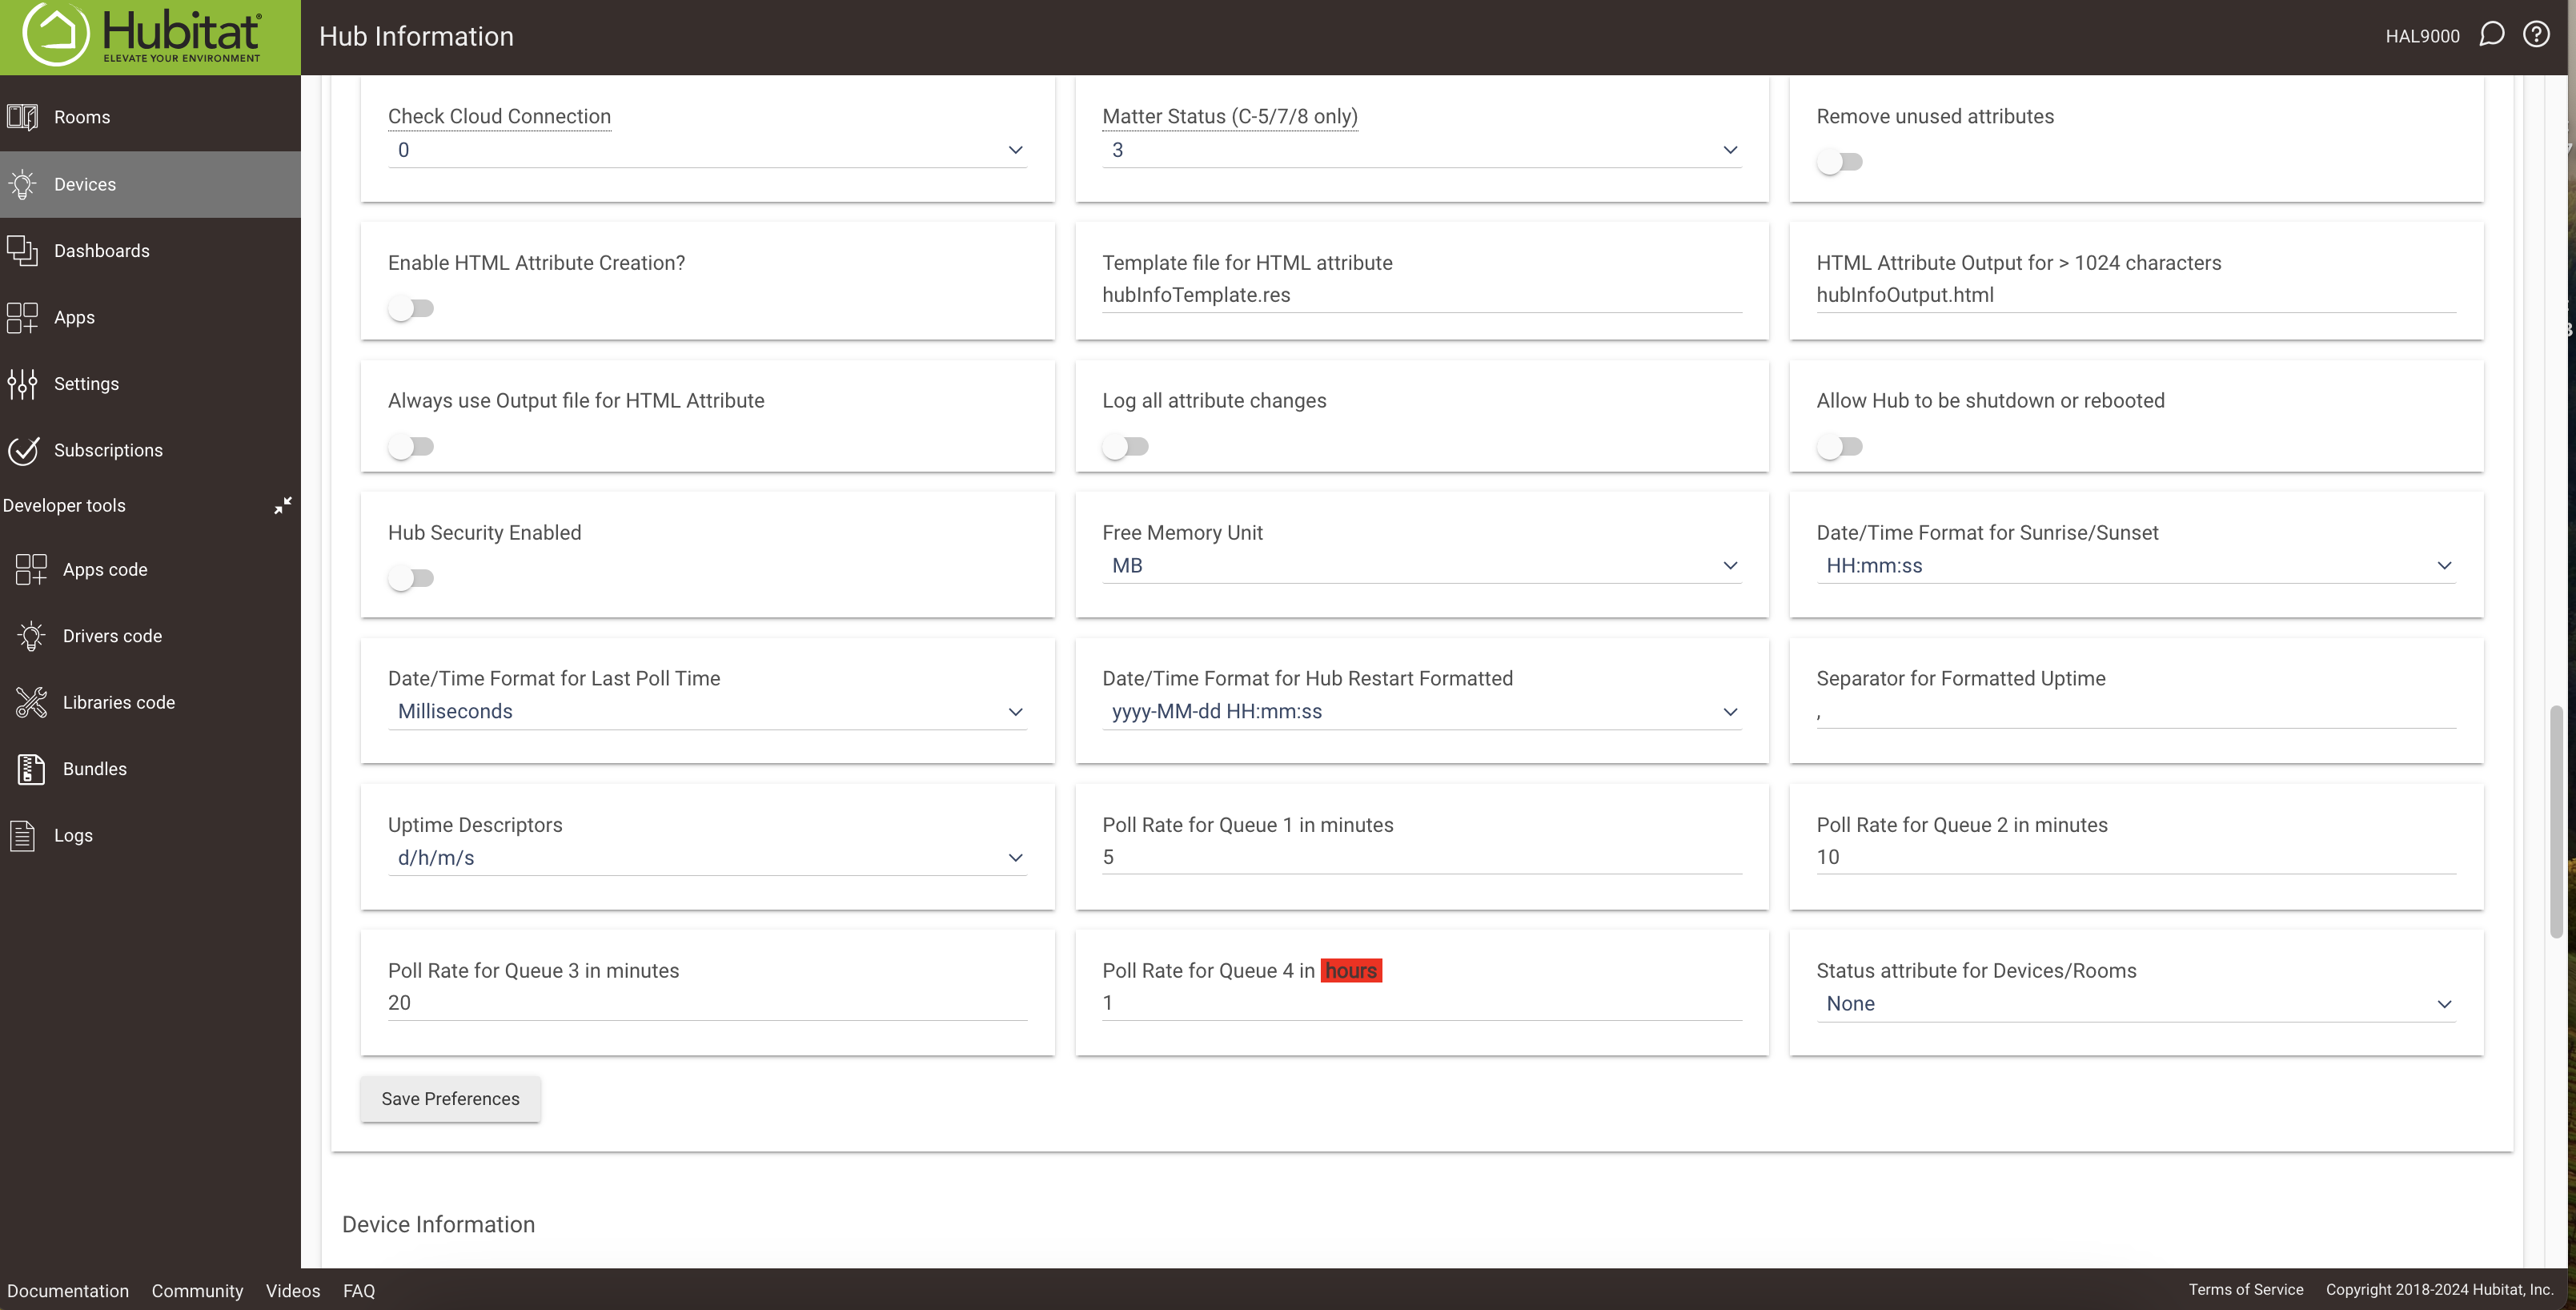
Did you add that Hub Info device to the Influx DB app so it sends the data to Influx?
2 Likes
Ah yeah that was it, figured it was something I missed. Thanks.
@jtp10181 ...I had 2 Grafana/Influx dashboards working fine, hub info and sensors, then I went on vacation for a week. When I returned the Grafana graphs would not load any data. I believe Influx is loading the data...the logs dont show any errors and when I query Influx the data is there. I was running 2.3.9.135. Updated to 2.3.9.147...same thing. I then restored 2.3.9.135 just to be sure.
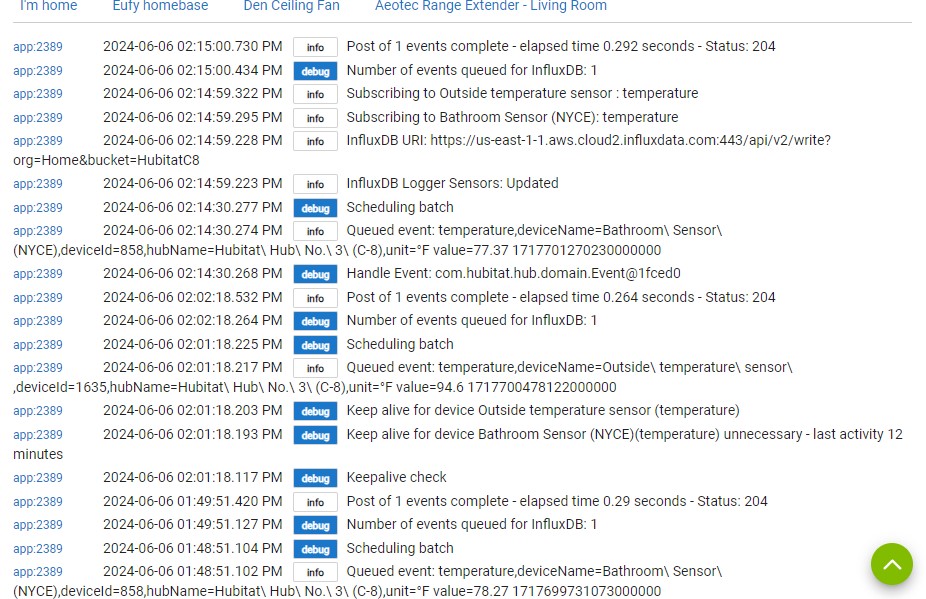
Here are my logs with 2 sensors....
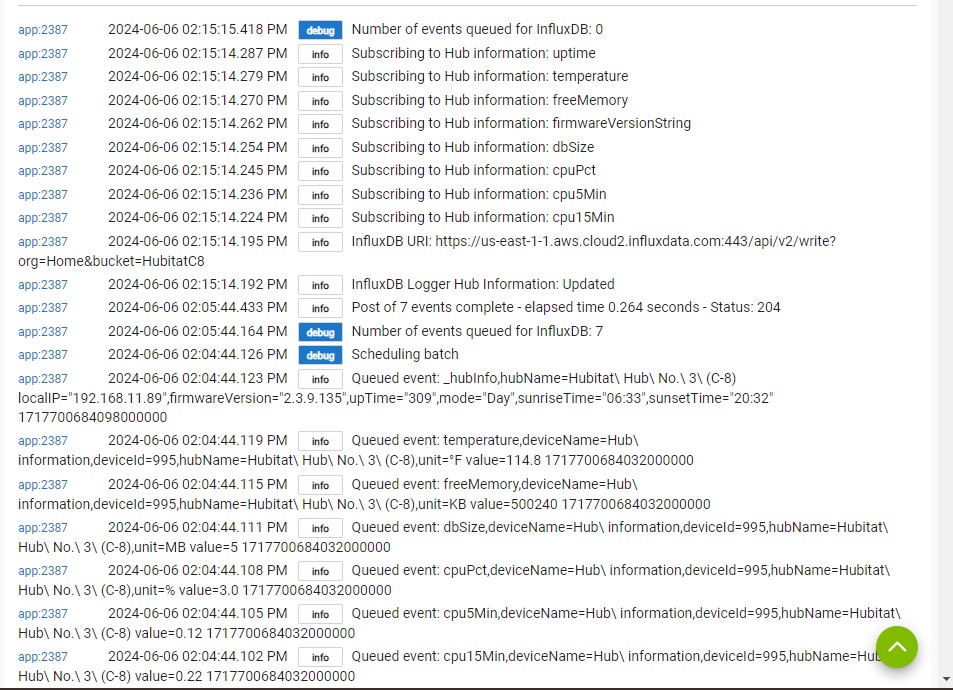
Here are the logs for hub info....
The bucket shows in Influx but I cant get it to show up on Grafana.
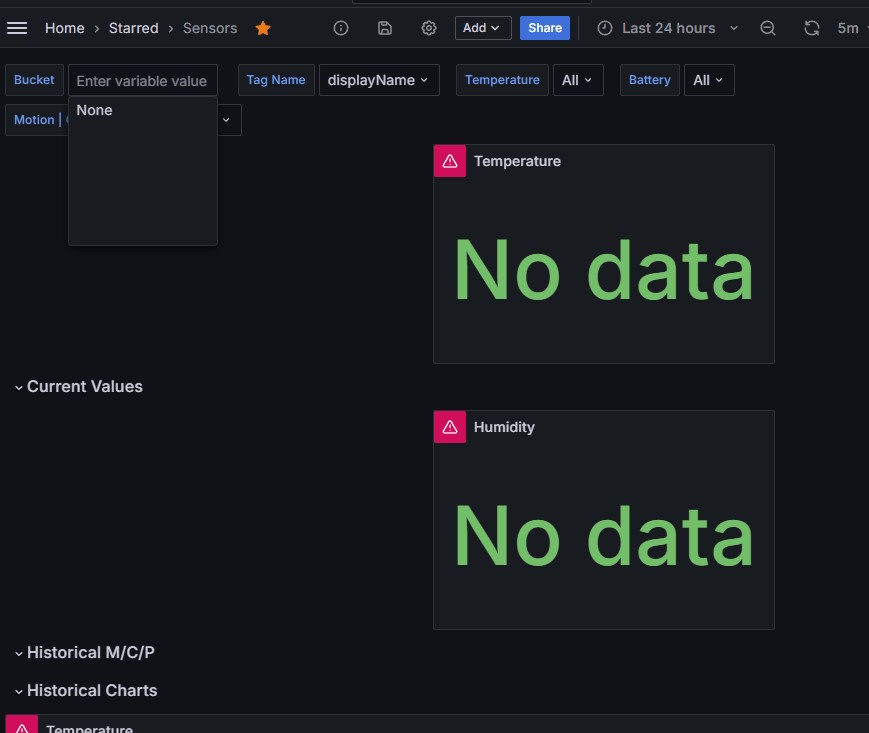

I have tried reloading the dashboards using both Flux and QL...Same thing the bucket does not show up in Grafana. I am using the same bucket for both hub info and sensors. In influx the hub info data shows up in Data Explorer but the 2 sensors do not show up under the bucket measurement.
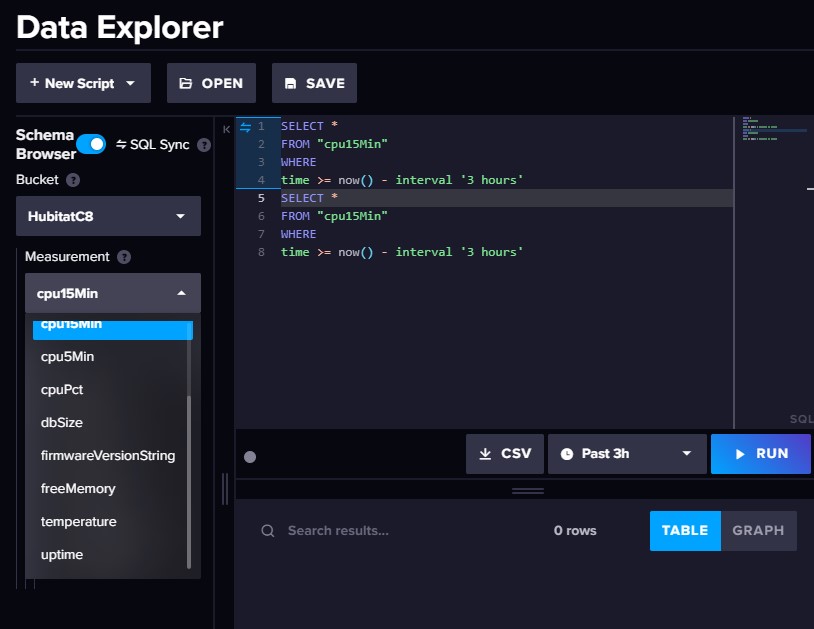
Do you have any ideas I could try? Thanks

