That looks like your Data source in grafana is having issues.
In grafana go to the data source setup and make sure it tests ok.
That looks like your Data source in grafana is having issues.
In grafana go to the data source setup and make sure it tests ok.
My knowledge of Grafana is very limited. Can you give me some guidance on how to do this, or point me in the right direction?
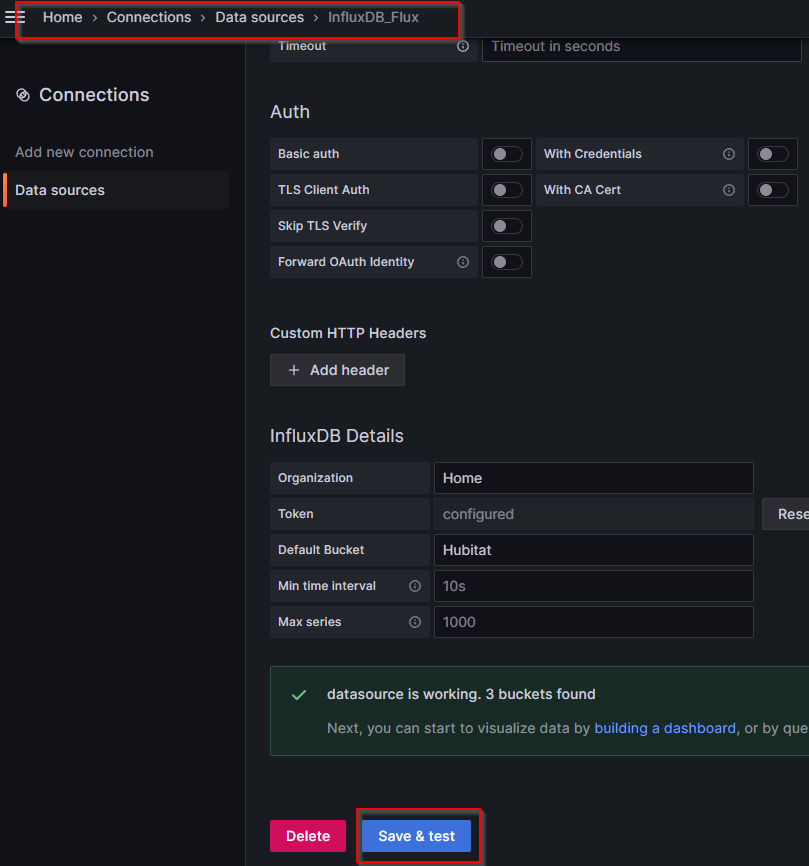
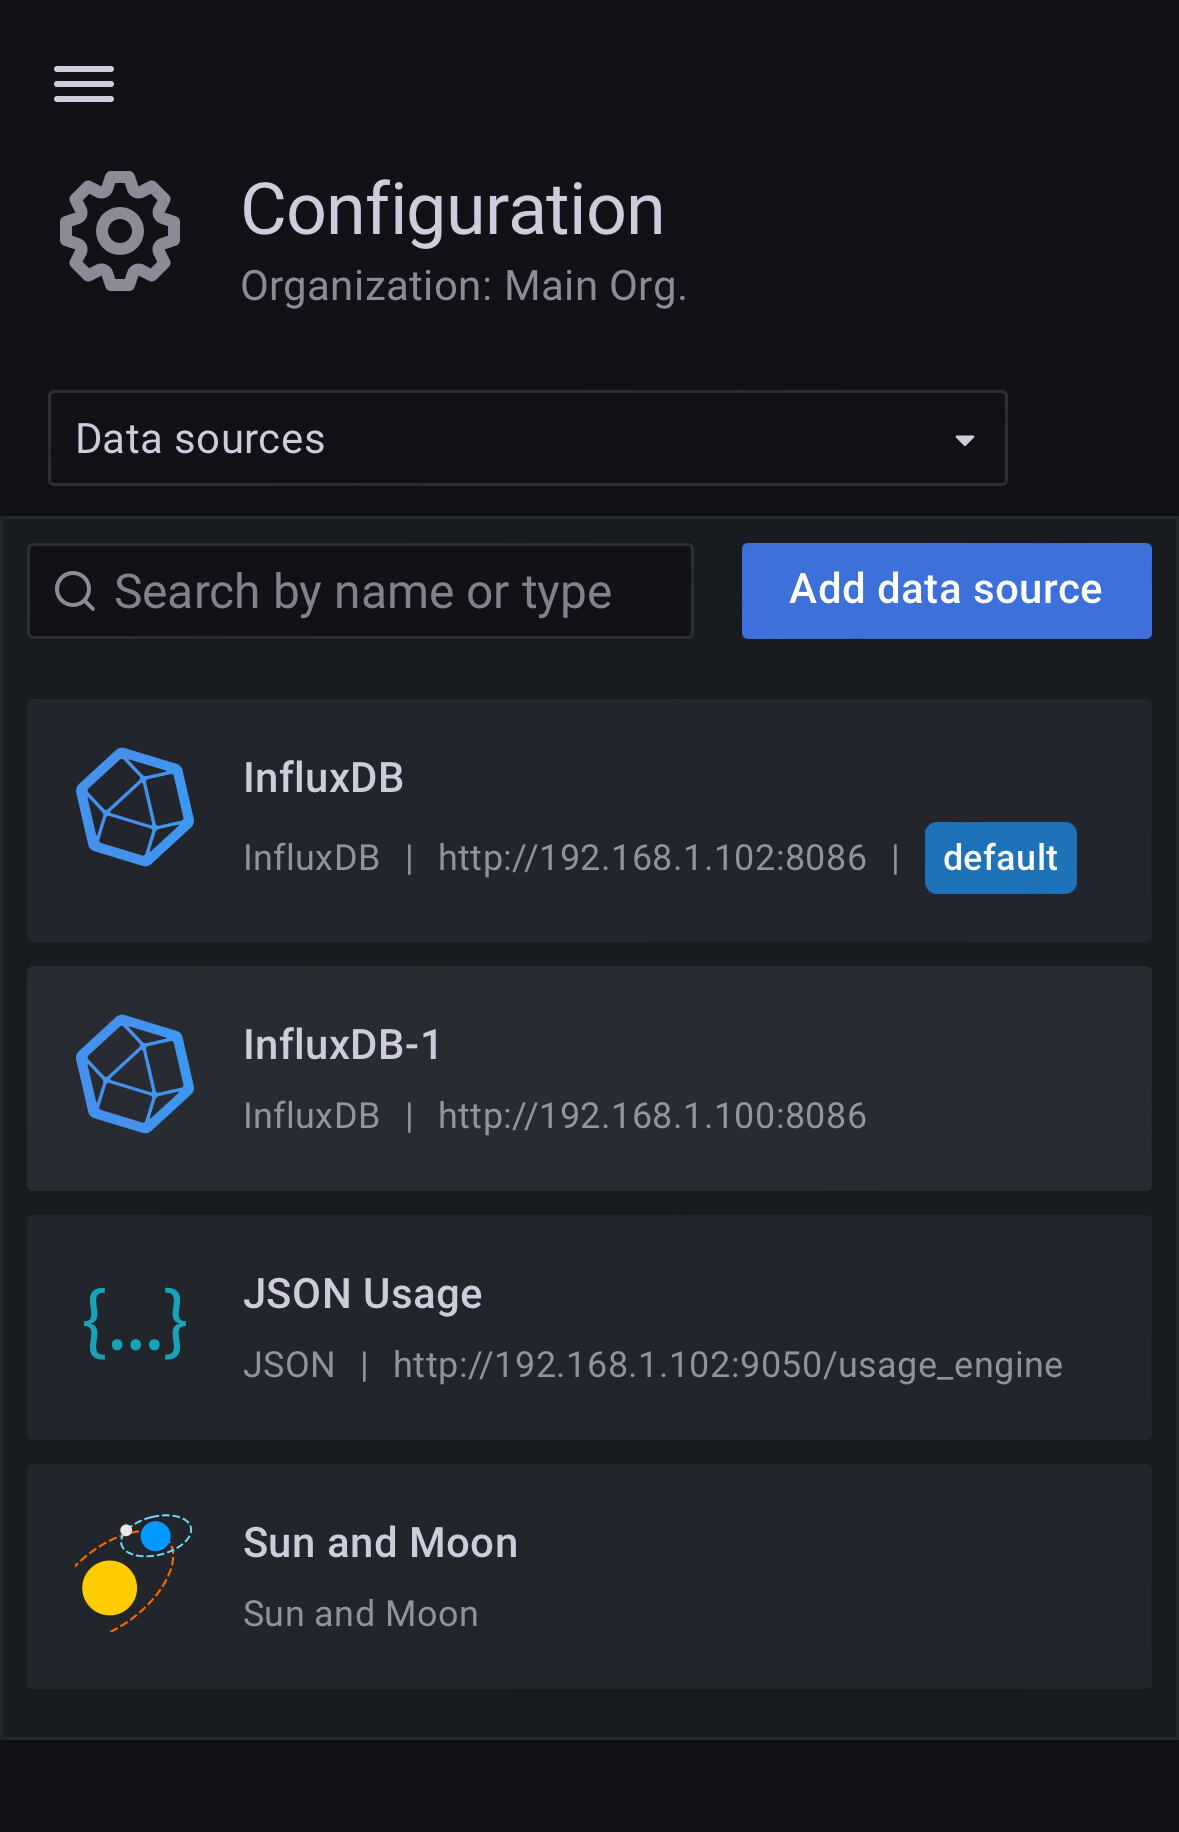
Home->Connections->Data sources->InfluxDB_Flux, go to the bottom of the page and click "Save & Test"
@jtp10181 thank you for making these dashboards, they look great! ![]()
I am seeing a couple of things that arent working correctly - I assume Im doing something wrong.
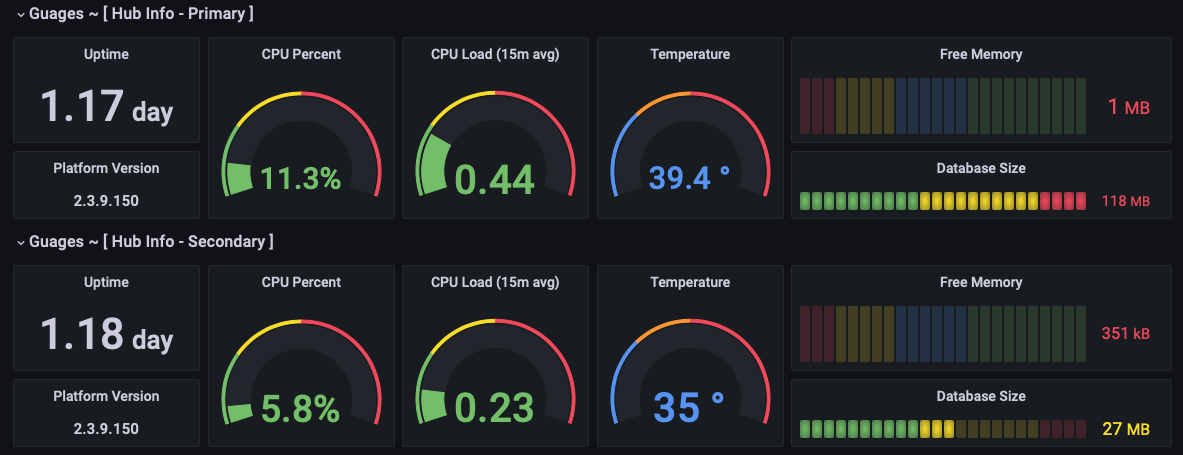
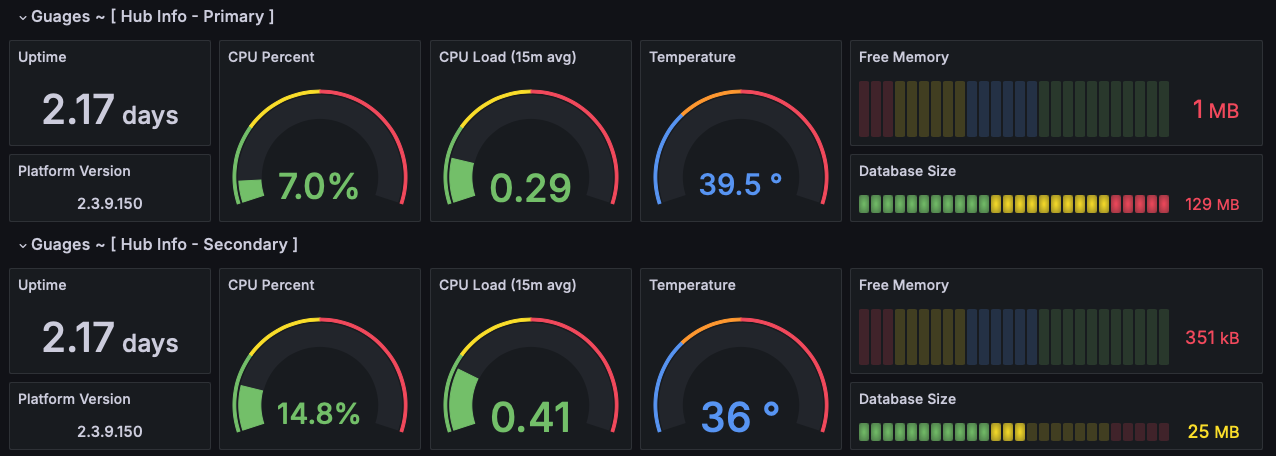
Free Ram for my C8 Pro (Primary Hub) never updates in the "meter" (it's stuck at 1 MB) but works fine in the main graph. I have updated Hub Info to use KB instead of MB, but this didnt help.
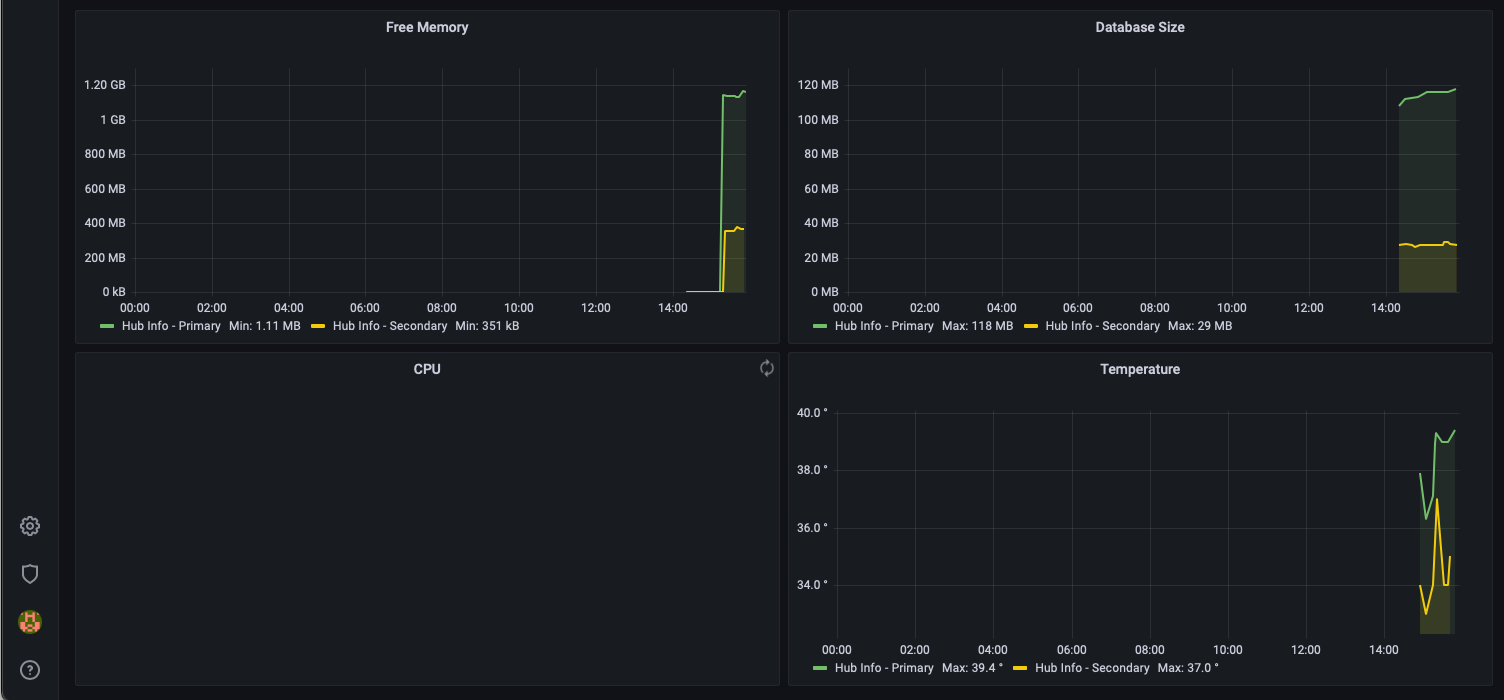
The CPU graph never updates:
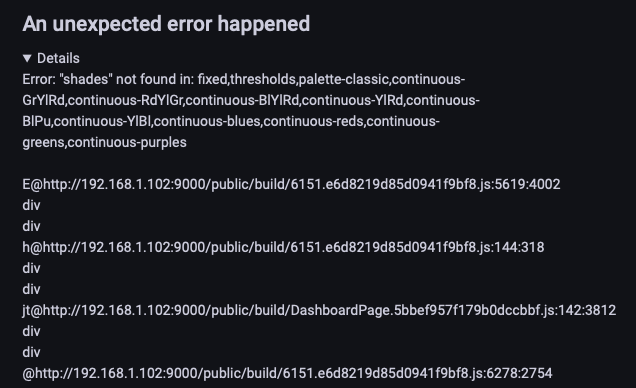
and if I try to edit it, it shows a long list of errors:
Regarding the ram graphs etc, wouldn't it be better to work from MB's instead of KB's? When dealing with 1-2GB of ram, KB doesn't seem to make a lot of sense.
PS, it would also be nice if Degrees Celsius was supported for the 95% of the world who aren't using a system of measurements from the 1600's that was cooked up by a bunch of drunk British nobles.
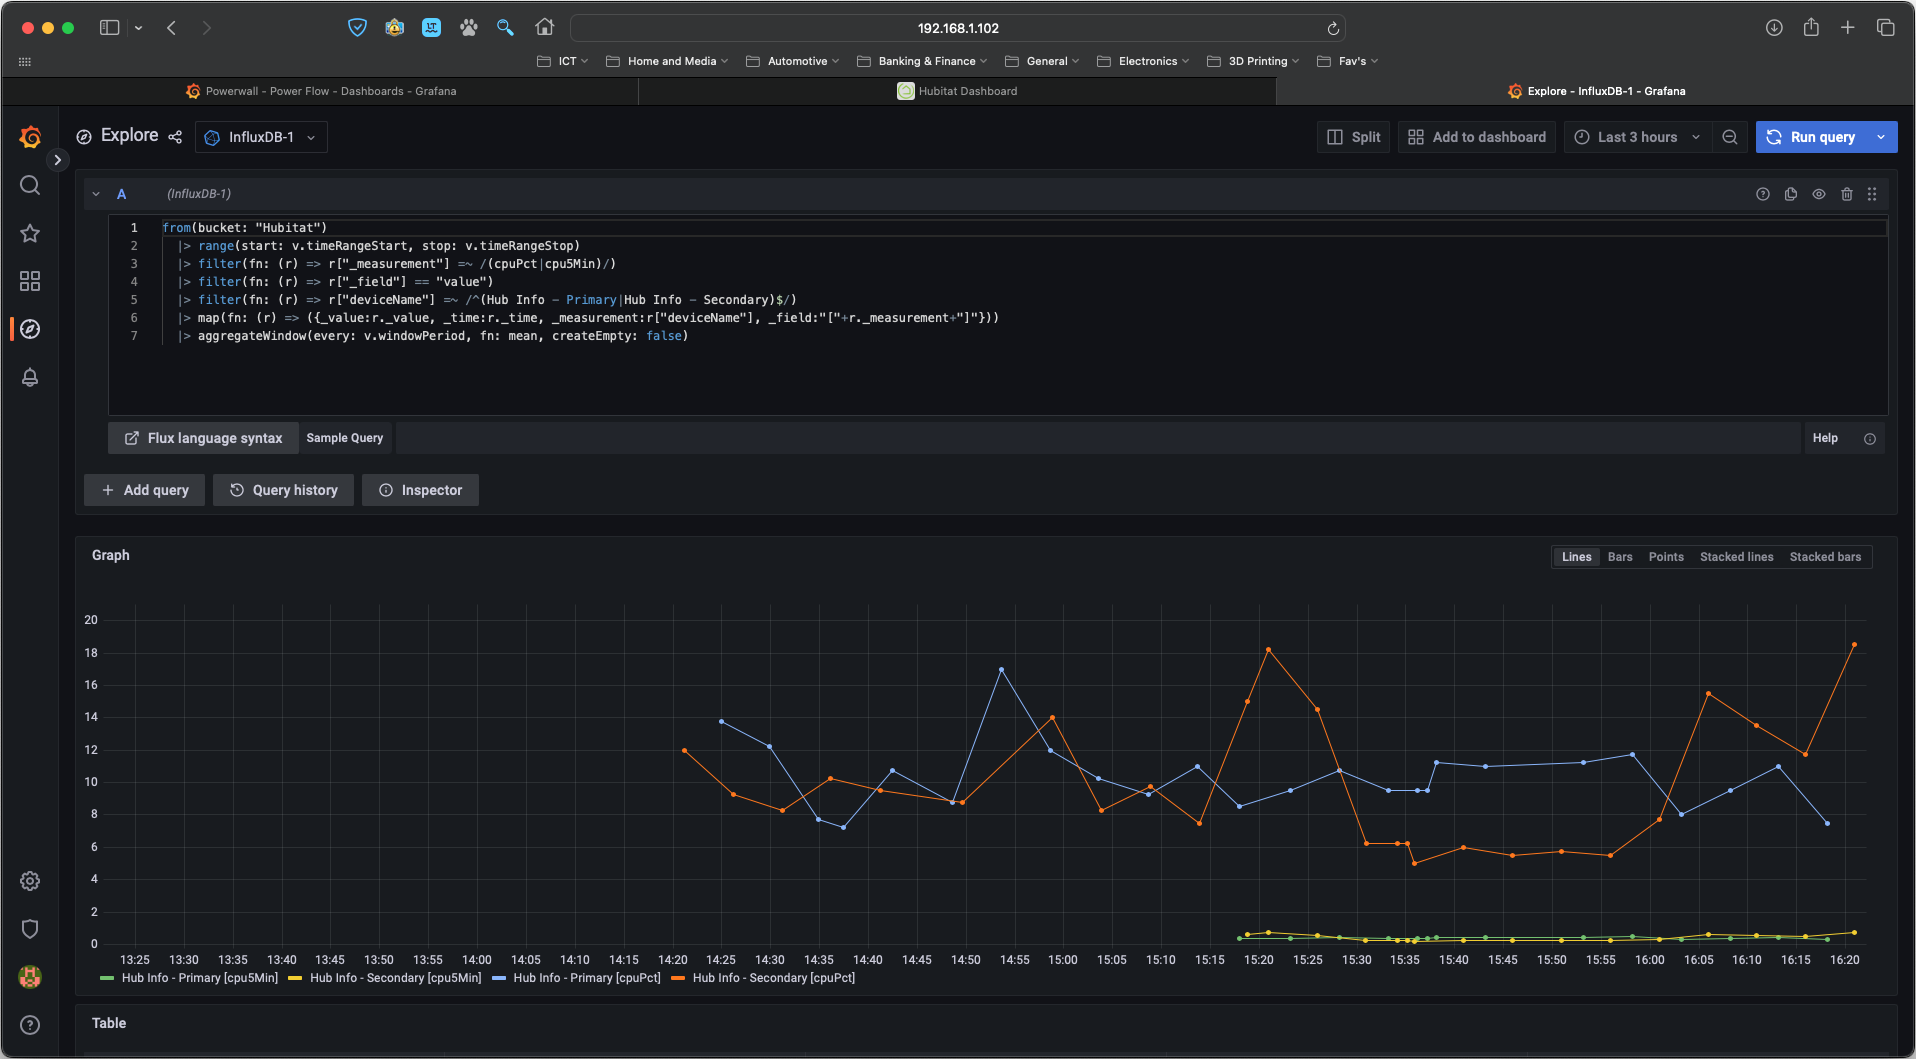
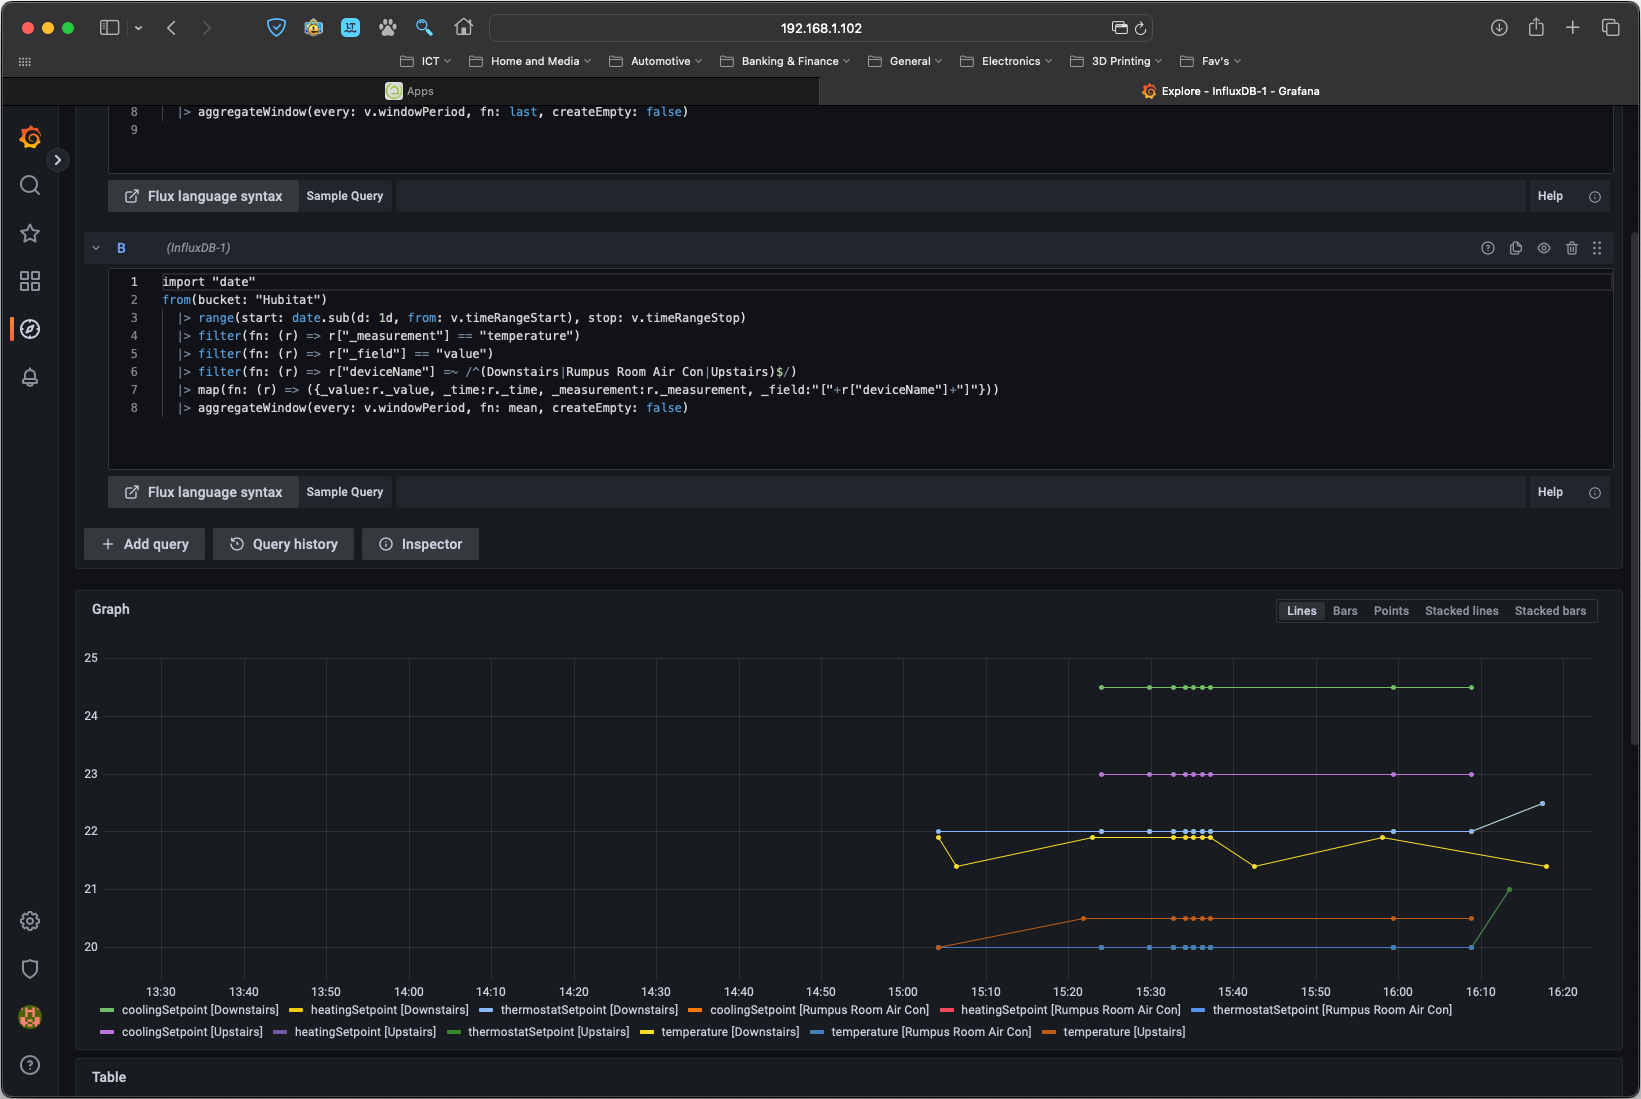
Just a follow-up, this is very odd - If I explore that graph, the data is there. ![]()
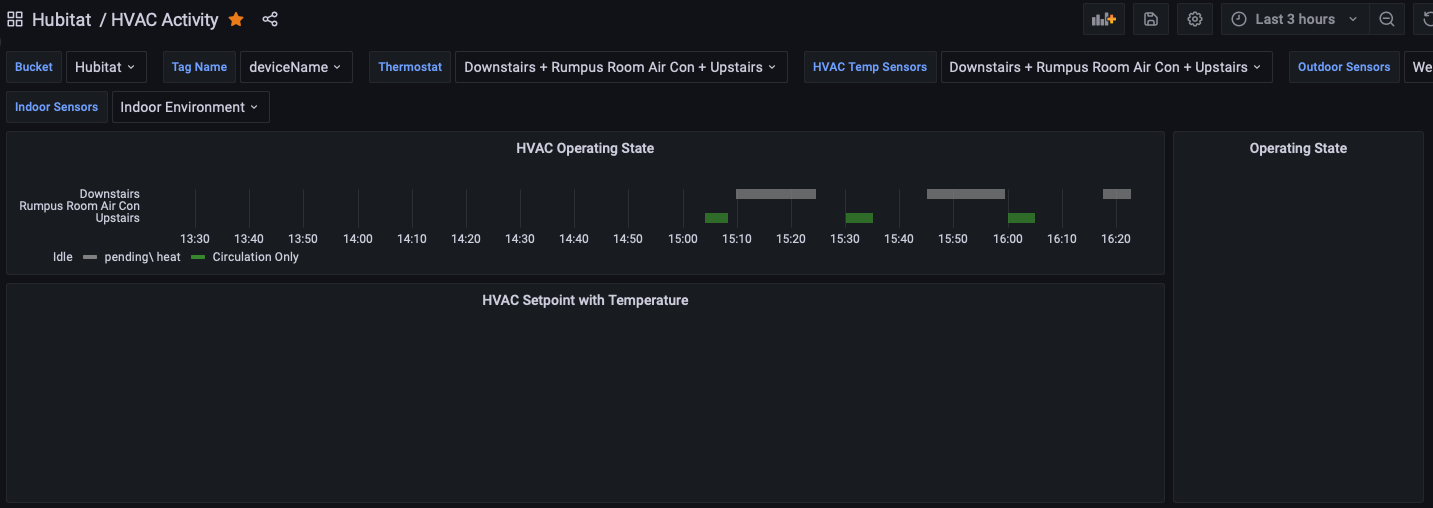
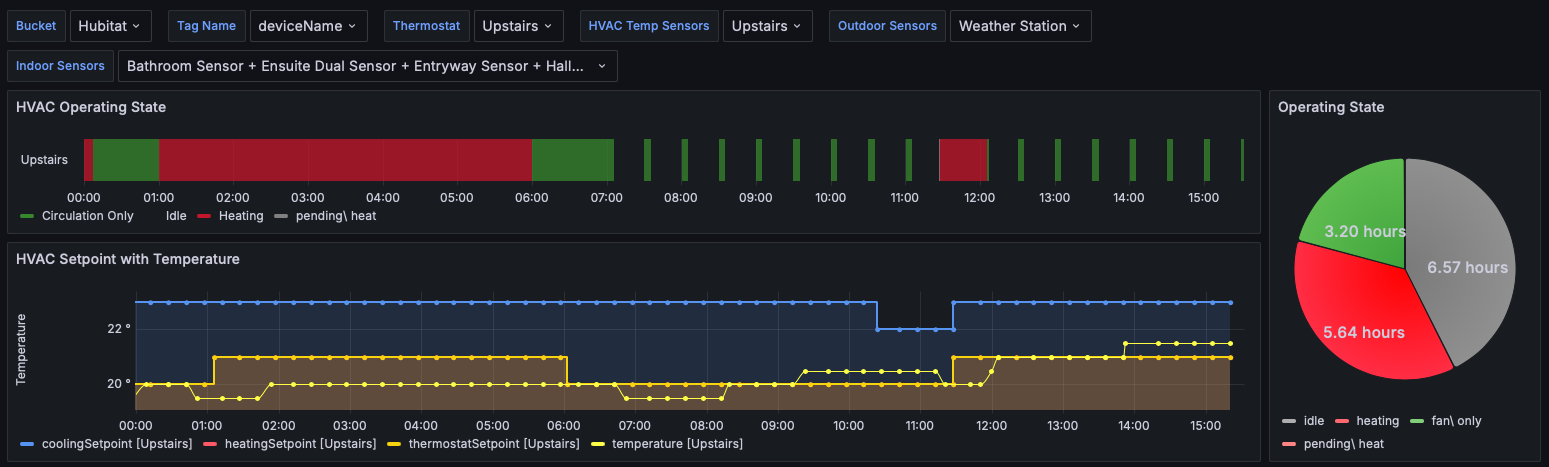
and I found the same issue in two of the HVAC graphs:
and again in Explore mode the data is there:
PS, I'm running Grafana v9.1.2
That is probably what is causing all the issues. That is from 2022: Release 9.1.2 (2022-08-30) · grafana/grafana · GitHub
I probably was on at least v10.x when I saved those templates. I am running 11.x now, I always stay updated to current via an automatic update.
If you are not able to update Grafana for some reason I could possibly backport them using a docker container. If you could at least get to 10.x they should work much better: Release 10.4.4 (2024-06-13) · grafana/grafana · GitHub
I think when I first made it, there was not an option in Hub Info, it used KB. The chart will automatically scale it to MB (or probably Gb if needed). It can be easily converted to MB as the base unit by adjusting the units setting on the chart and the thresholds for the colors.
I left the charts just as "degrees" so the unit is not shown. You can change the thresholds to make sense for Celsius. There might be a way I could have a setting at the top to adjust it, but not sure.
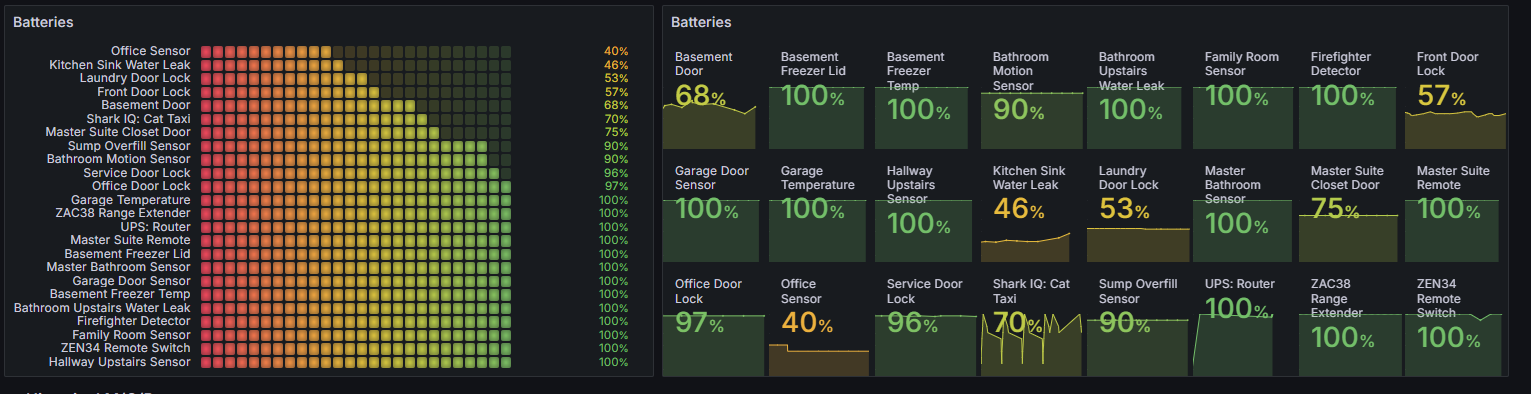
I'm looking for a battery dashboard if anyone has one. I thought i saw one once, but ill be darned if I cant find it !
For battery sensors or something more complicated for Solar battery stuff?
Battery levels for sensors is part of my sensors dashboard
Cheers, I’ll check with the creator of the Powerwall dashboards and see if grafana can be updated without breaking it.
Most stuff will port forward, but going backwards gets dicey because of extra things being added to the json file (sometimes just by saving it). I think even if they are using some of the legacy plugins, if you really need to keep using them you can download them as addon plugins last time I checked, unless they have totally pulled them by now, not sure.
I’m not using anything special, everything is just the standard data sources etc that you can install from the admin console.
Its the graph plugins that the charts use, there are a bunch that come with Grafana by default and a few of them got deprecated and replaced by new versions I think somewhere between 8.x and 10.x. I had some older dashboards I found online and imported that gave me warnings about the old plugins, and the charts were also ugly, so I eventually converted them to the new plugins. If it uses any of those old plugins that could possibly be an issue. Otherwise I have had a few minor formatting issues with the newer Grafana that I fixed with a couple of tweaks to the charts impacted.
Cheers, I’ll take a snapshot of my vm before I try upgrading.
I just created a new grafana instance and that solved the issue:
except for the Hub Info RAM graph, I dont know enough about grafana to fix this:
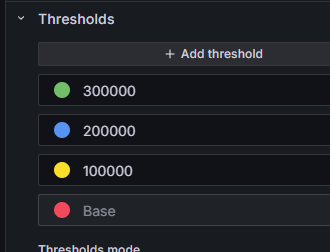
For Memory if you need to change the units, click the ... on the top one and click edit.
Change the Units that the data is in (charts will adjust the display unit) and the min/max. Both hubs will need to have the same thing being sent over.
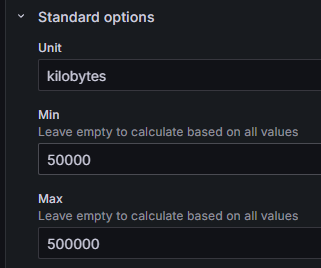
Then Edit the Threshold numbers for your units (might just need to take some 000 off).
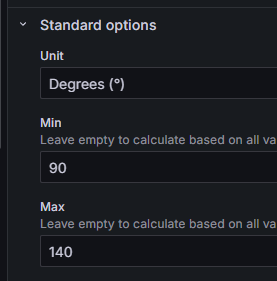
For the Temps, just need to edit the min max and it looks like I have the thresholds set as a percentage of the min/max already
Cheers, I’ll have a play tomorrow. ![]()
I am just curious if you have noticed anything wrong with your dashboards recently. I went to look at them this evening and non of the ones you have provided are working right. I think it might be related to my system upgrading my version of grafana to 11.1.0. I can probably push it back to a 10.x version if needed since it is docker, but wanted to hear your input on it.
Yes Grafana 11.1.0 is totally broken for my dashboards due to the variables. Something with the variables is not working at all. Unless they made some sort of breaking change on purpose.
I rolled back to the prior 11.x release and it went back to working fine. You could go back to the last 10.x as well I am sure that would work also.
Not sure what they did but I was just going to want to for the next release to see if they fix it.
Thanks for the confirmation. I have updated my docker config in Unraid and pulled down 10.4.5 and it is all working again. Hopefully they get it sorted
FWIW....I am using the cloud version of Grafana with your dashboards. Not sure what version the cloud is. I assume it is their latest. Some weeks ago the sensor dashboard stopped reading the variables. Probably the same issue that you described. I went ahead and created my own dashboard for the sensors that I needed. It took a little effort but I learned a little ( very little ![]() ) about Grafana.
) about Grafana.
Your hub info dashboard continues to work fine for me using Grafana cloud. Thanks