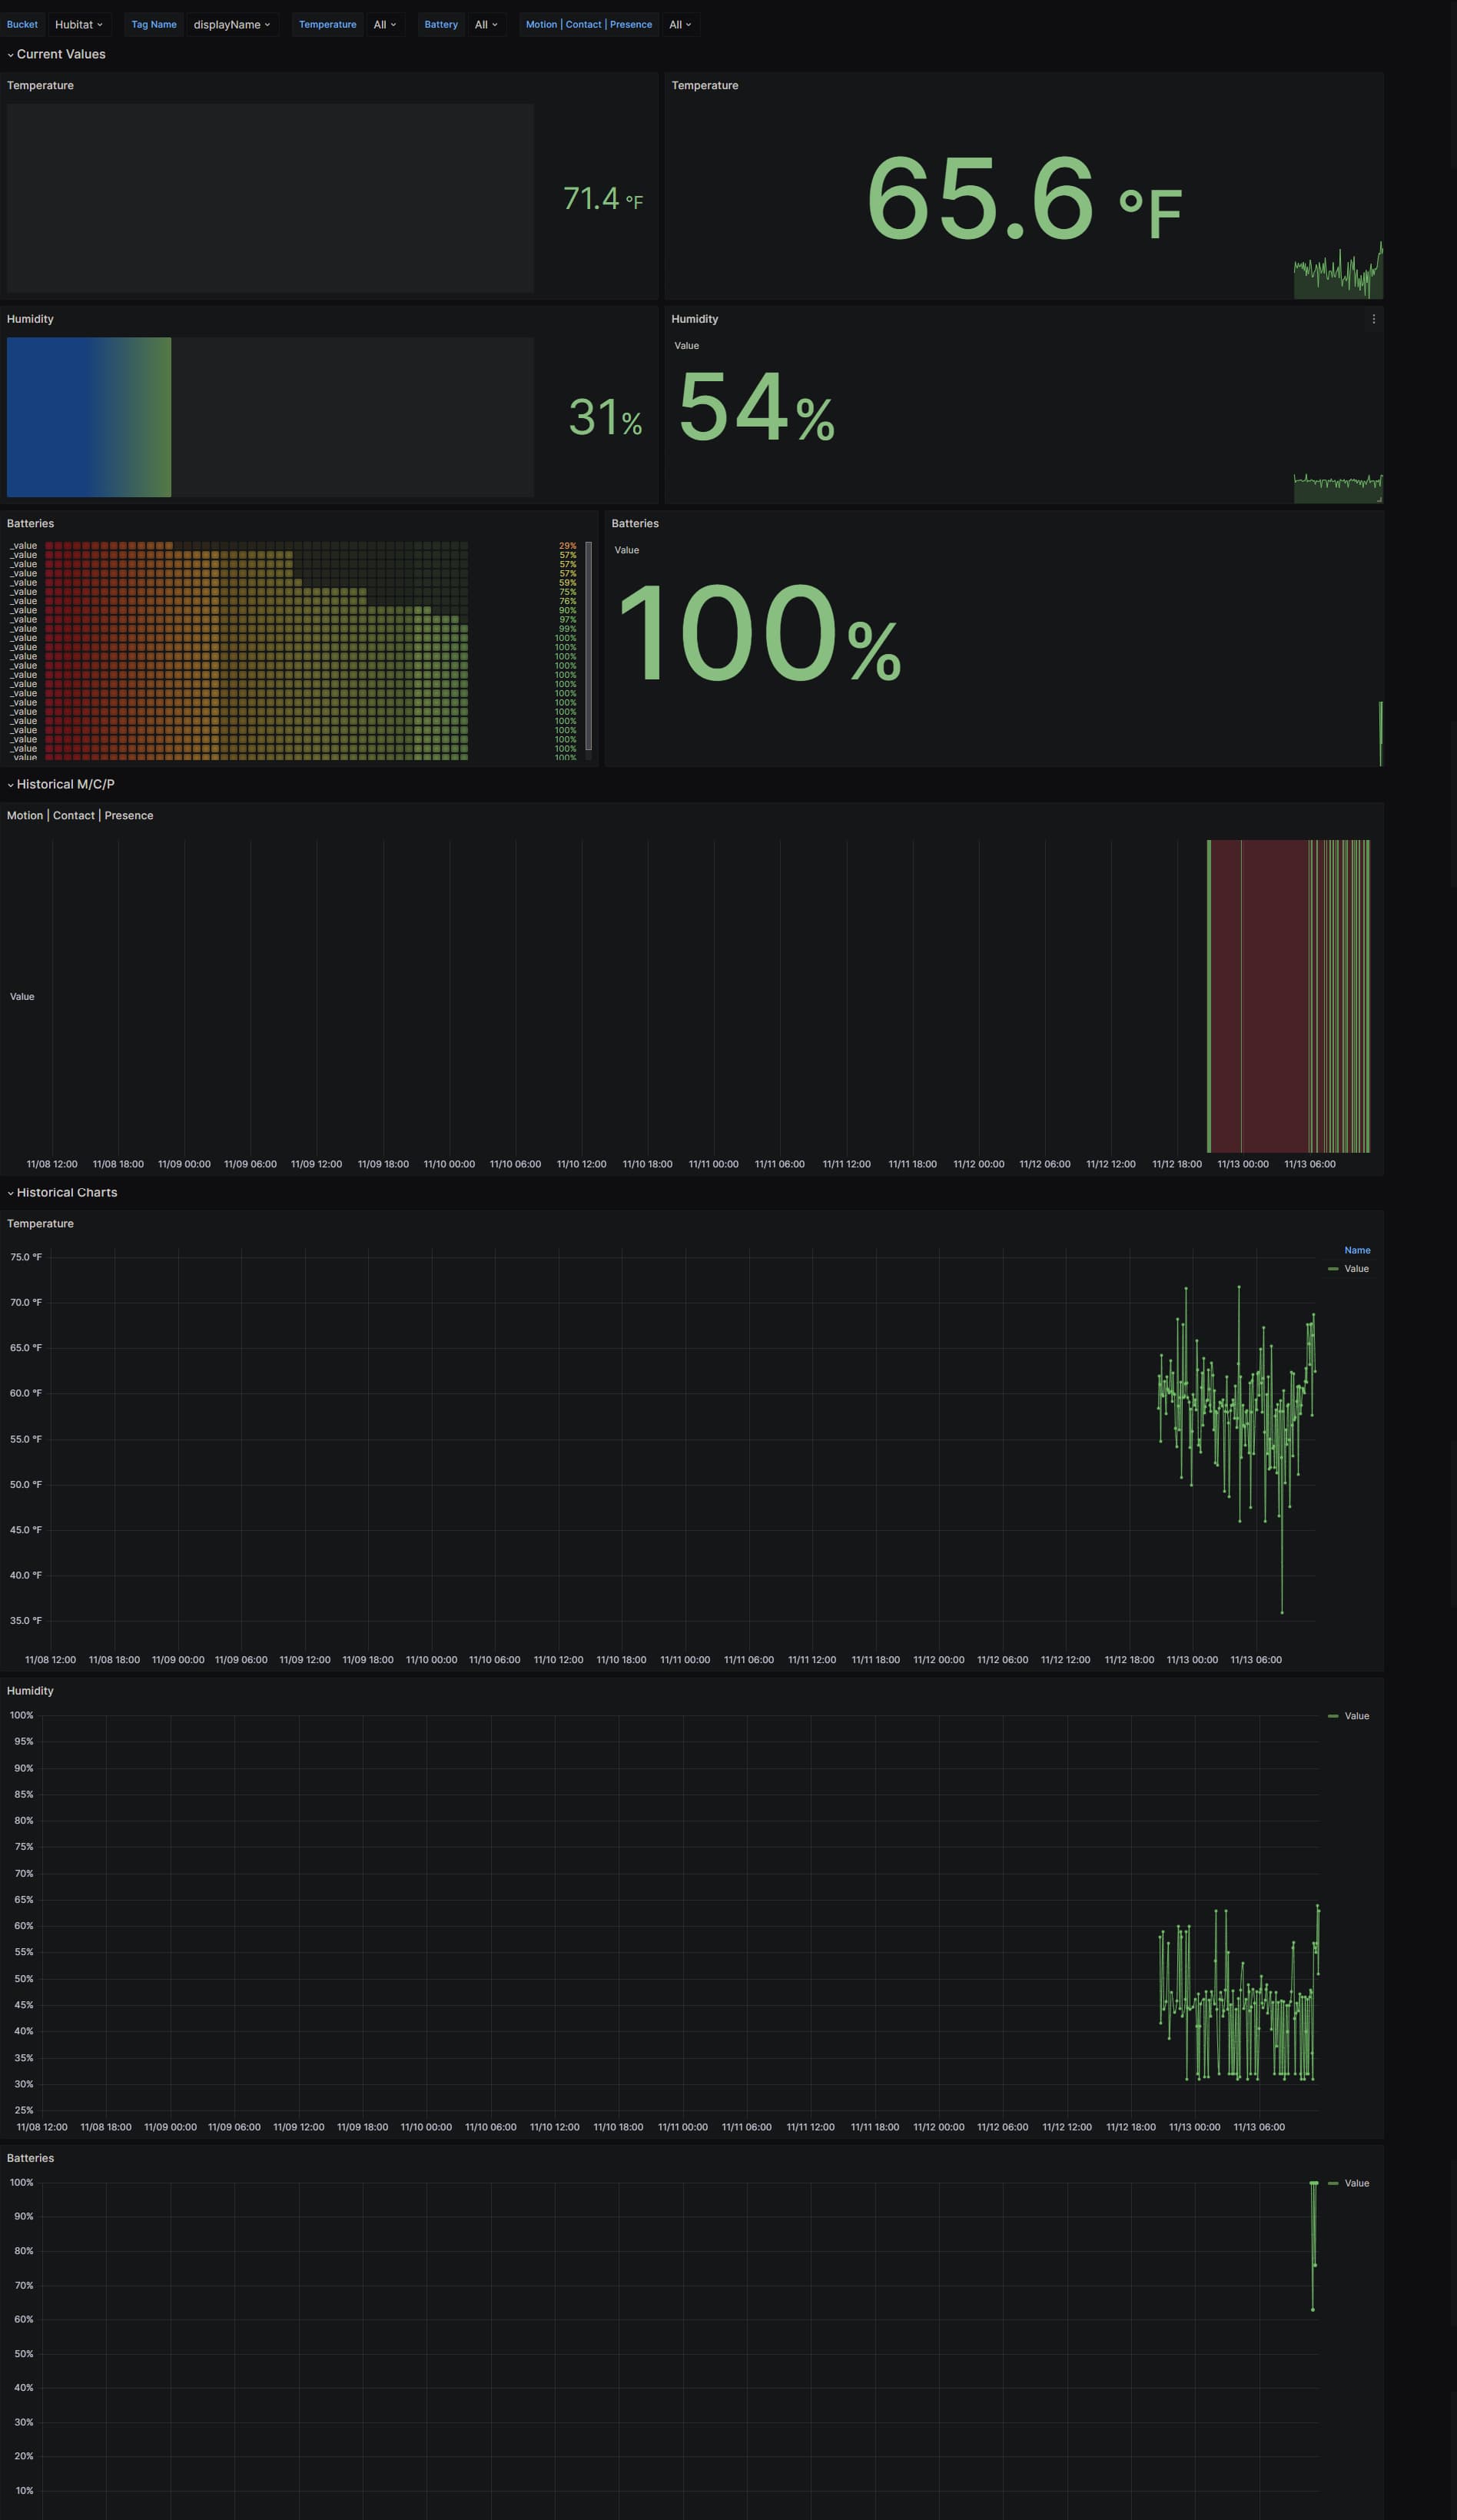
With the sensor dashboard, I'm seeing this issue. Please assist. Thank you.
Status: 500. Message: A query returned too many datapoints and the results have been truncated at 10191 points to prevent memory issues. At the current graph size, Grafana can only draw 1019. Try using the aggregateWindow() function in your query to reduce the number of points returned.
Can you edit one of the Temperate charts and look at the query code, see if you have this as the last line. I don't think it was in the original but I added it later so maybe you just need to import the new one.
Today I was reading this update from the InfluxDB team and it looks like Flux is on the way out. Reading the blog Flux was the primary reason people didn't update to InfluxDB 2.0. Looks like the are releasing new versions of the product that are tailored to usage patterns, Long term series and then front-end analysis. You can read it here.
After a couple of years trying and really trying to keep my sanity with Flux looks like we are going to get a SQL like query language again.
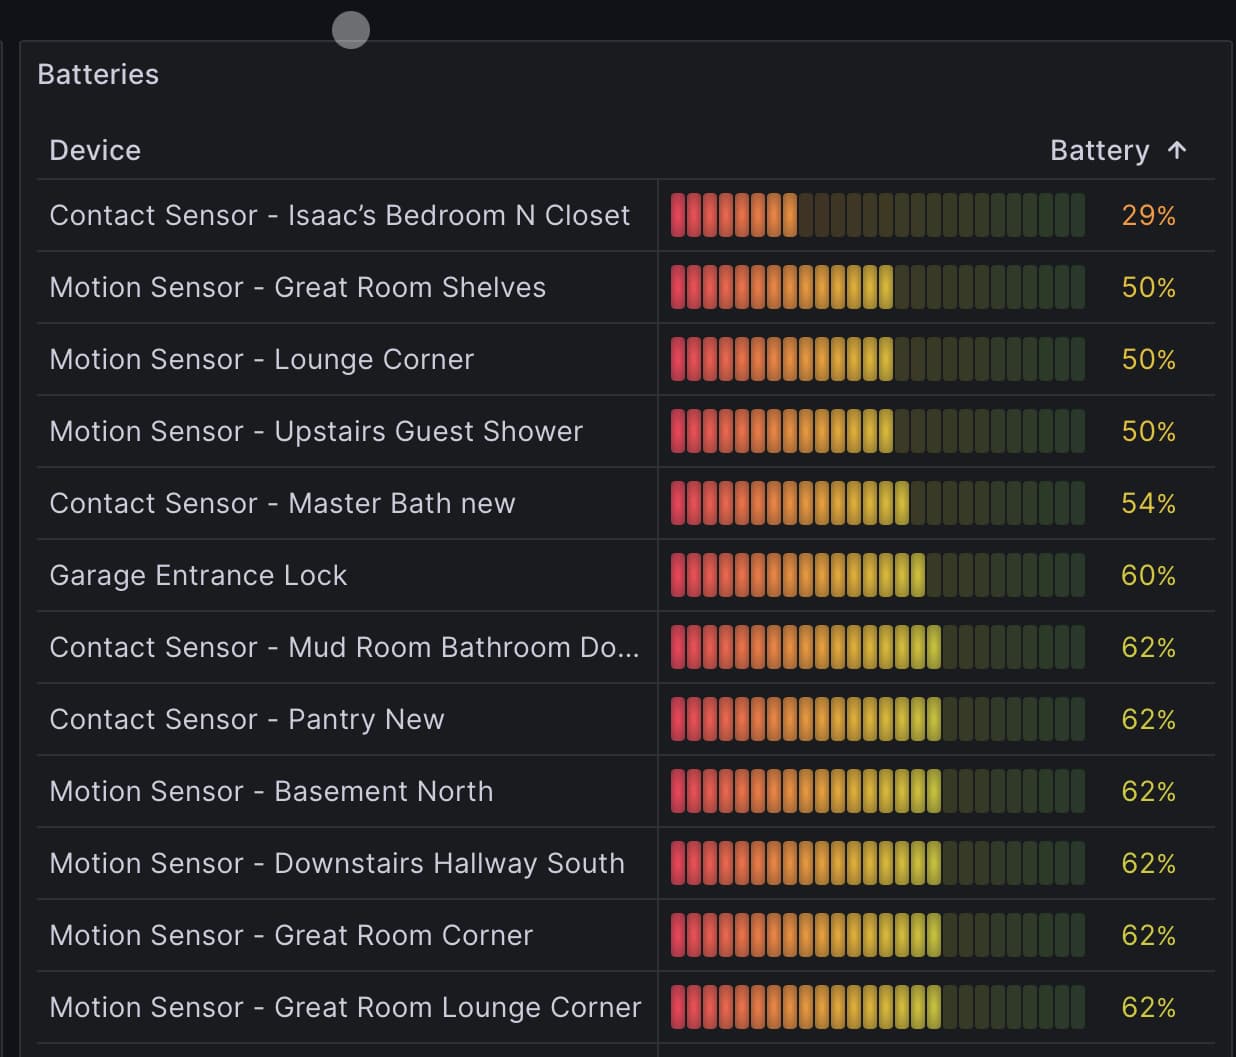
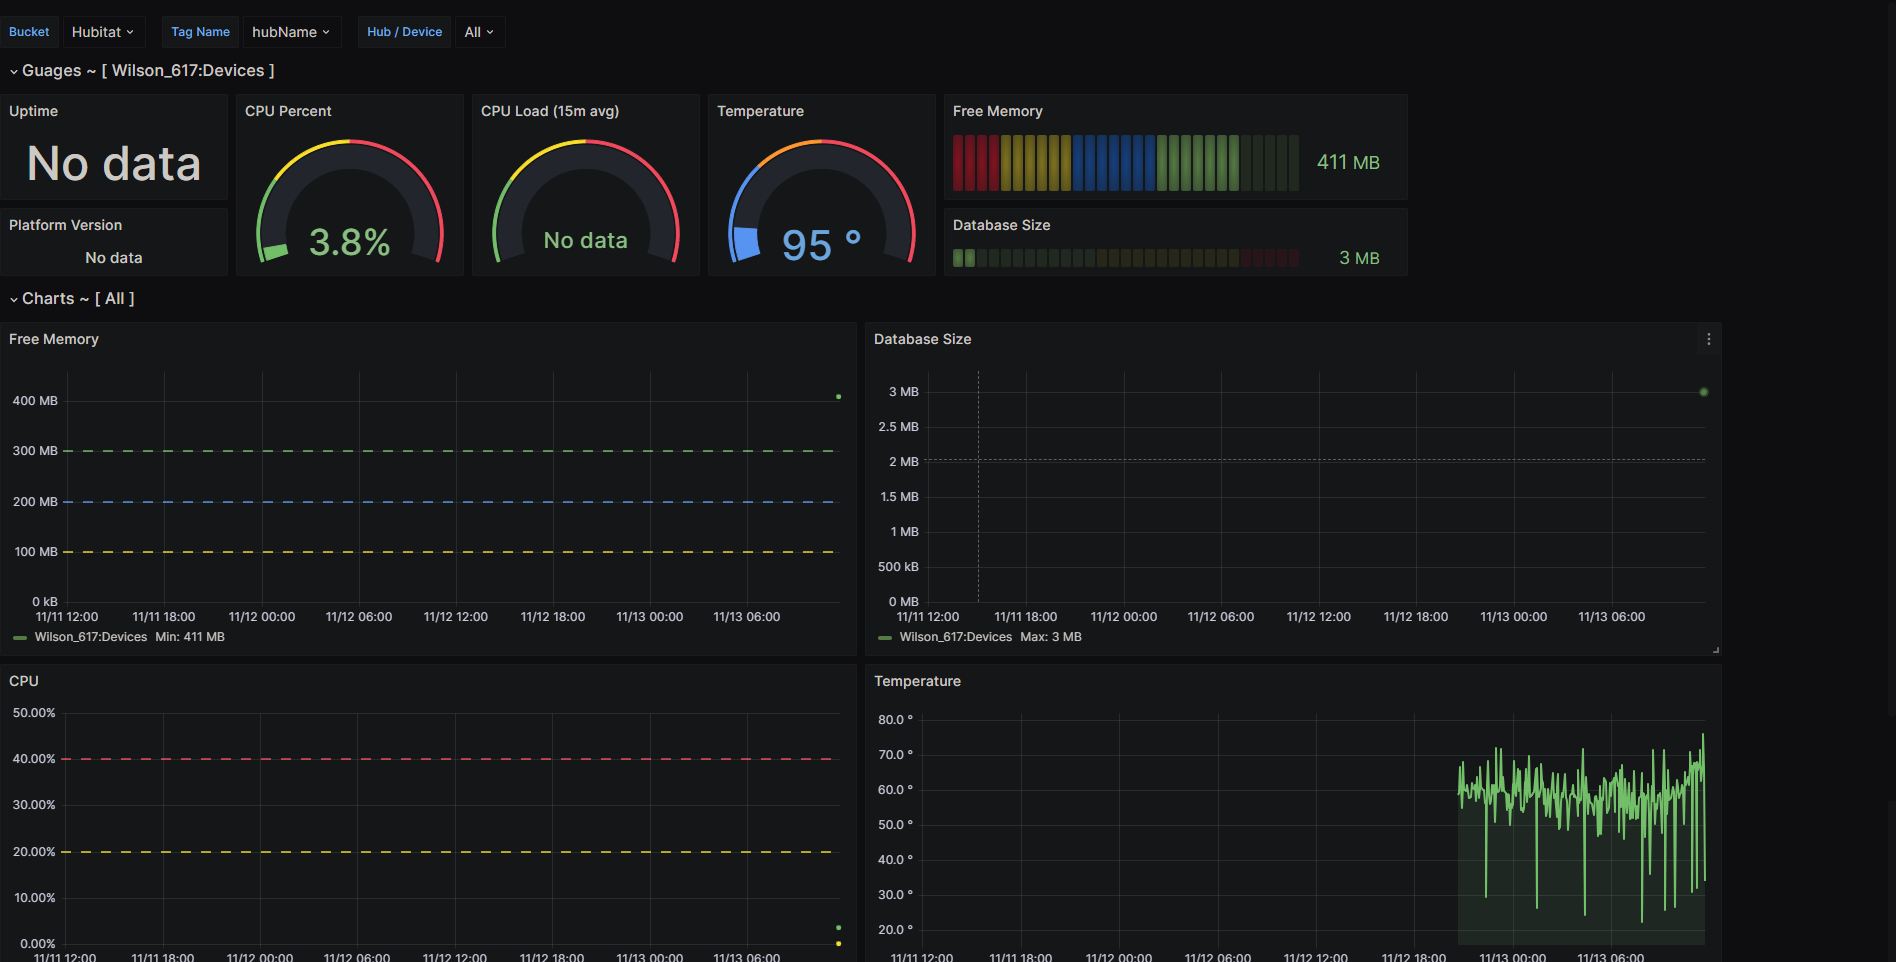
I'm just starting to play with this. It looks very interesting, but I can't seem to get it to pull the information for Hub Information. Also, the sensor information is just dates and time, but it doesn't say WHICH sensor, is that the way it is supposed to be?
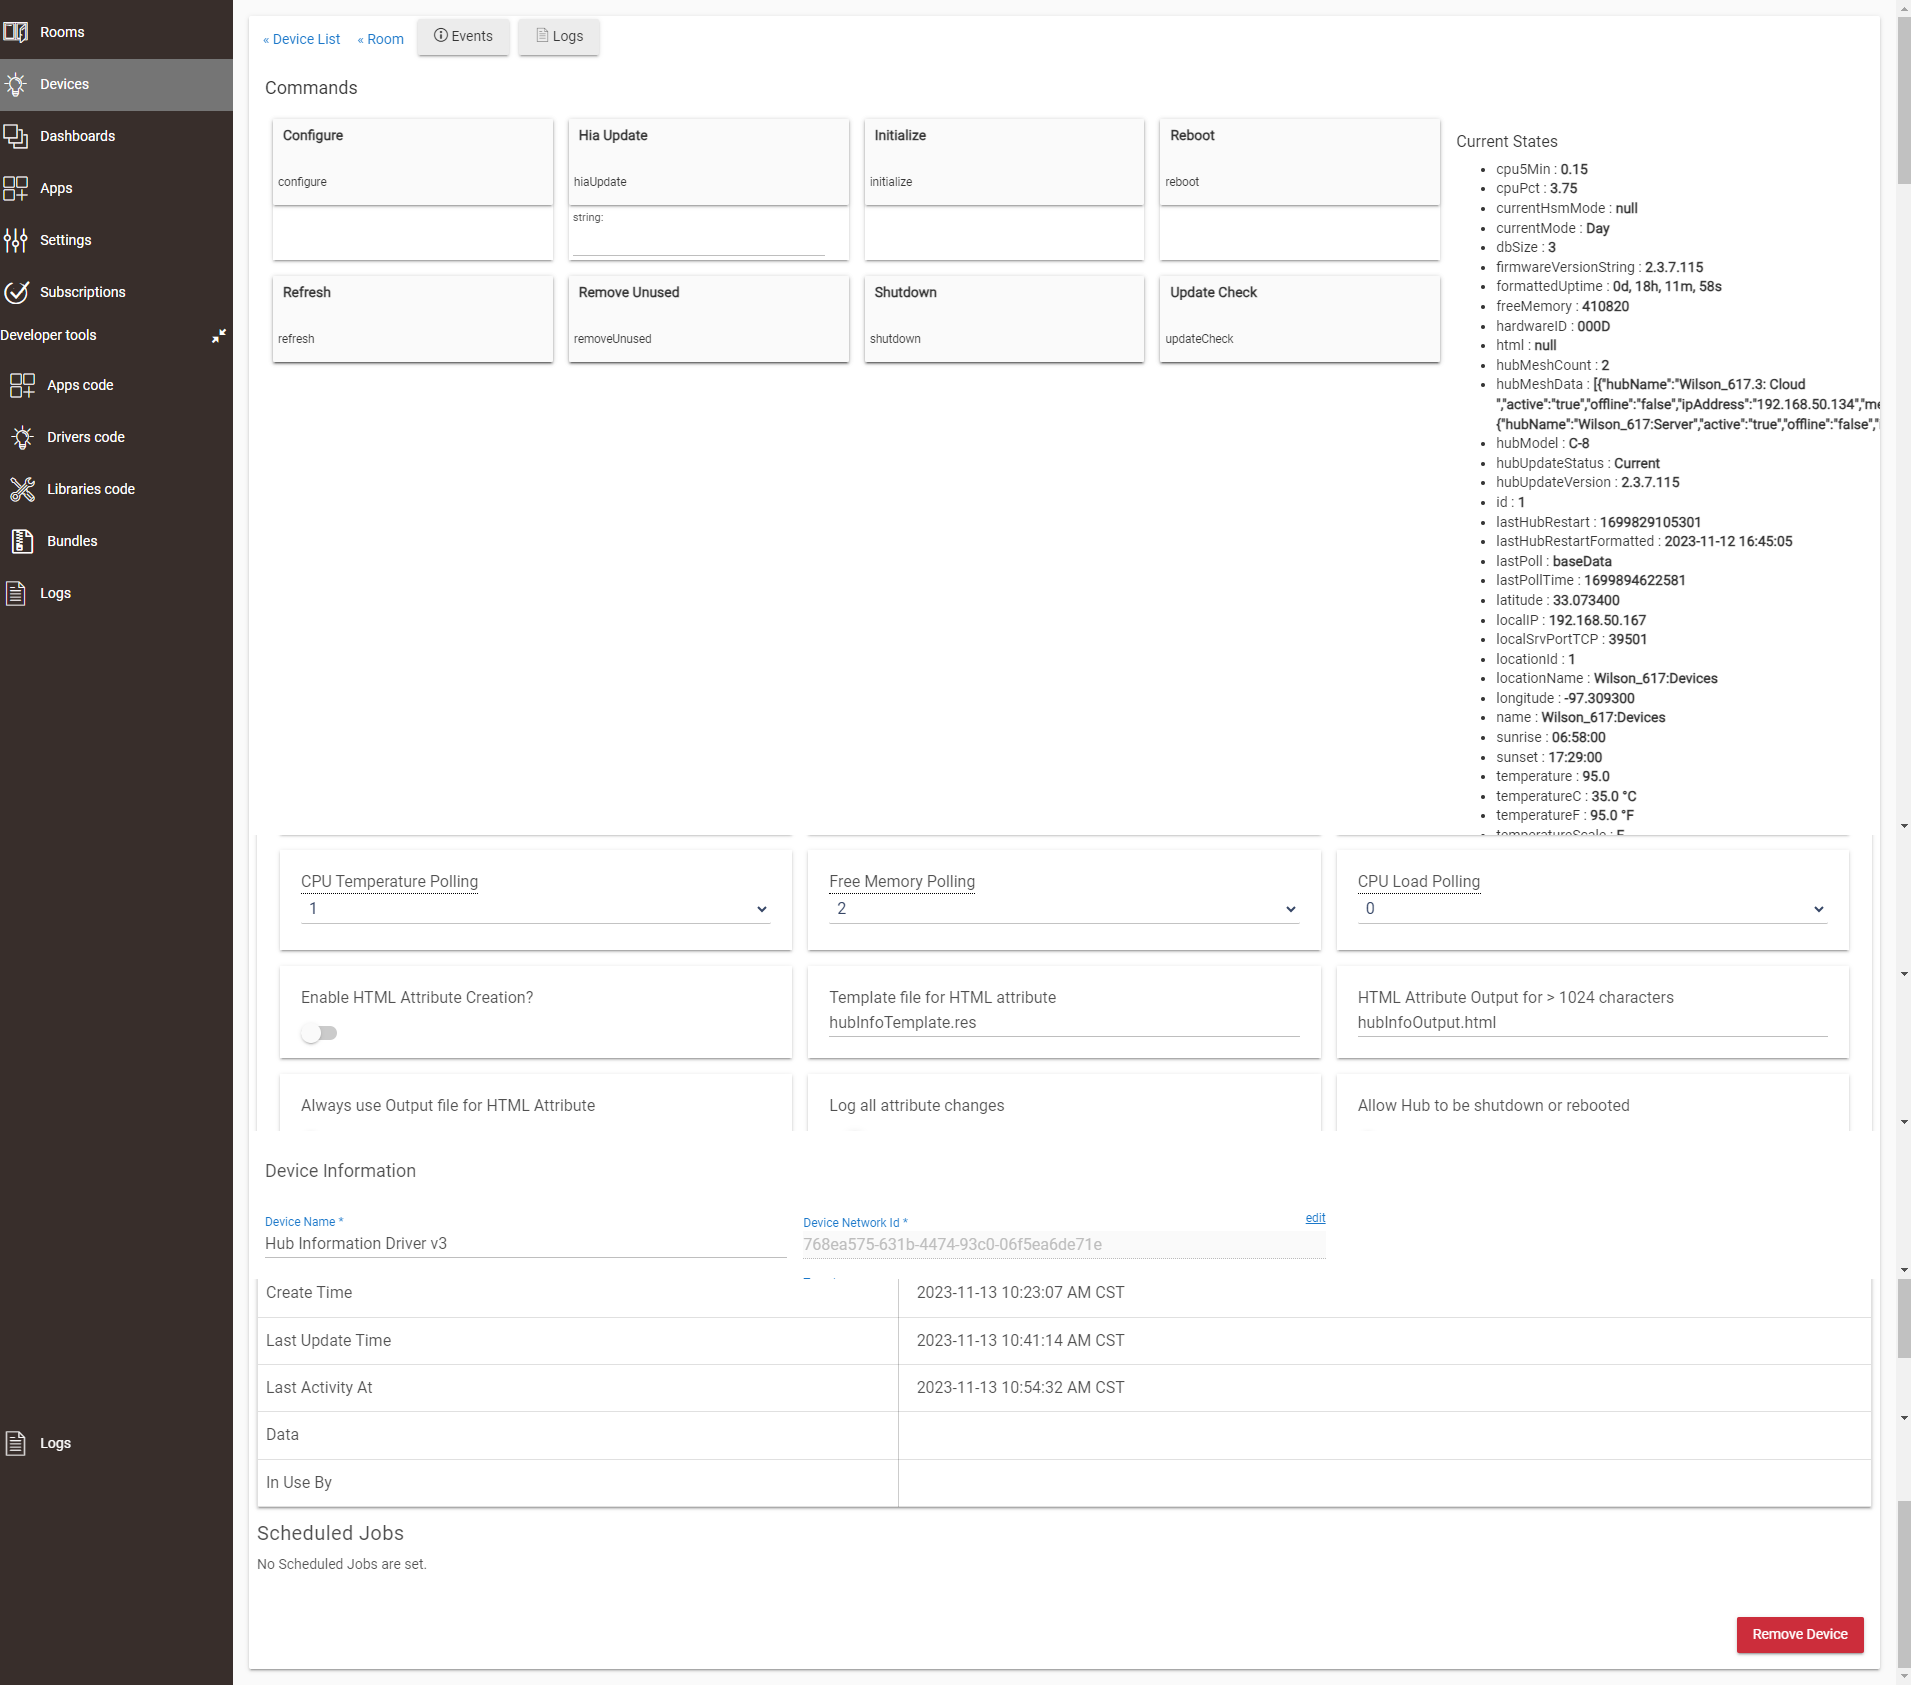
That looks like you have hubinfo driver loaded and it is getting the data..
Then you need to get the data from their into InfluxDB with InfluxDB Logger.
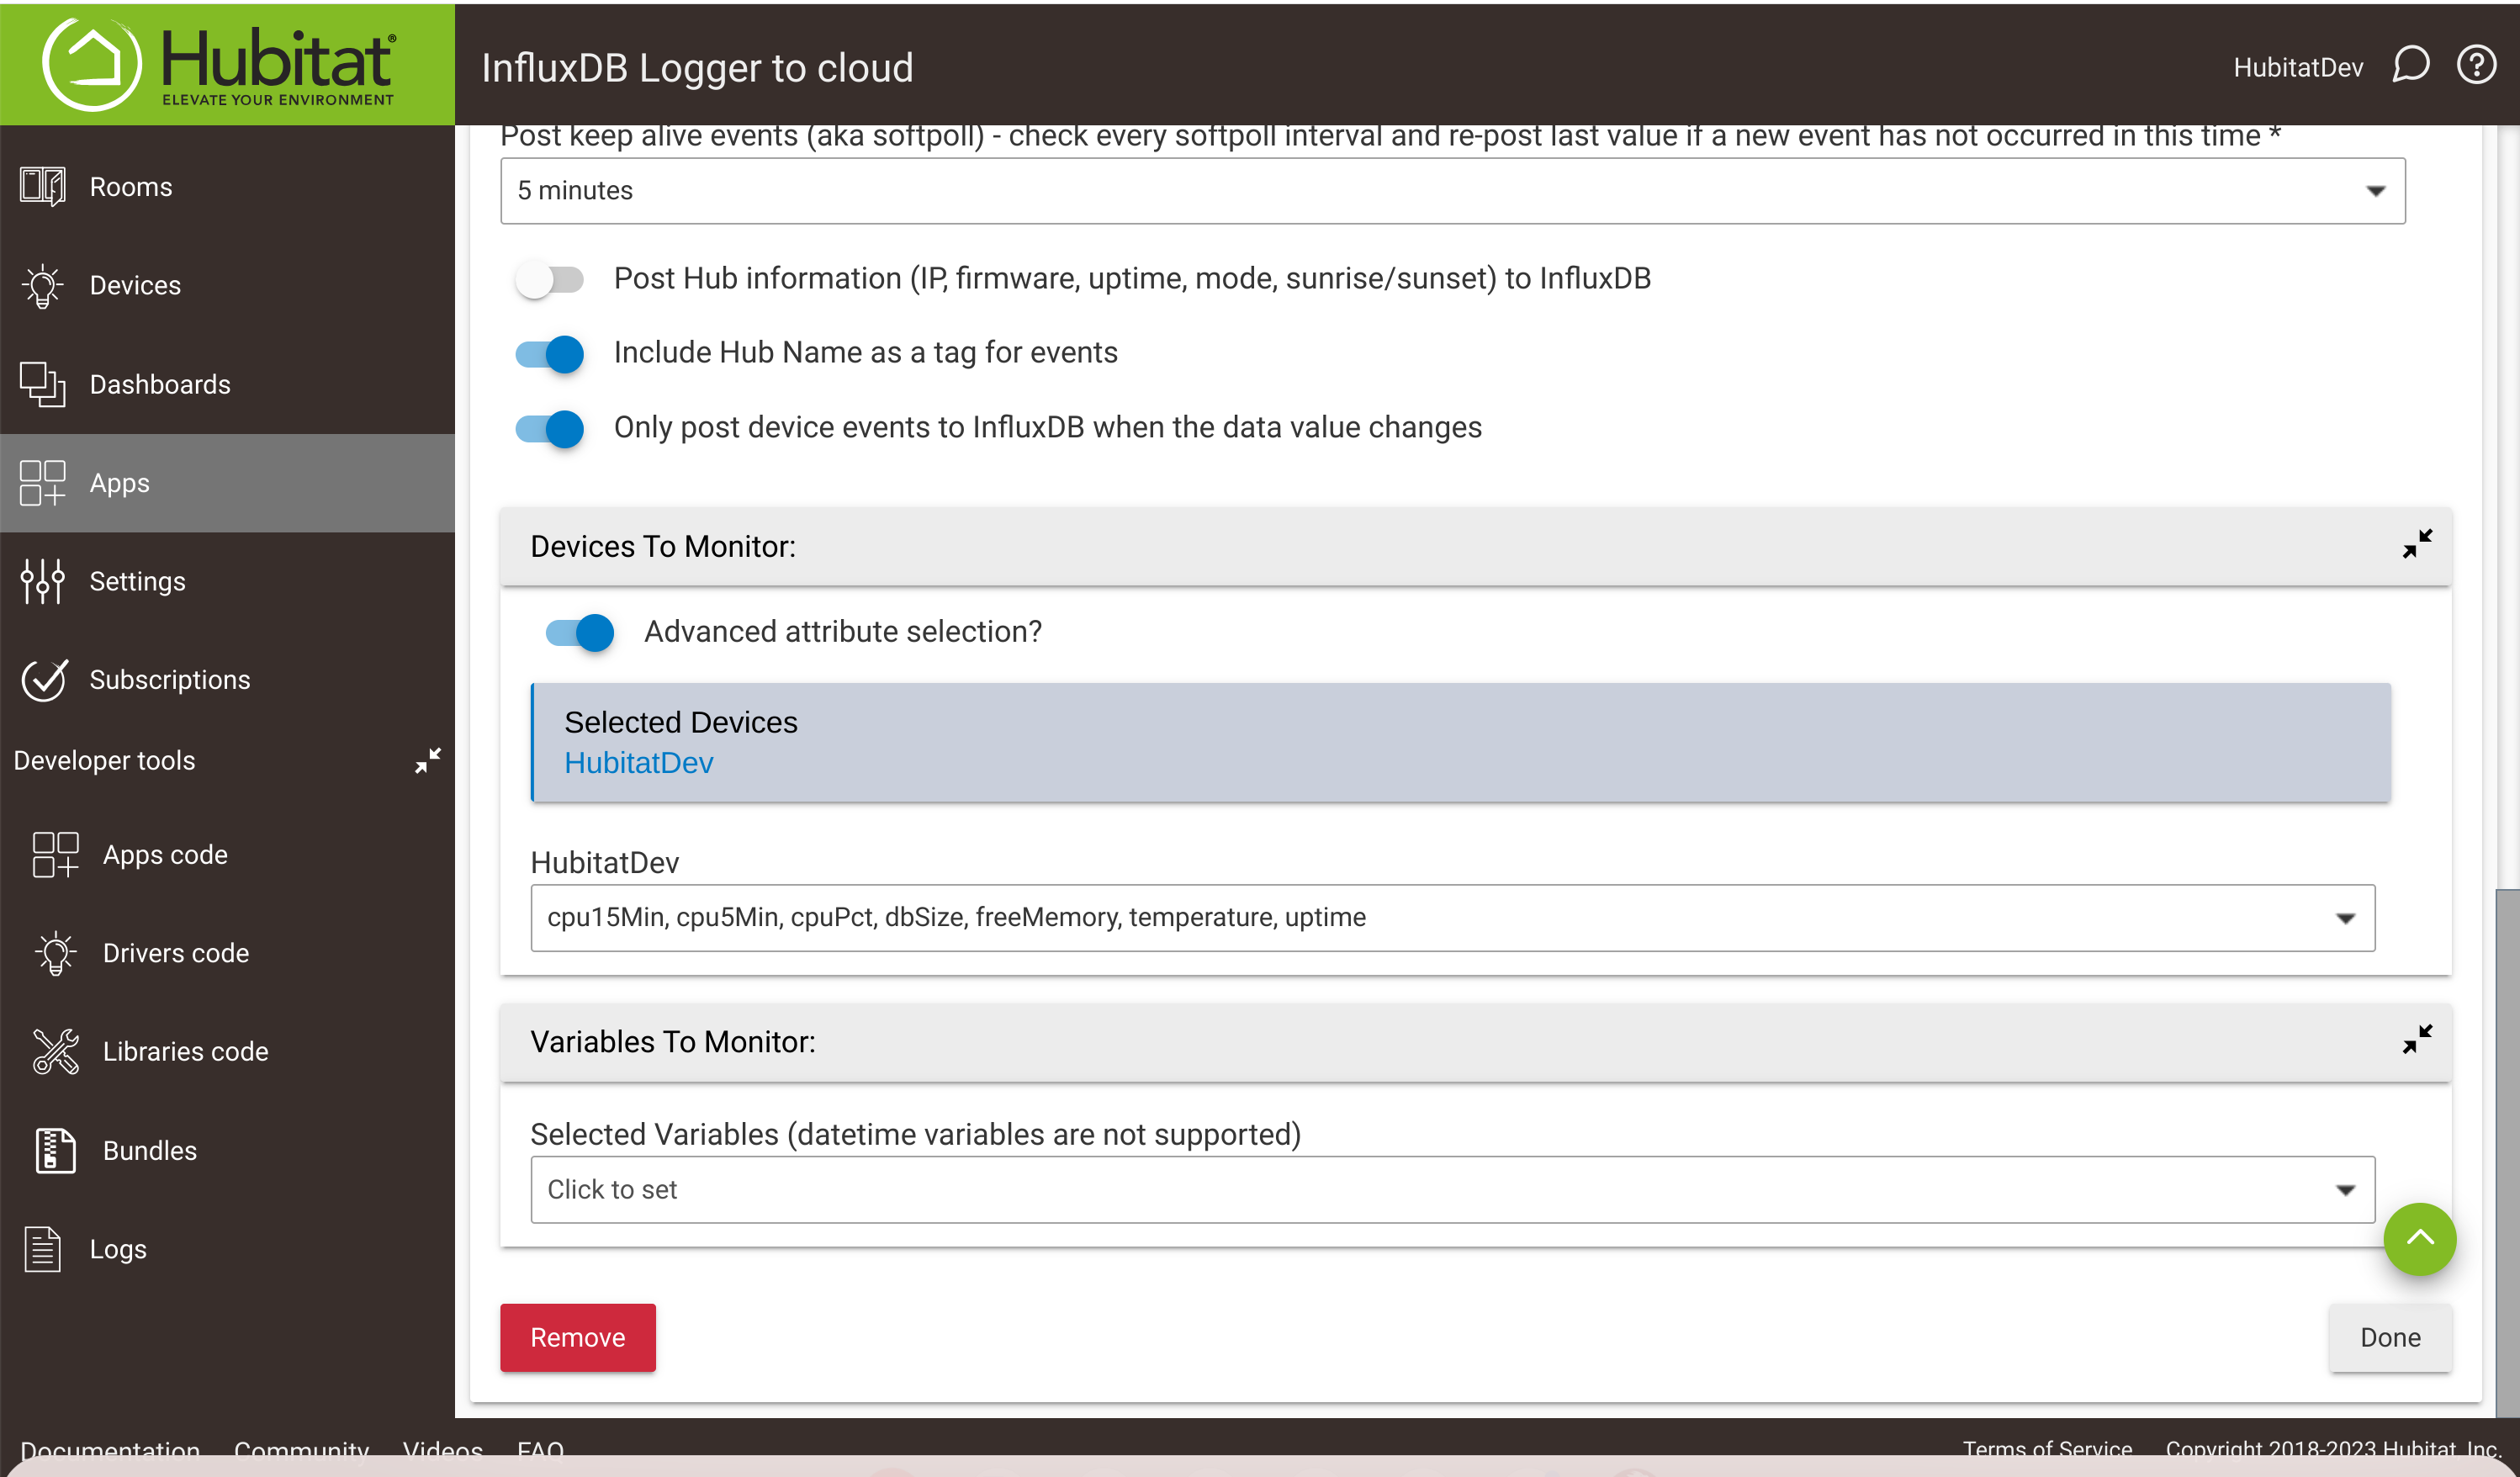
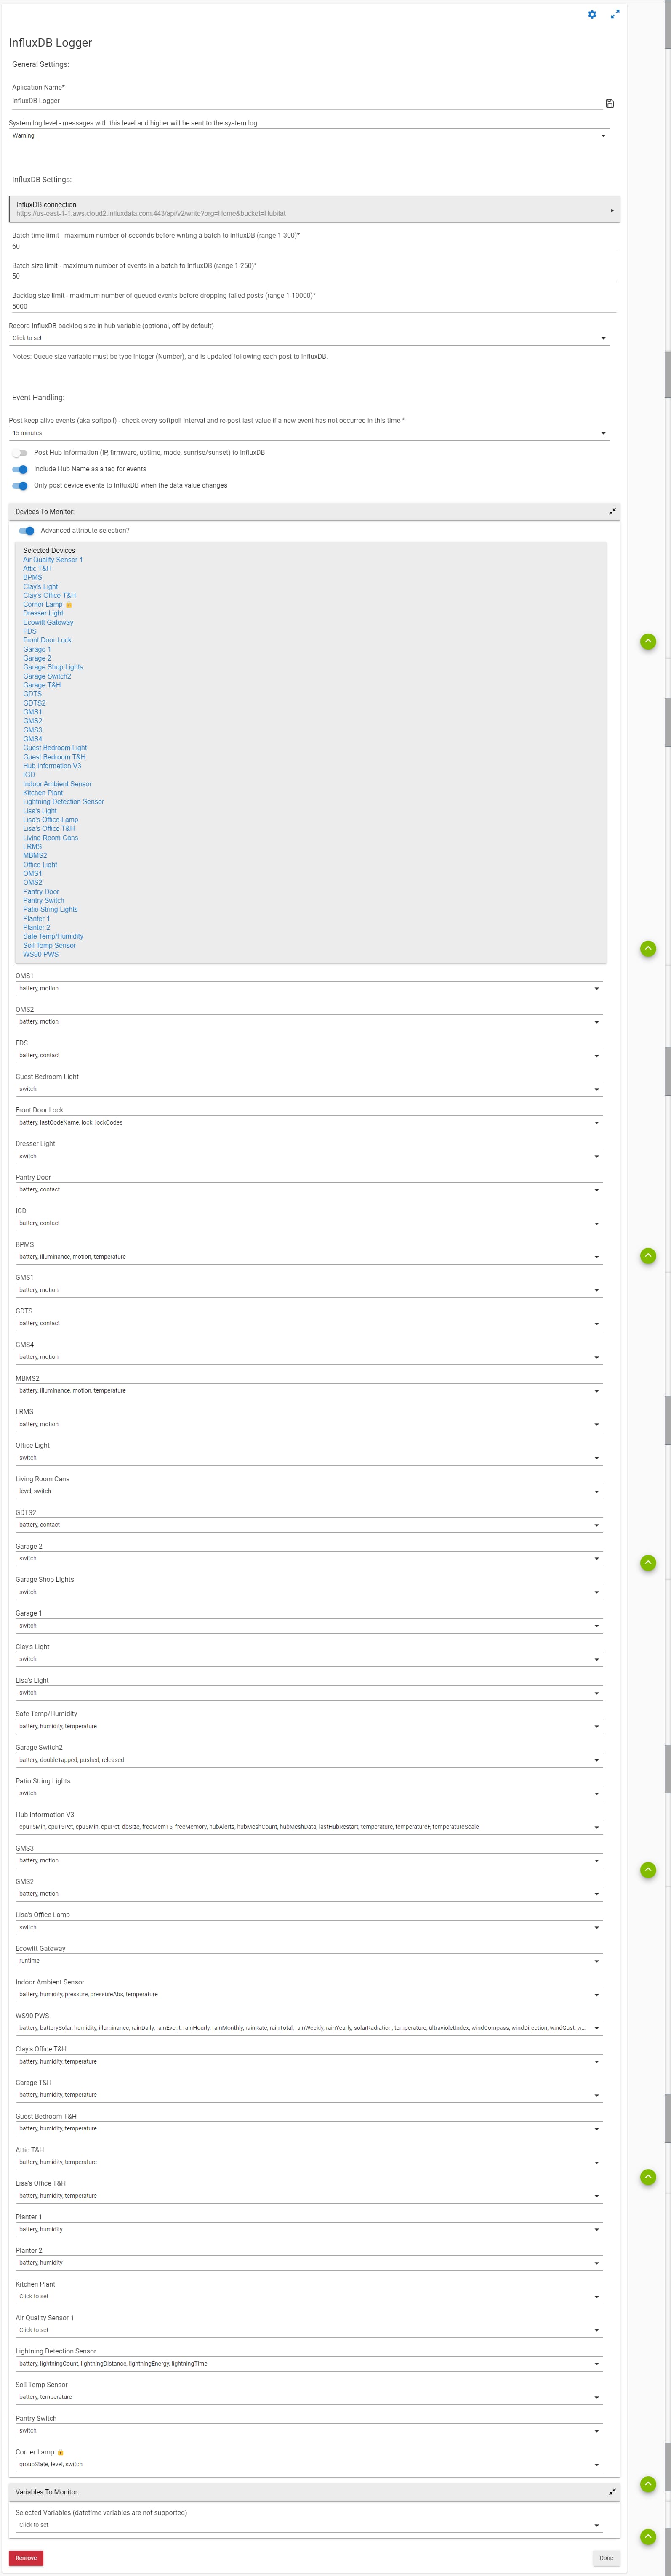
You will need to use the advanced option to allow all attributes. This is one of my setups that do this. You can see i have the switch for "Advanced attributes selection" on , then i selected my HubInfo device for my dev hub and then the attributes it is sending to InfluxDB. All of those Attributes are needed for the Hubinfo dashboard.
Ok, I got the hub information reporting. Now I just need to get the actual device names to show rather than just the date and time..
Scratch that, got those figured out too!! @mavrrick58 thank you again for your assistance!
Just set up the basic Hub Info dashboard tonight...Influx and Grafana cloud setups were a great time-saver over doing a local Pi-based config, really like that.
It is most likely how they get into InfluxDB. InfluxDB Logger generally focuses on sending items by event. So if the part of HubInfo Driver that populates uptime and Firmware isn't sending that value in yet then it wouldn't show up in InfluxDB. Check the Hubinfo Driver config and make sure that they those values are part of something sending regular updates. Probably at most frequently every 5 min.
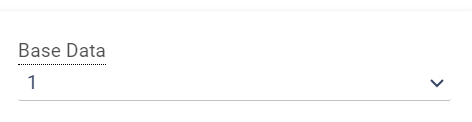
Those values are part of the Base Data group of calls. Make sure that isn't set to 0. I think as long as something gets sent it will know the uptime. Also a reboot will push new values as well.
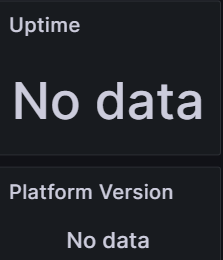
Thanks for confirming, had already done that and refreshed to re-poll everything:
On uptime, I just refreshed my Hub Info device page and uptime updated from 62-something to 81827, so there was an update on uptime. I refreshed and re-loaded the dashboard on Grafana and uptime didn't update. I'll give it some time and see if it catches up later.
Just wanted to confirm that you are talking about a hub reboot, correct?
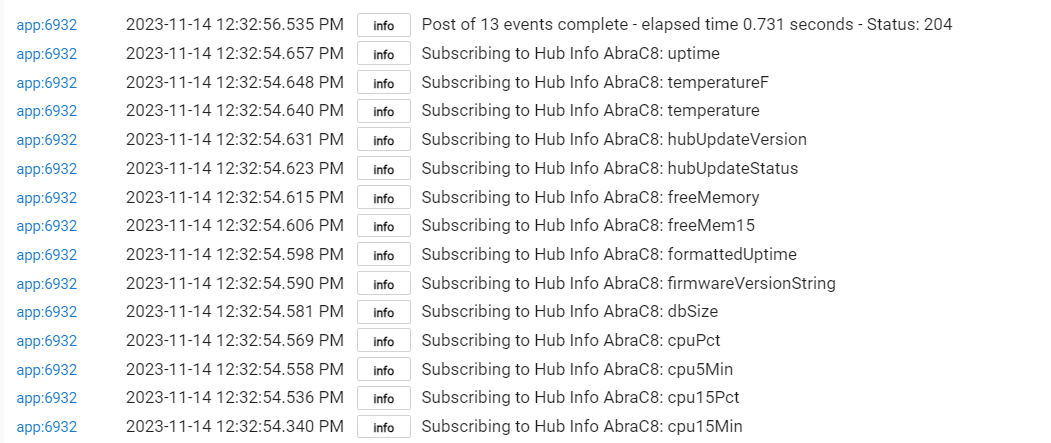
In the InfluxDB logger, set the System log level to 'info' and save the app.
In the logs, you will see a list of devices and attributes that InfluxDB Logger has subscribed to. Does the list look correct?
Also, the log will show when events are queued for insertion with InfluxDB. Do you see events being queued? You will also see when the post to InfluxDB has been completed.
Thanks. I had set logging to info last night to check and then got distracted and forgot to follow up. Re-saved InfluxDB logger w/Info Logging set and it looks good in logs: