I did end up getting a variable to work, just can't remember what source of information provided I used... I'm terrible at looping back with outcomes... 
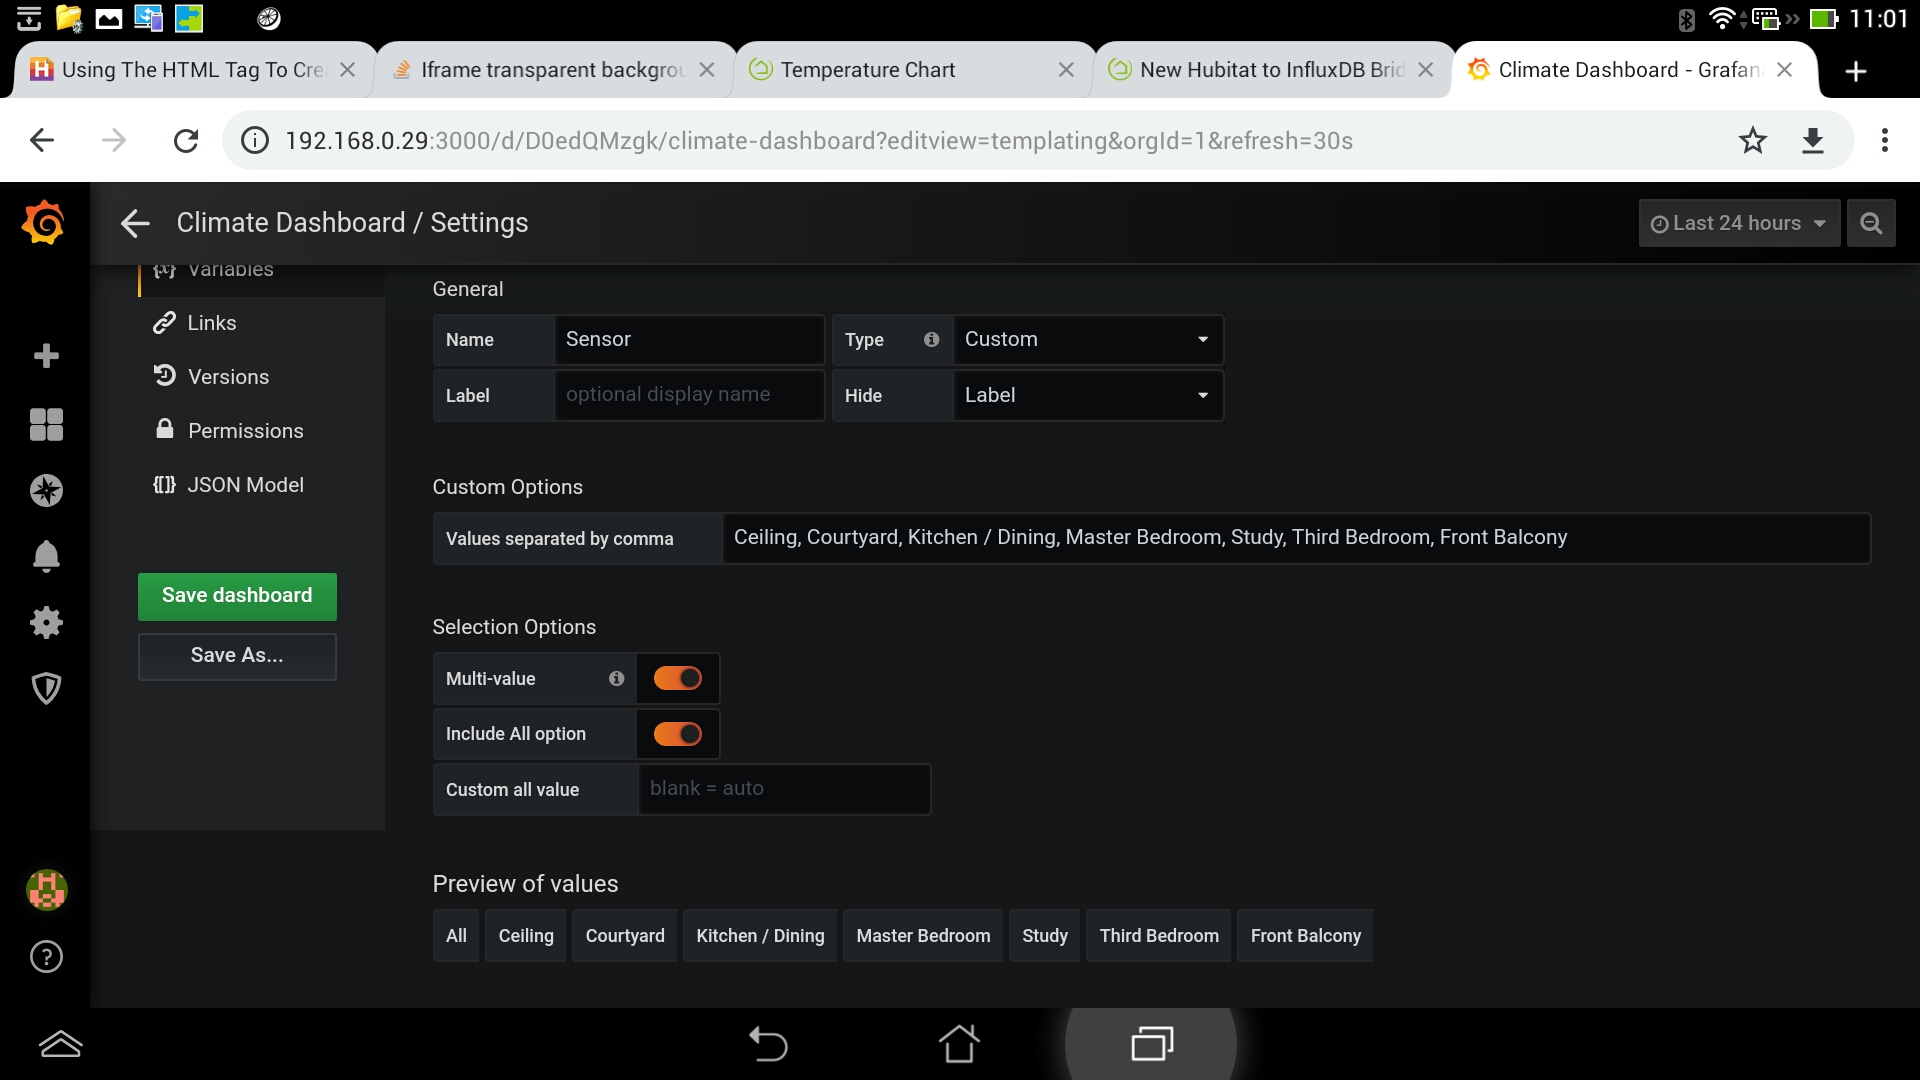
I setup a variable with a comma separate list of values (would have preferred to have a dynamic list, but this was easy enough and they won't change too often):
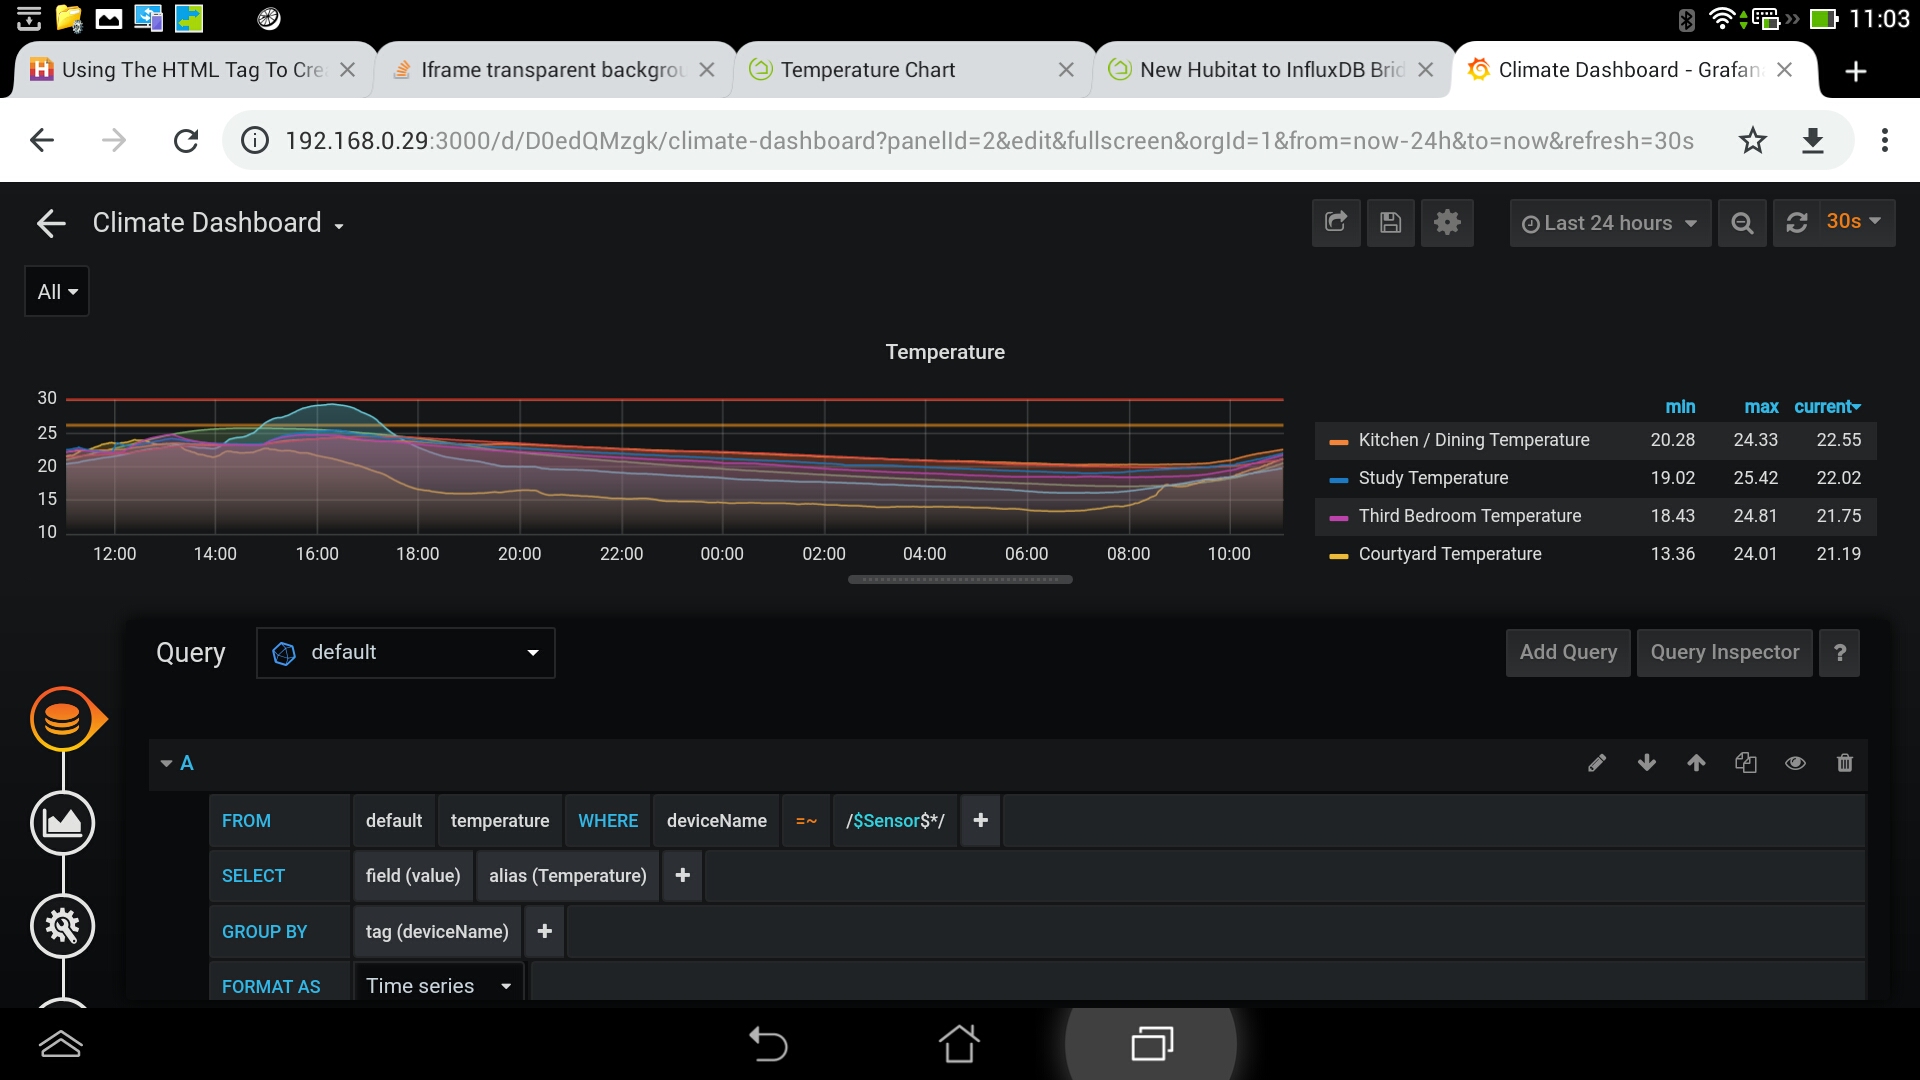
I then added this to the WHERE clause of the two queries I have, one for Temperature and one for Humidity (only Temperature shown below).
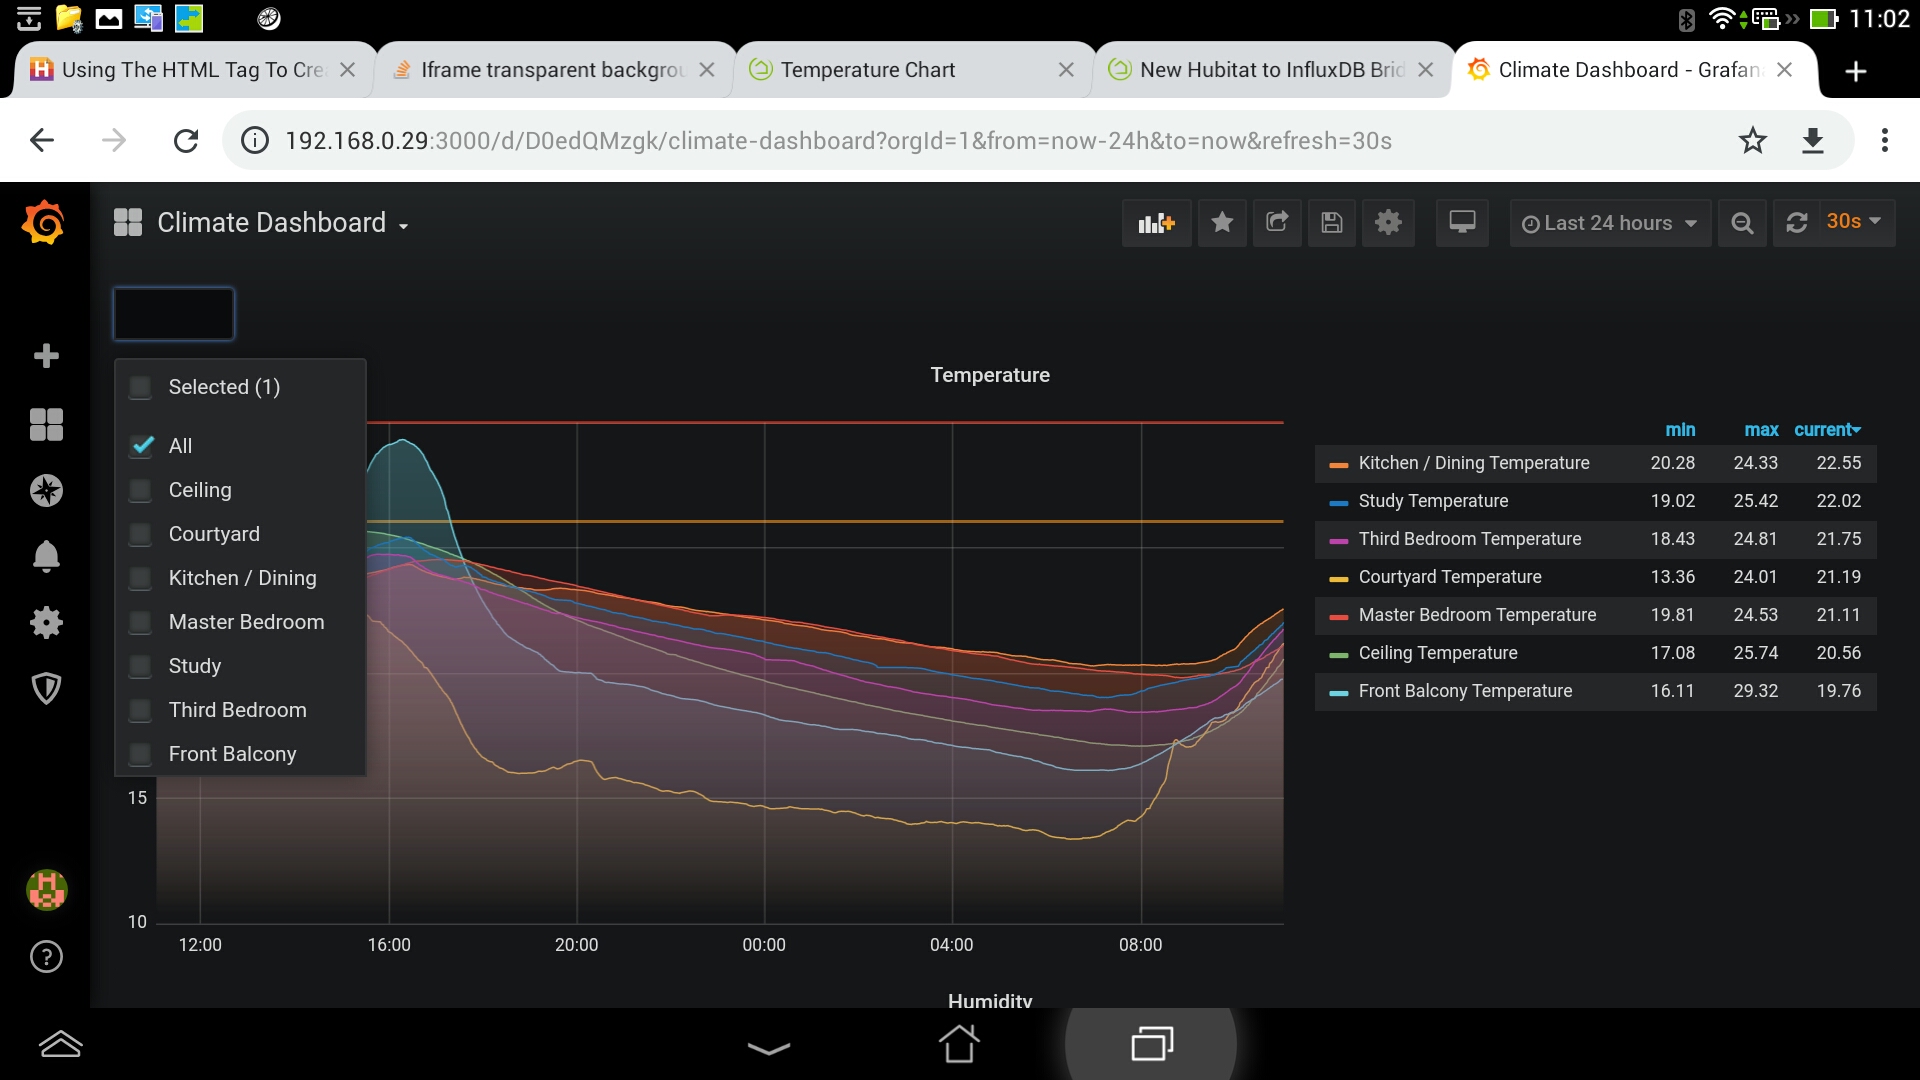
I then added the variable as a selector in the dashboard, which filters all the charts where those queries are used:
I also posted some details of a modified version of these charts I have added to my Hubitat dashboard, details are here and here.
Thanks again for all your help,
Simon