2.1.6 Added a nice improvement to the MakerAPI which brought in an official push method, vs WebSocket. Since people have always worried about the InfluxDB Logger user app causing hub slowdowns*, I thought this would be an interesting approach to send data to InfluxDB since it avoids using a User App on the Hubitat.
Code: hubitat-maker-to-influxdb - npm
Warning: This code is very alpha, I've been running it for a bit, but it's not even my main feed of InfluxDB graph data. I'd love to get feedback from others on how it works for them and what problems they see.
What this allows:
Credit (I need to add this in app.js):
- InfluxDBLogger user app for how to transform event data for InfluxDB. Converting Groovy to JS is amazingly easy.
- @dan.t Scanned his code for using urlencode for encoding the request to Hubitat.
What you need:
- External computer, for example a raspberry pi.
- An influxdb server setup on said computer, bound to 127.0.0.1 without auth.
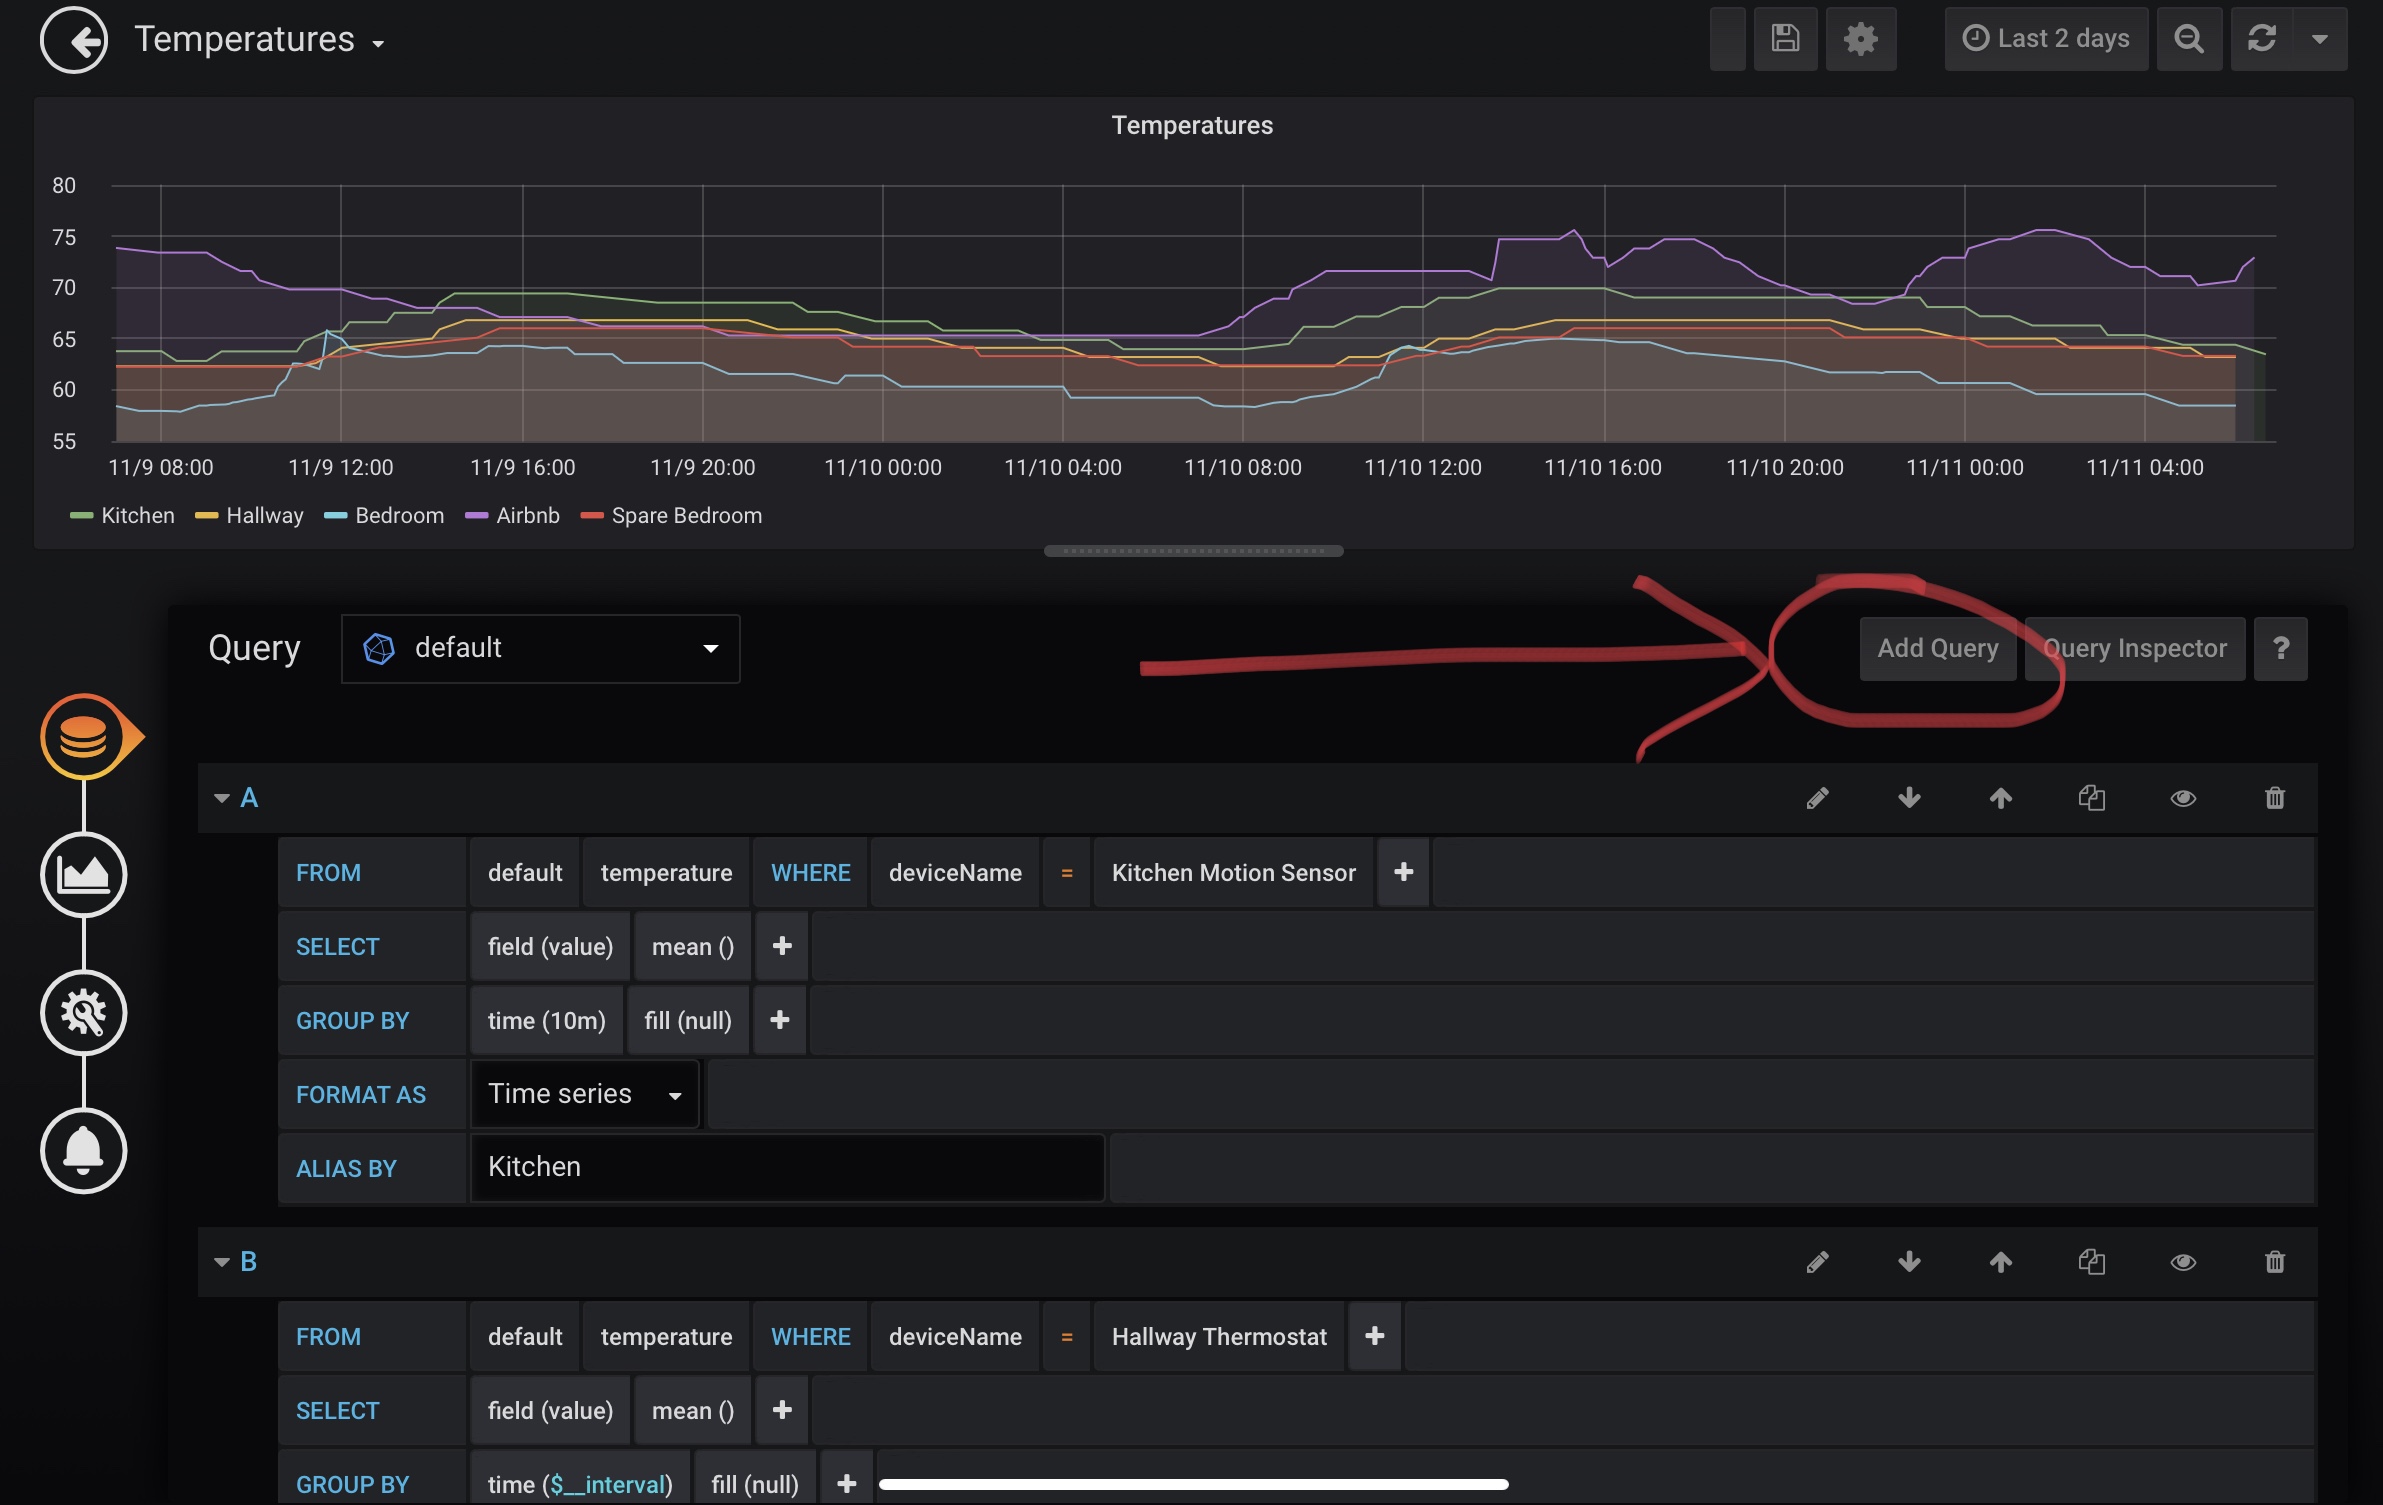
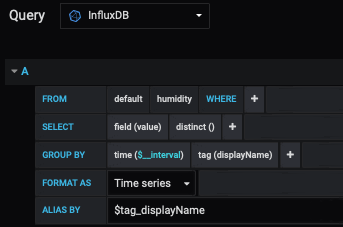
- Grafana installed to graph the data.
What it doesn't do that it should:
- It probably crashes on unexpected/poorly formed input (send me what the data looks like)
How to use it:
- On the Hubitat install a new instance of the MakerAPI. You CAN NOT use an existing MakerAPI that's being used for push, for example the awesome homebridge-hubitat-maker nodejs app from @dan.t
- Select devices you want to log data from. Ex: Motion Sensors that send temperature data, power or energy sensors
- Install hubitat-maker-to-influxdb from npm
- Create a config.json described below. Multiple hubs, or maker apis are supported. Create a new hub for each hub/maker ip. You can send each to a different InfluxDB database.
- Run hubitat-maker-to-influxdb, watch the logs.
Place a config file in: ~/.hubitat-maker-to-influxdb/config.json
config.json example is:
{
"local_config" : {
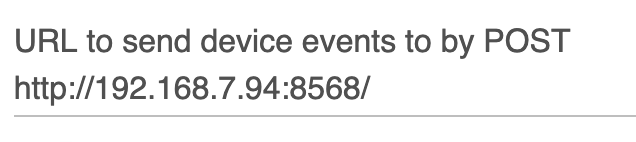
"local_url": "http://<ip address of nodejs server>",
"influxdb_port": 8086,
"influxdb_host": "127.0.0.1",
"influxdb_db_name": "hubitatMaker"
},
"hubs" : {
"homeTester": {
"url": "http://<hub-ip>/apps/api/<maker-app-number>",
"token": "<ACCESS_TOKEN>",
"influxdb_db_name": "HubitatTester"
},
"home": {
"url": "http://192.168.7.97/apps/api/769",
"token": "abcd-12345-etc",
"locationName": "Home",
"locationId": "0",
"hubId": "0"
}
}
}
0.1.7 released
I've updated the npm version to 0.1.7 this adds:
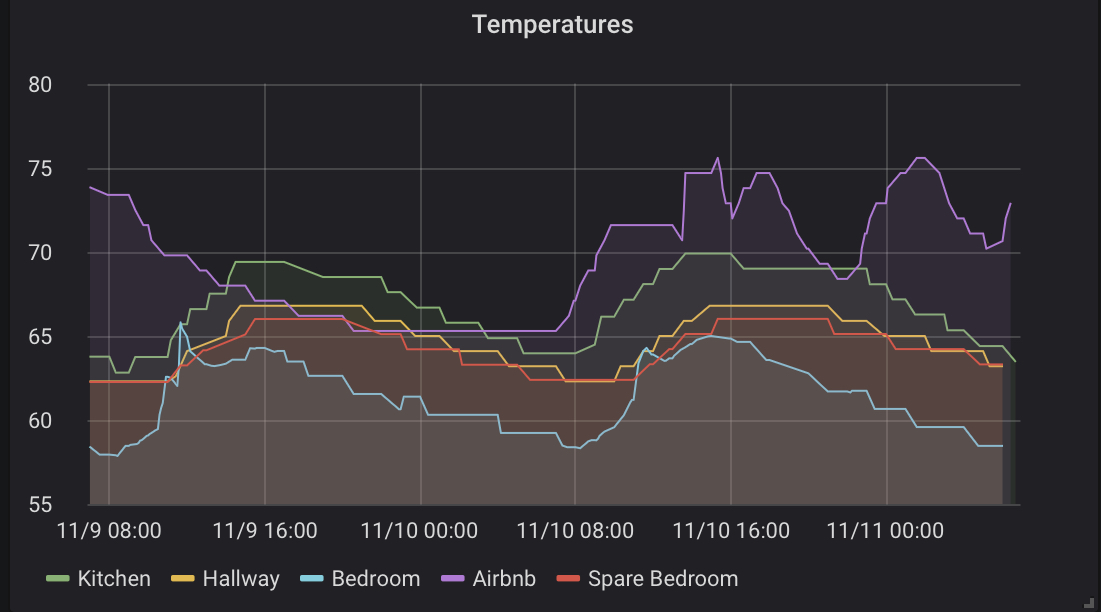
- Repeats the last value every 30m if there's no new events. This helps when you zoom in on grafana for devices that don't generate many events.
- Added metrics on events and measurements that update every 5 minutes.
- Some bug fixes, and support hsm and sunsire/sunset events.
New Metrics about nodejs app:
-
measurementEvent: Number of events of a certain type for the 15 minute interval. For example for 1 power (watts) report from a Zooz meter, and 2 power reports from a Zigbee power meter would mean there were 3 power events. -
deviceEvent: Number of events of all types fordeviceName. For example if your Zooz Power meter sends 2 power events and 1 energy events deviceEvent for it would be 3. -
measurementDeviceEvent: Number of measurements types for a single devices. For example 2 power reports from your Zooz power meter would be 2power Zooz. -
appEvents: 3 different metrics,totalEventsis the count of all events from all devices.influxDBPostsis the number of calls to influxdb, this should be less than the totalEvents, since multple hub events are combined into 1 influxdb call.influxDBErrorsis the number of events sent to influxdb that were not imported properly and generated an error.
Why?
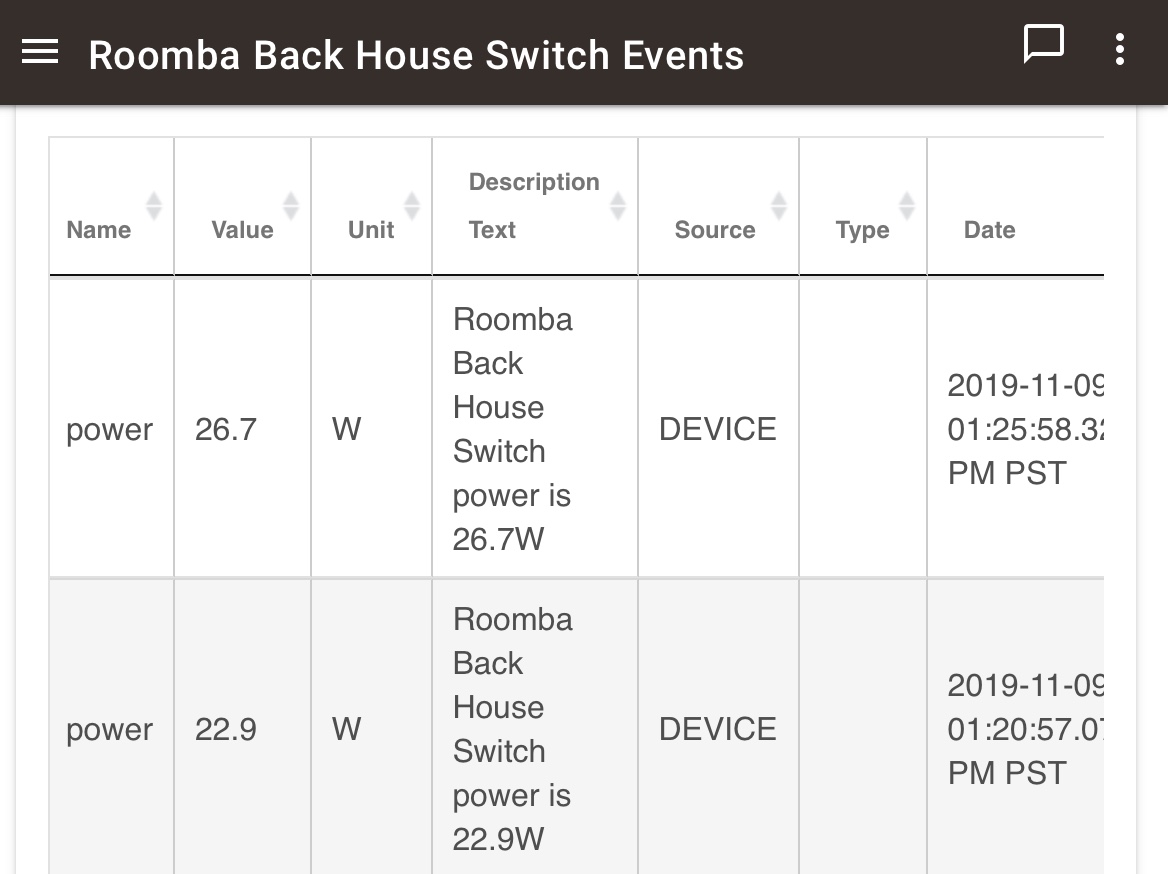
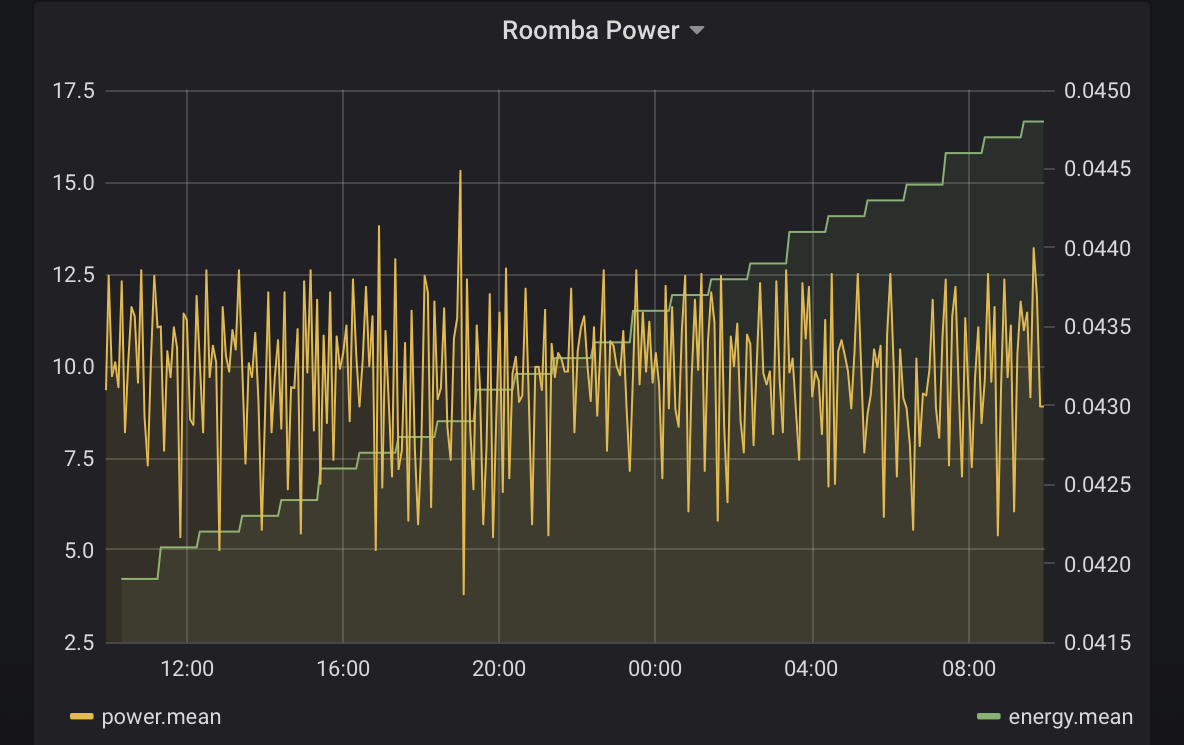
Both measurementEvents and deviceEvents are good to find out if you have a device spamming your hub. This is pretty easy with some power meters when set to very low notification thresholds. I can see hub latency increase/be more variable when I had a power meter on a roomba reporting updates every few seconds. Turns out the roomba switches between ~0 watts and 20watts every couple of seconds. Is this important?
*) Though I think recent changes have surely solved this potential problem by bulk sending InfluxDB events.