There are many Dashboard threads, and several "how-to's". The intent of this post is to showcase a few small things that can greatly improve the overall Hubitat Dashboard experience. At the end we will also give a few other well known options in case the HE platform still does not meet your needs.
The Hubitat Official Dashboard documentation does a great job covering the basics, of installation, and creation of the Dashboards app. If you have never used, or do not have the Dashboard app installed, please review it as we will not be redoing that information here
Use all your devices - ( Apps > Hubitat® Dashboard > Click on any one of your dashboards )
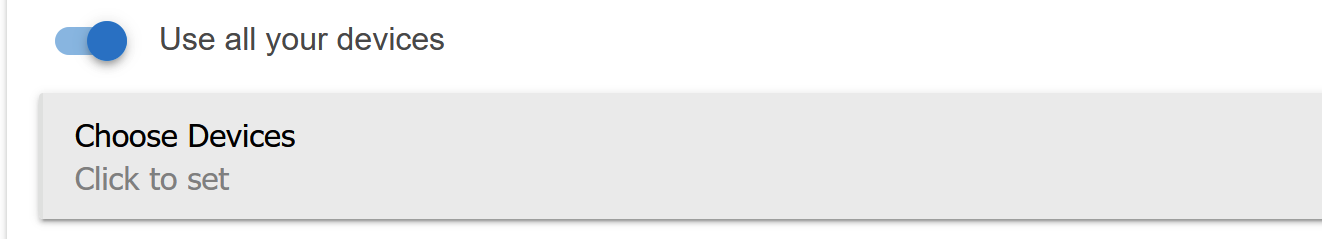
During design and testing it is OK to leave this 'Enabled', so that you can add device tiles at will. However once you are done designing your dashboard this option should be 'Disabled'.
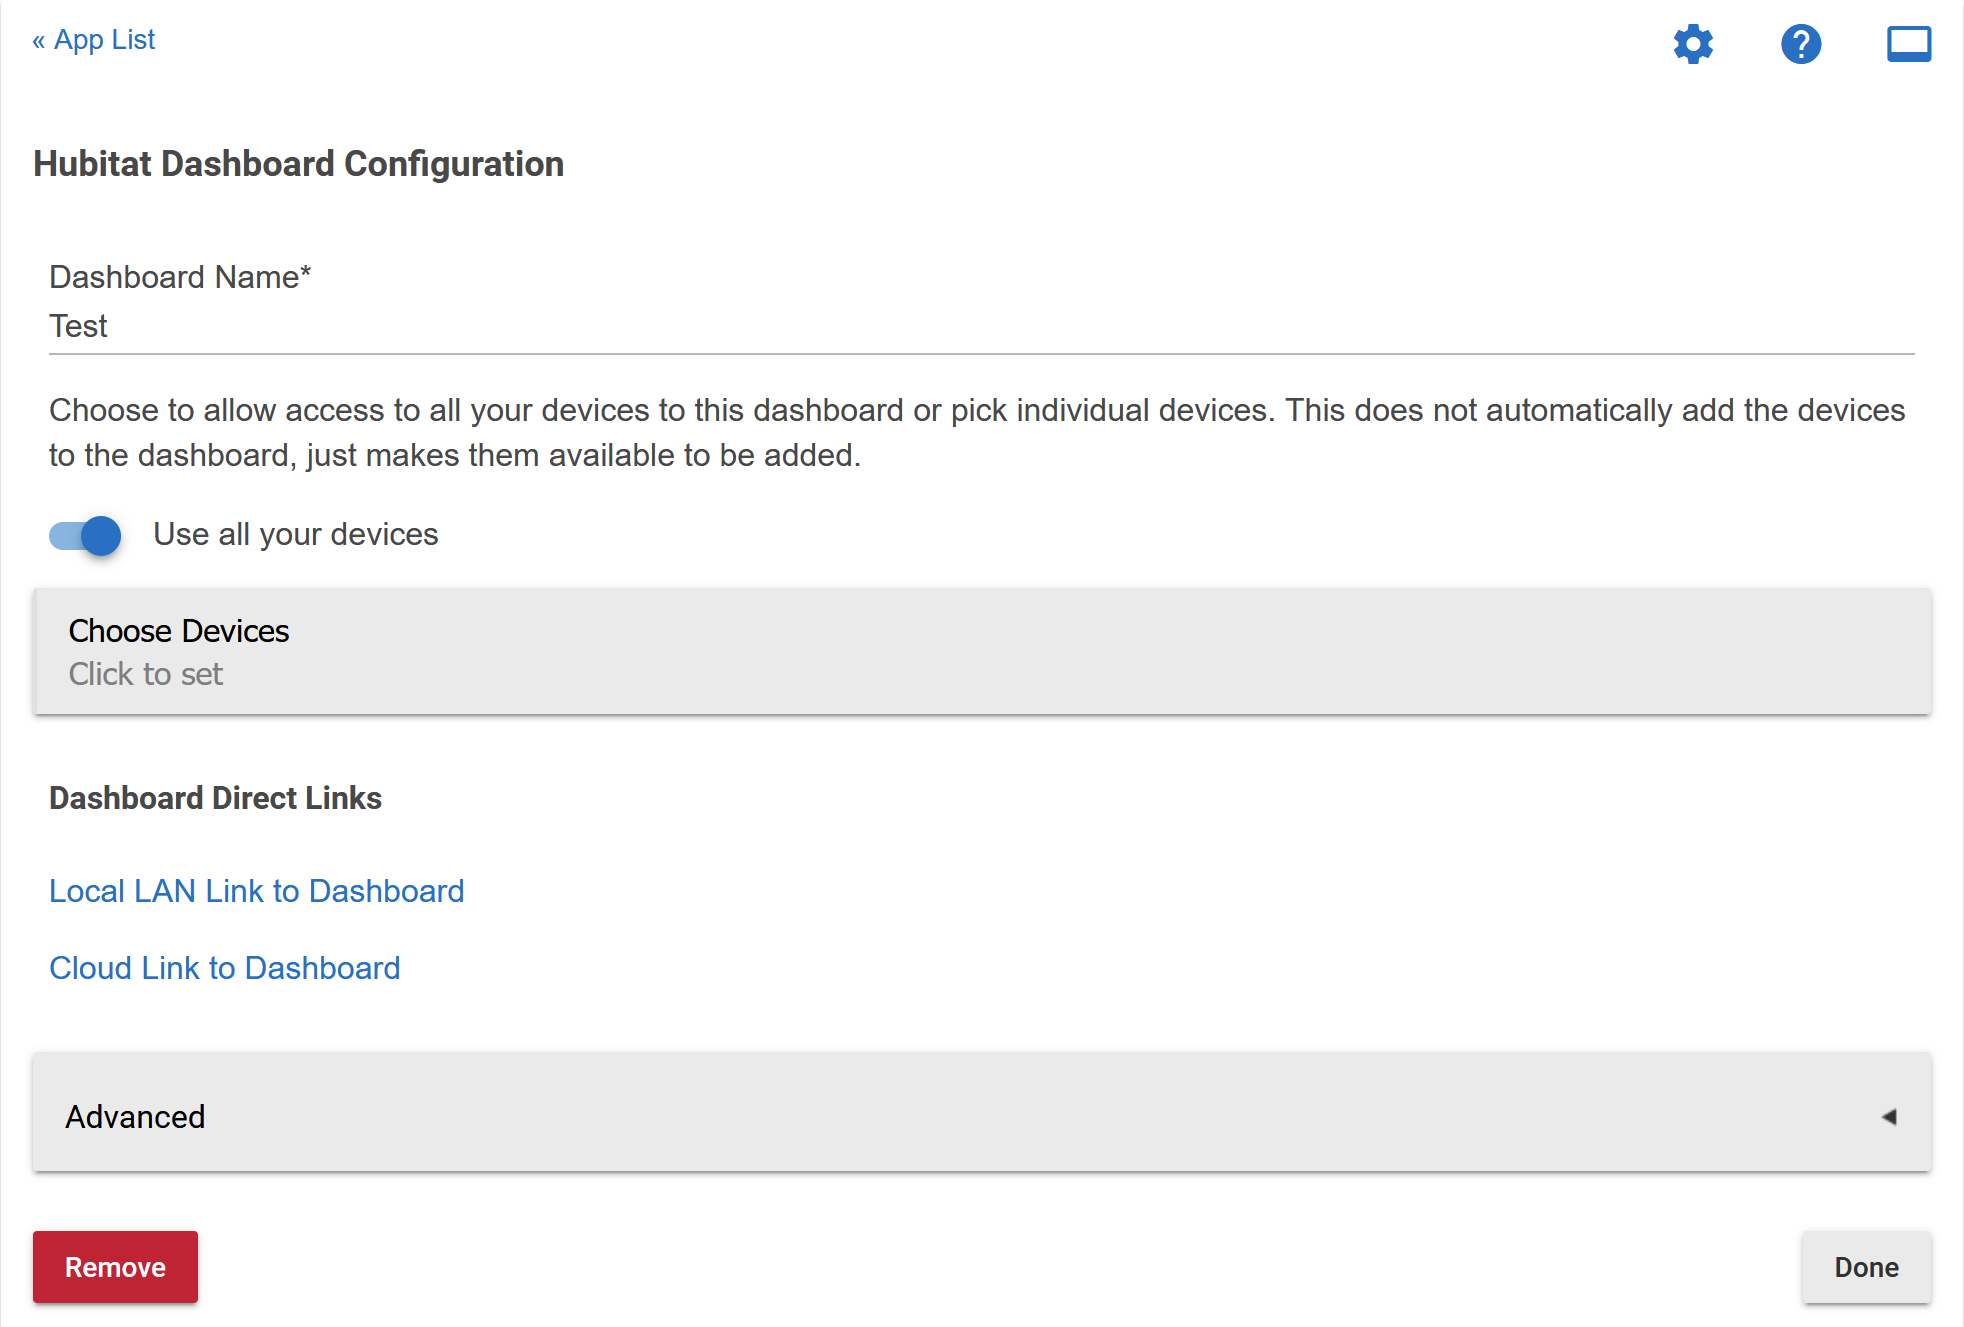
Once 'Disabled' you MUST click on "Choose Devices" and select each device you are using on a given dashboard. If you do not select a device it will not work (displaying a ?). If you have less than 15 devices in total (not just on the dashboard) this may not be needed, but is recommended.
Before
After
If this options is enabled the hub will check every device before displaying the dashboard, even if a device is not present on the dash. This can create delays, and even cause the page to get stuck displaying "Loading Devices".
NOTE - With this option 'Disabled' you will not be able to add new tiles to the dashboard until you add that device to the list of used devices.
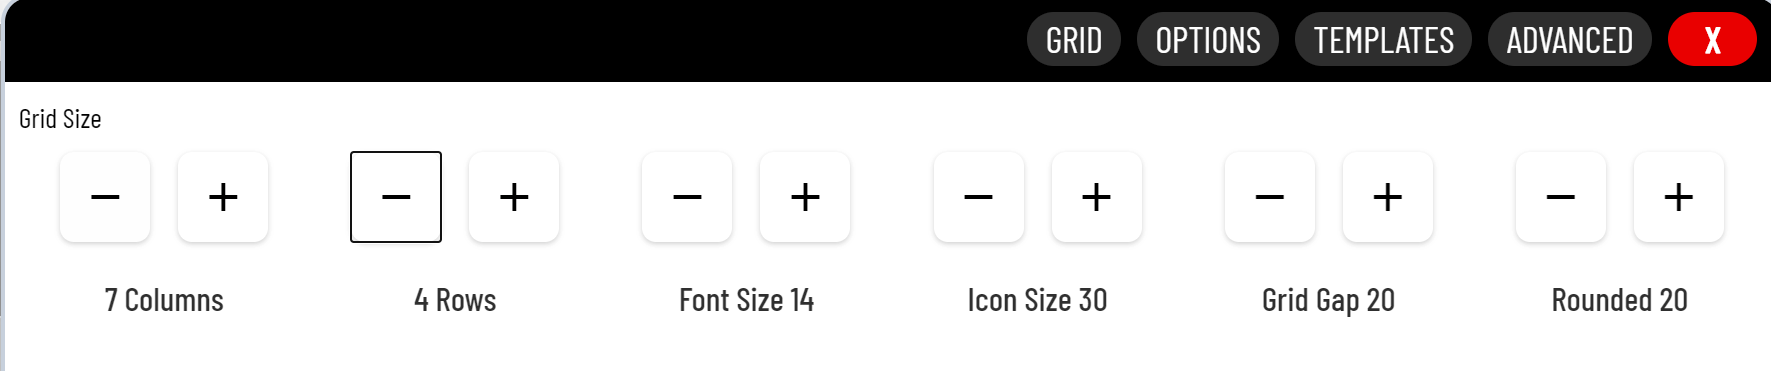
Grid Columns and Rows
The amount of columns and rows available on the gird is set in the Options (gear icon). This comes in mostly when adding new tiles. The system will automatically chose the next tile location given the settings below.
When adding a new tile, be sure you are placing it's location on a green tile. If you see a blue tile, that means you will be overlaying an existing tile (shown below). If no more green tiles are available you will need to adjust the grid settings above.
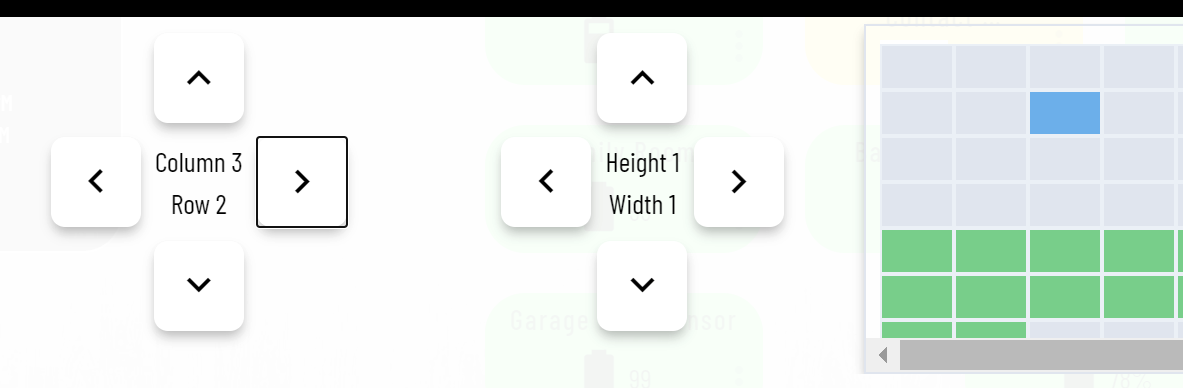
The system will allow you to place tiles outside the grid setting, so this is not a limitation. It's just very helpful when placing new tiles to make sure they do not overlap, making it harder to adjust afterwards.
Dashboard access - There are several ways to access the HE Dashboards outside of the HE app. Using a browser to go directly to a dashboard can be faster then navigating the app. The documentation above shows how to access those links via the HE menus, below is another way .
Note - this will create a local link if you are local, or a cloud link if you are not on your Wi-Fi. Please see below for information on which one to use.
Open the app, and clicking full screen button
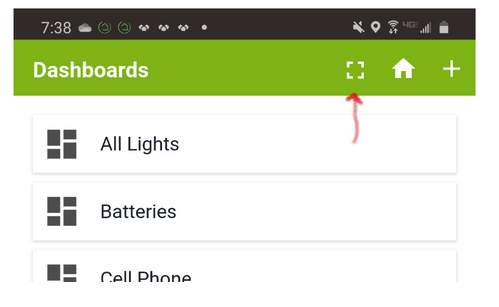
Then click your dash to open it in your default browser. For Chrome/Android click the 3 dots and then "Add to Home Screen". For iOS Click the Safari icon to open the page in Safari, then click the share button and finally "Add to Home Screen". Doing this will remove the URL header, and the Hubitat footer, to give you a much cleaner looking dash. It will also go directly to that given dashboard improving the user experience.
Local/Cloud - In the dashboard app (shown in documentation) you can link to both a local and cloud dash directly. It is not recommended to use Cloud dashboard link while on the home LAN. This will create extra traffic on the hub and can potentially create slow downs, and lock ups. When you are on your local WiFi be sure to use only local links on all devices. This is mostly important when using links outside the HE app as describe above.
There is no limit to how many links you can have on your device (you can even create a folder for them). If your device is going to be use both Local and Cloud, it is recommended to use separate links if going "direct to dash", and not through the HE app. You can still use both interchangeably.
Backups - Once you have spent any decent amount of time building your fabulous dashboard you need to backup your hard work. Thankfully this is easily done. On each dashboard click the gear icon, and then the "Advanced" tab. There you will see the "Layout" tab shown first as displayed below.
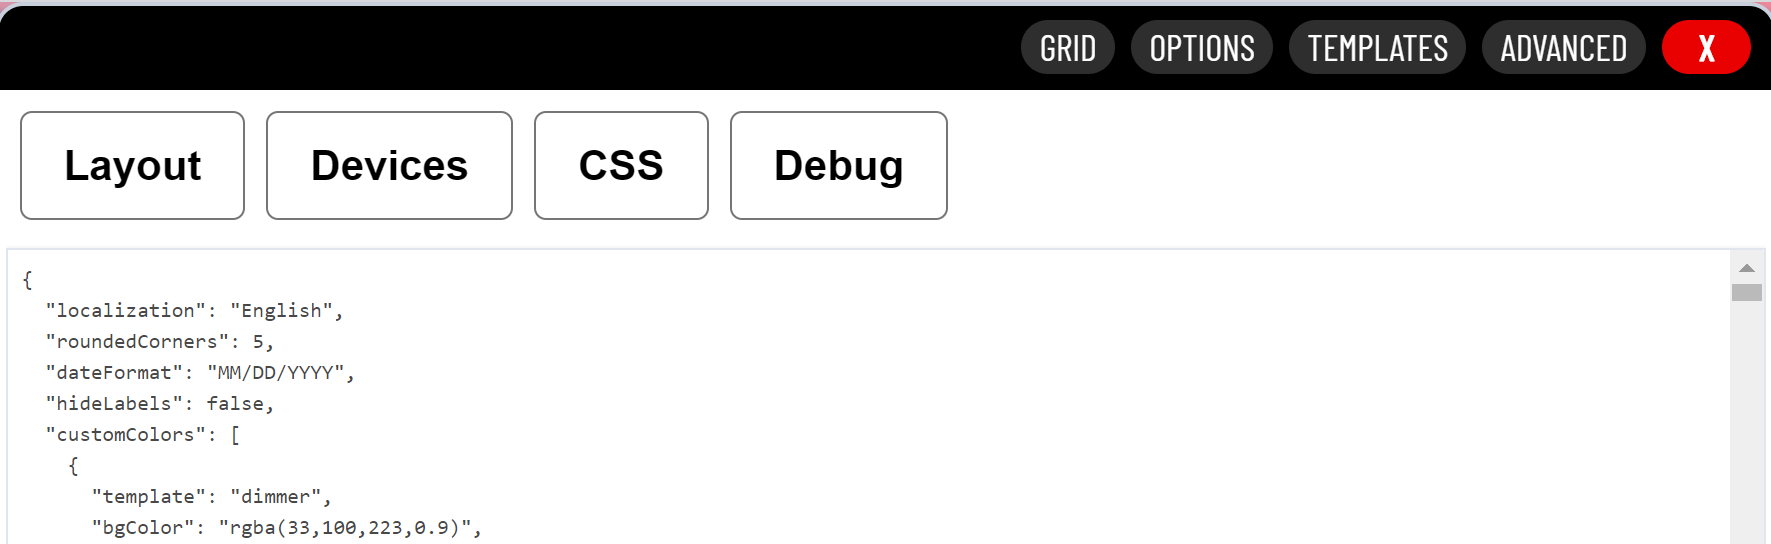
Highlight/Select all the text in the tab and copy it to Notepad or other text editor. That "Layout" contents is called the JSON. The JSON contains everything needed to recreate your dashboard in case of an error/mistake/crash down the road. I highly recommend making a new copy of your current JSON before making any major dashboard edits.
Look and Feel
There are many solutions for making dashboards look and feel much better than they do when you first begin with app. Below are somethings you can do both on and off hub to make great looking dashboards.
CSS Editing - For raw editing with no 'add-ons' HE allows CSS entries and they are the best way to completely customize your dashboards. I credit much of what I know about editing CSS to my friend @spelcheck and this thread. If anyone using HE dashboards needs help with custom CSS, I'm happy share what they both have tought me. Feel free to tag, or send me a PM.
Lastly - an oldie but goodie...
Show Off Your Dashboards thread - There are tons of ideas to see and platforms to explore on this thread. This is a good place to just look and see what is out there, and possibly find a platform the speaks to you.
Thanks - special thanks to @spelcheck @neonturbo @josh @kewashi for their help and contribution to this post.

