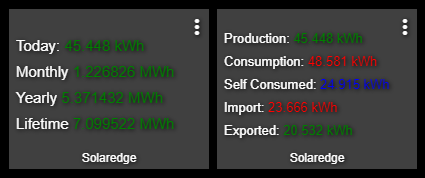
I'd like to share a driver I recently created to monitor a Solaredge inverter and site overview usage. It is capable of displaying the individual metrics or it combines inverter and site overview into their own individual tiles for easy visualization.
Awesome work, thanks for developing this. I've installed the driver and can see my details coming thorugh in the device screen. Will add it to my dashboard shortly.
With the refresh frequency, i.e. 10, 20 or 30 minutes. Is there a way to disable the automated refresh. I'm thinking setting up a rule to refresh during certain times, or only on demand using a button on my dashboard may allow me to reduce the api calls to keep under the 300 limit. Just a thought...
Site ID is available when you login to the monitoring interface at https://monitoring.solaredge.com/. For example, https://monitoring.solaredge.com/solaredge-web/p/site/19191919/#/dashboard, in this case the Site ID is 19191919. Or from the same page on the right hand side which has some other site information.
Are you able to get the current consumption by the house, i.e. rather than the daily total consumption? If you are using the Solar Edge App, I am thinking of the 3 figures in the graphic showing the current panel production, house consumption and then whether power is being drawn from the grid or fed back into the grid.
I'll see if I can add it this week. Probably as an optional thing. Because that measurement is never constant like all the others and with each call you will get a different reading. It would only be useful if being called every minute, 5 minutes max. Which would quickly burn up the API rate limit.
Added the ability to query the current power flow status. Which contains the PV, load, and grid metrics.
Made the three metrics calls optional and with their own refresh time. For example, you can refresh some data every 15 minutes, the second every 30, and the third not at all.
Great work @funzie, got the driver updated and can see the status coming through.
I have setup the load data to refresh every 15 minutes and now I will look at setting up a button on my dashboard to allow me to refresh this load data 3 or 4 times over a 30 second period, giving me a similar experience to opening the Solar Edge App without needing to update the data that frequently on an ongoing basis.
I noticed the new grid power figure displays the same red, positive figure whether I am feeding into the grid or drawing from it. Would you consider comparing the pv power and the load power and then record the grid power as a positive or negative number? Perhaps even displaying the grid power as green on the power tile when exporting power but red when drawing power?
Updated. The power flow should register as green for the grid when there is a surplus of energy. I also added it as a package with the Hubitat Package Manager to allow for easier updates.
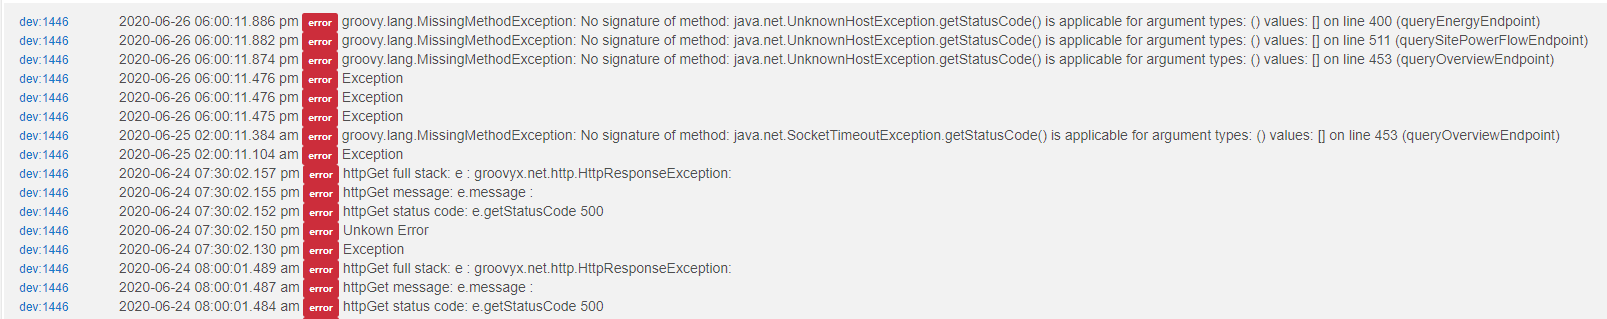
Hello @funzie. For the most part the driver works well, give me all the information I need. But, I have been observing in the logs, it is giving me several errors. I would like to resolve this. Any assistance would be helpful.
I'll take a look at my logs to see if I have the same. The thing is that 500 error codes are on the server side. So they would be an issue on Solaredge's sides. But let me see what I can dig up regardless.
Going of the log errors I am able to replicate. I've noticed the same 500 error only with the site power flow requests. So the live values for what the system is generating, using, and exporting. My errors are always a the top of the hour. So at 8:00 or 9:00.
Without looking at Solaredge's site code it's not possible for me to resolve this issue as it's coming from their servers. I could open a ticket and see if they can do something to resolve the issue.
What I can do make the error more sensible. Right now it's falling into the catch-all section since I don't specifically look for the error. I'll setup and exception for it an improve log output to be a bit more helpful in debugging. Gonna try and push that out today if not over the weekend.