Hi @funzie,
I had a battery added recently to my setup, do you know if you can get any extra readings out for the battery as part of the SolarEdge API? I'm happy to take a look if you want....
Simon
Hi @funzie,
I had a battery added recently to my setup, do you know if you can get any extra readings out for the battery as part of the SolarEdge API? I'm happy to take a look if you want....
Simon
Is there anyway to get this tile to show up on sharptools?
If I remember when reading the documentation the battery value was returned, but I've got to double check.
I'm not familiar with Sharptools.
You could add capability "Sensor" into the metadata section of the driver and then you can authorize it manually as noted here:
Funzie:
None at all, go ahead. Truth is I haven't had the time to work on the requests and won't for at least another two or three weeks.
Hi @martine,
I would love it if you could get the battery outputs going, thanks for offering to take a look. One thing that I think may happen in the solar edge app, i.e. the one they they release for mobiles / tablets, but I have not confirmed this is it may double count charging of the battery and discharging the battery as "system production". If you notice any figures that may divide this up or you can disprove my theory that would be great. I'm also happy to test this and any updates you make more generally.
Thanks again,
Simon
Curious if I am missing something or if my system simply does not support the power flow data. I don't get anything but zeros for the in and out. Only my production data appears.
I've got a SE3800H.
Anybody else having the same issue?
You need to have some type of energy metering module. Either a WattNode or Solaredge's version of the WattNode. That is what measures the import/export. The inverter itself only knows what it produces.
For the last two or three days, the driver is not reporting cumulative production and consumption for me. Was working well for months.
I'm still getting current production and consumption. Anyone have this issue?
I was checking on this today and I was unable to find any issues on my dashboard. I vaguely remember an alert from their web monitoring portal about some updates happening in the last few days. I assume they were big updates since they mention the platform would be down.
What do you get when you manually run the updates from the device page? Any insights when you enable debug?
Hi @funzie, like you saw, being playing around with the solar Power Flow data again today. Had a couple of minor aesthetic changes I was thinking of, no dramas if you can't for any reason....
Thanks,
Simon
I did those update this morning, you can find the code on this link -> hubitat-solaredge/solaredge-driver.groovy at 09c39e17ad0845d71e341807e485d564ac70277b · funzie19/hubitat-solaredge · GitHub, if it works as you requested let me know and I'll merge it with the official release.
Thanks for the quick turnaround, I'll take a look later today and let you know what I think.
Simon
It was close....
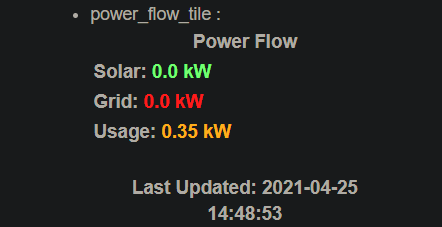
The Usage turning Orange is what I was after, showing I am drawing power but not from the Grid or not entirely from the Grid.
But I was wanting the Grid result to be Green when it reports as zero. If you had put that in and need some info from me to try and debug it, let me know.
I'd be happy to see this checked in as is and you can look at the Grid change another time if you need / want to....
Thanks again,
Simon
I was looking into this today. It works to set the Grid value to green, but only if there is no battery backup. In your case, you are pulling in power from another source. I also looked at the API again today, seems like they have made some updates that I can take into account which will make displaying direction of power flow easier. I just need to get some sample data to program with. Which I'll hopefully include in a future release.
Thanks for looking into this, it sounds promising. No rush on my part, if you need any details from my system or want to run an early version to get some logs I'm happy to help out.
Simon
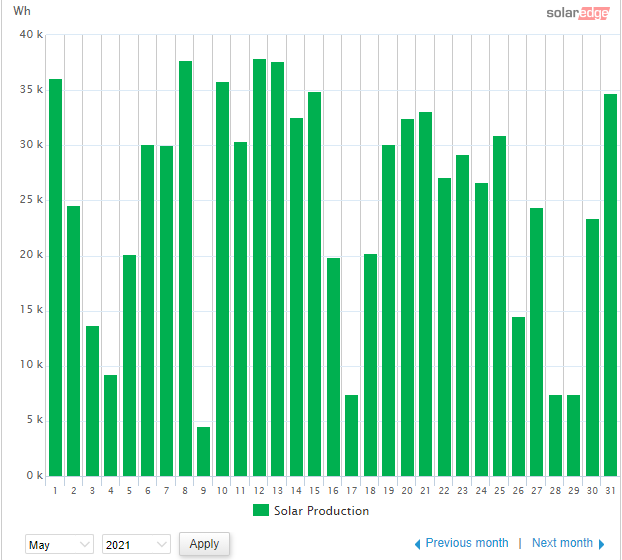
Does anyone know how to use this output to Hubigraphs to create a rolling 7-day production graph?
I'm trying to create a rolling 7-day graph of this data.
I was looking at last_day hoping that it would be the total production for the previous day, but it appears to be the total production for today.
Correct, in this case it's for the current day. I'm not familiar with Hubigraphs, but take a look at the SolarEdge API and you should be able to get the last 7 days with just one API call. Just set the date range for the last 7 days.
Download the Hubitat app