Using graphs in webCoRE

in the latest release of webCoRE there is a graphing capability based on hubigraphs.

Announcement:

It does require the latest HE 2.3.2.140+ firmware for all features to operate.

  • New experimental feature is ability to do graphs for both devices and fuel streams.
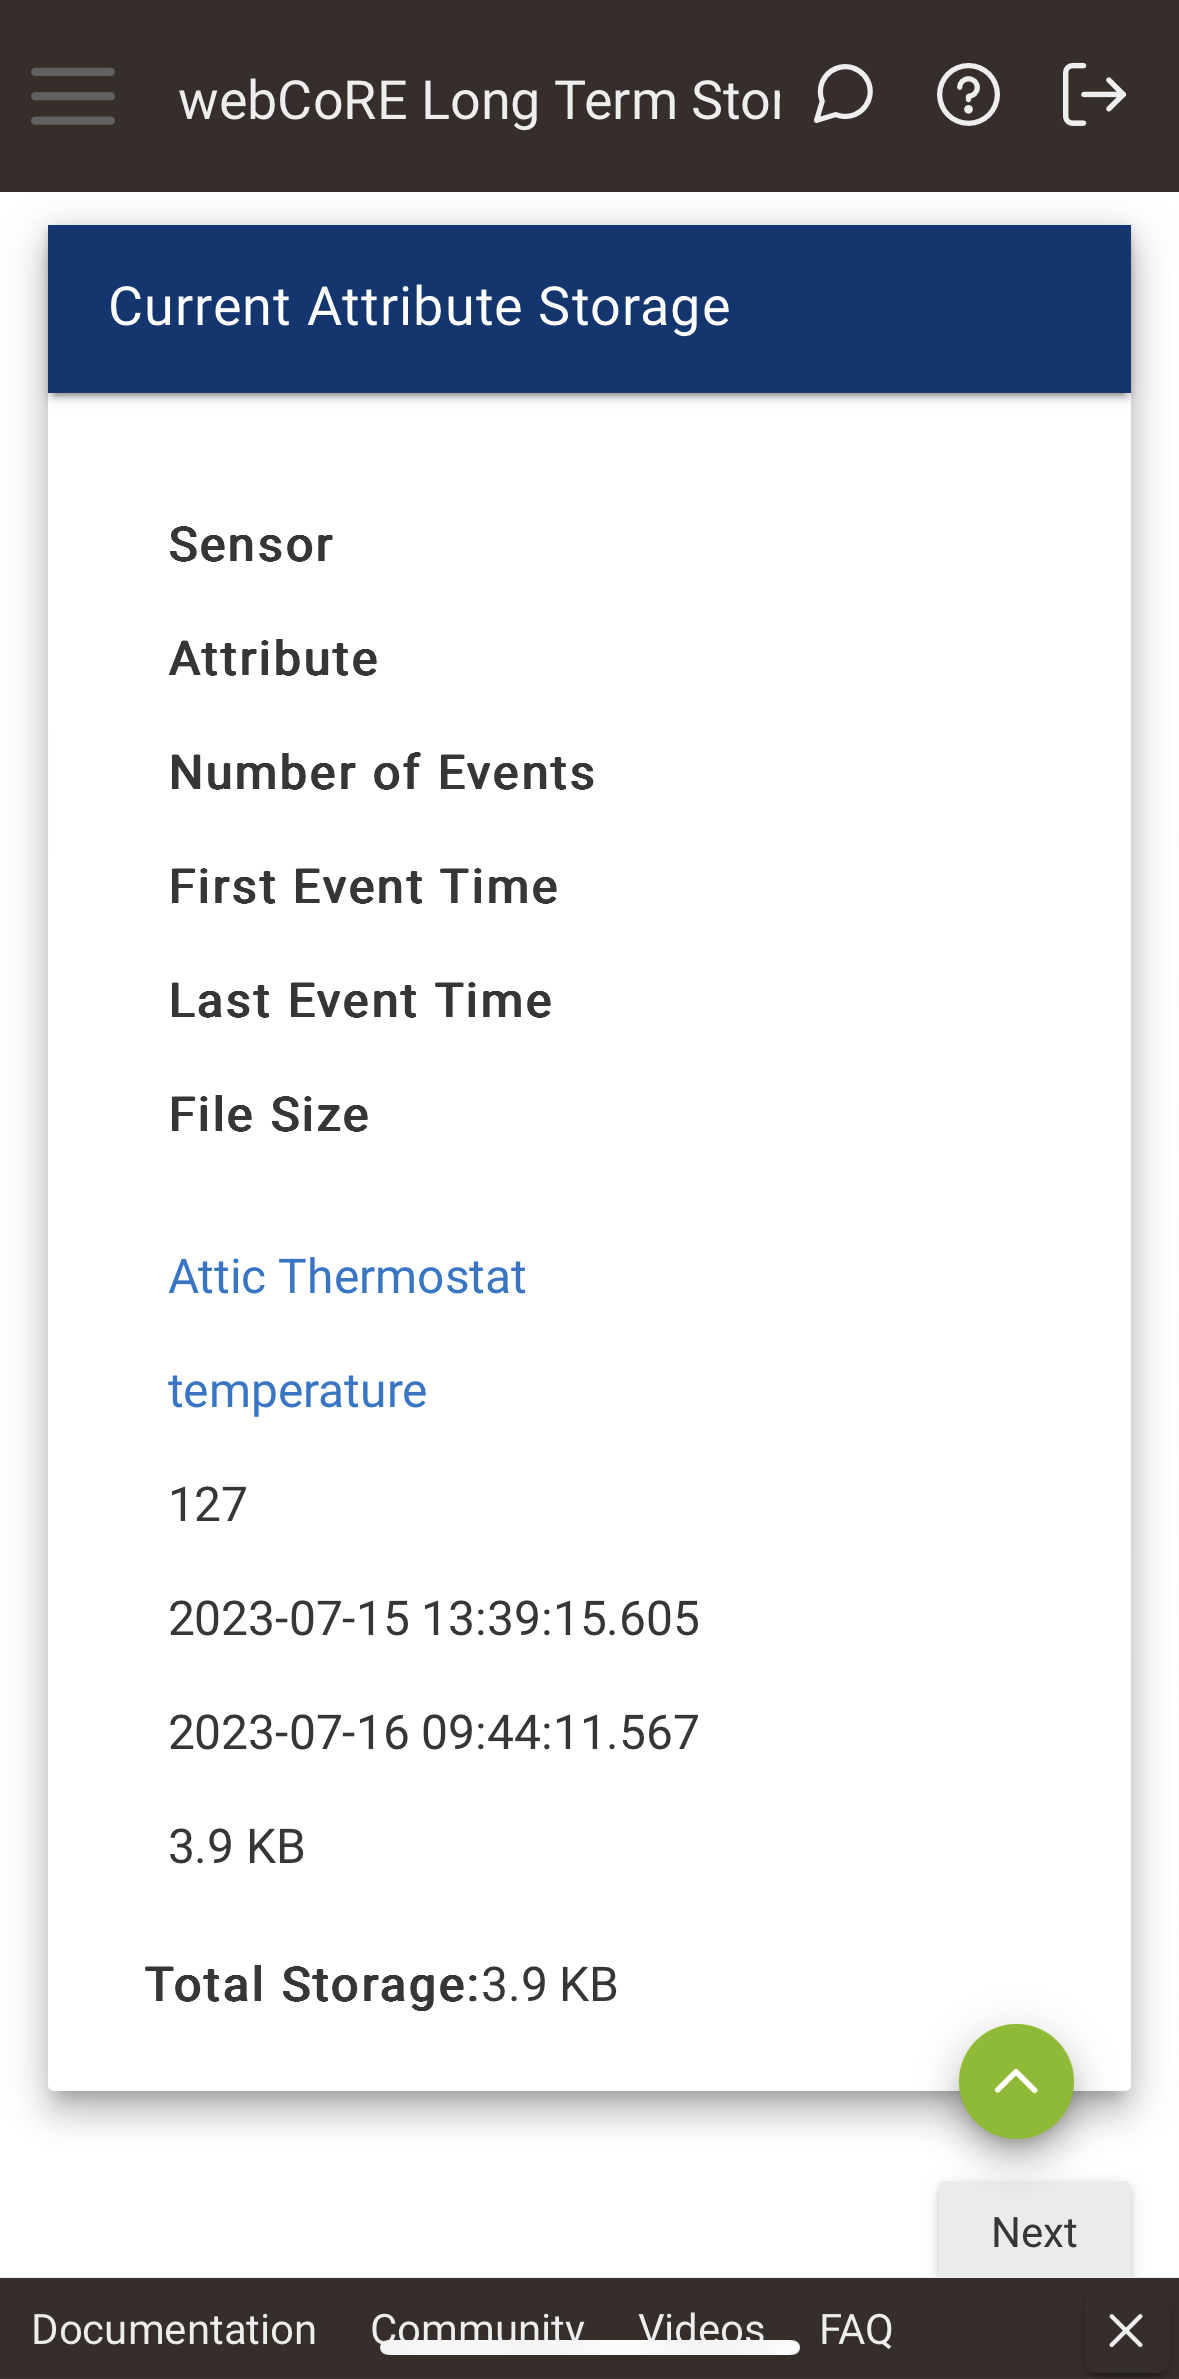
    • has ability to create long term storage for device/attribute data

      • if you have existing hubigraph LTS files, you can create a new long term storage in webcore for the same device / attribute, then you can place the existing data from the hubigraph file into the new file created by webcore for that LTS, and webcore can automatically read the old data and put it into the new more efficient format.
    • can graph fuel stream data (typically that is numeric)

      • this allows you to create arbitrary data for graphing
    • quantization can be applied on selected graph data sources, without having to create a new LTS just for quantization.

    • can create a tile device for use in dashboards

    • you can duplicate graphs you create in webcore if you want to have a new one starting with an existing one.

    • Thanks to the testers of this

    • there may still be issues and more things to implement.


Details on graphs, fuel streams, etc

The data source for graphs can be

  • device data (from HE DB)

    • device data and LTS file data maintained by webCoRE (this is done automatically if device is selected and there is an LTS associated with it)
  • fuel stream data

These data sources can be further processed via quantization when they are selected for use in a graph.


So what are these things:

  • LTS in Hubigraph meant Long Term Storage. Depending on the graph you are using, if you only rely on data in the HE DB for your graph, HE trims the DB regularly to improve performance and reduce resource consumption

    • this of course can trim data in your graph which you may not like/want.

    • do note that the hub should store data in the db longer than the LTS setting for "Store Data Every X Hours". Ideally at least 2X this time settings.

  • LTS is the ability to have the data stored longer in files on/in your hub.

    • Webcore has a form of LTS (more cpu and storage space efficient), Folks that were using Hubigraphs with LTS may want to keep their historic data. webCoRE can read the old format and will update it to the new smaller format

      • this means create the new LTS in webcore; then manually 1 time put the data from your old hubigraph LTS into the new webcore LTS file. (this is download your old file and new webcore file, edit/merge, and upload to the new webcore file your merged changes.
  • Fuel streams are a way webcore pistons can create custom data sets. Hubigraphs allows you to use existing device data (and perhaps keep longer durations with LTS). It has some quantization capabilities, but that was kind of a mess in that some quant functions need complete data sets for a duration to accurate quantize. You were also limited in types of quantization.

    • quantization is now part of the graph processing, so you can use the same input data (device, LTS, or fuel stream) and then apply quantization as wanted on each graph data set (so you no longer have to create a bunch of different LTS with different quantizations as hubigraphs did)
  • a fuel stream allows piston to create any data set it wants, and the graphing can use either device data or a fuel stream as input for the graph (or both depending on graph). In short now you can have graphs of custom data (vs. only device data).

    • you don't have to use fuel streams for graph data, only if you need to.

Using graphs

  • install webcore (HPM is easiest)
    • if you wish to setup LTS (now or later):

      • then go into the webcore app (HE console -> apps -> webcore), and scroll down to 'graphs', you can then create one time an LTS process if you want to use LTS

        • you can customize the LTS for what devices you want it to create longer storage.
      • You can add or change LTS anytime you wish
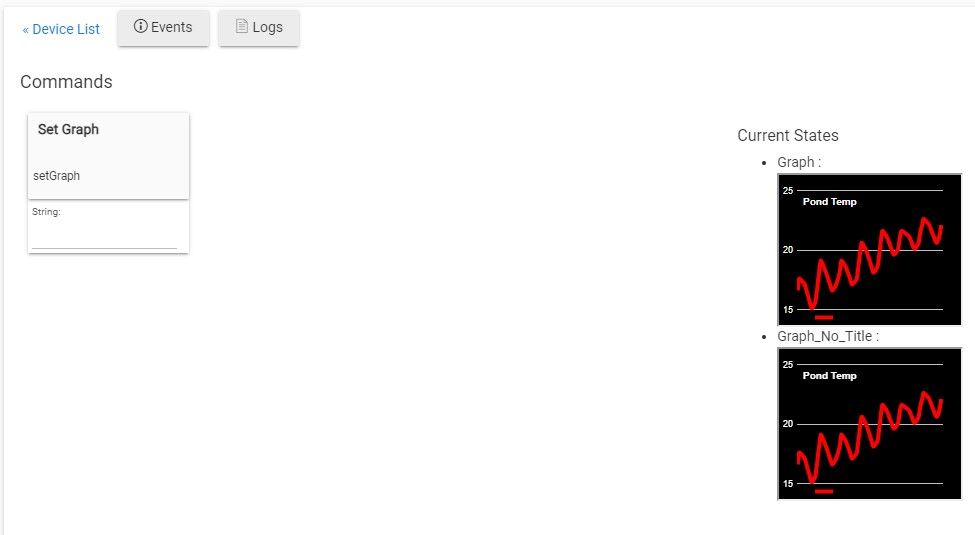
    • To create graphs

      • go into HE console -> apps -> webcore -> graphs and you can start creating graphs

It is common when you create graphs that you want to use them in tile on an HE dashboard. In the graph setup/configuration you can have a tile device created for the graph if you need it.


Couple of things to note

  • LTS are files in the Hubitat hub (HE console -> settings -> File manager)

    • these files are not backed up when you perform an HE backup

      • if you think this data is precious, you need to figure out how you want to back it up

8 Likes

reserved

2 Likes

Could you please show a working example/workflow? I've tried twice to set this up on my C-7 to no avail, and it's unclear what I might be missing. Thanks!

2 Likes

I've tried a few times. I'm useless at it.

1 Like

Before you start this example make a temperature sensor available to webcore via main webCoRE app

Step 1

  • Make sure your webCoRE is up to date and all modules are installed
    • you need to have the webCoRE Fuel Stream module installed as the graphs code is in that module

    • HPM modify on webCoRE

      • you want to ensure webCoRE Fuel Stream is installed
      • you want the webCoRE Graphs Tile Device installed
    • do an HPM repair to ensure webCoRE is up to date.

Step 2:

Then go into webCoRE (HE console -> apps)

  • Select "Graphs"

    • click on "List of streams and graphs / create a new graph"

    • pick "Gauge"

      • select "Enable API", then Done

      • if you have a temperature sensor available to webcore:

        • click on "Select Data Source(s)"

          • pick your temp sensor
          • done/next your way to where you can select:
        • click on "Configure Graph"
          - you can set up ranges for the gauge to show colors
          - next done your way back

  • you should see the graph

  • you have the graph installed to a tile device (to use in a dashboard)

  • Ensure you "done" all the way out to save all your changes.

1 Like

It would be nice if there was a way of getting these graphs to show up in SharpTools.

@Prometheus_Xex I haven't personally tried this, but it sounds like the app might be writing HTML to a device attribute.

If that's the case, you can use the Hubitat HTML Attribute Display custom tile in SharpTools to display the attribute. One side note is if the embedded HTML is accessing additional resources from the hub, those would need to use secure URLs (https).

Alternatively, if the app provides a direct secure URL (https) to view the charts, you could use a URL Custom Tile.

1 Like

Thanks Josh... I'll poke around. If you ever get the chance to try it yourself... please post your results. This would be great for a graph of my pond temps. :slight_smile:

@josh ... seem to be getting closer. It produces a device with the graph in it, but the URL it also produces is only local unfortunatly. (http://192.168.0.205/apps/api/xxx/graph/?access_token=119ff685-xxxx-8d6c-xxxxxxxxxxx)

Perhaps @nh.schottfam would be open to the idea of adding an option for using the Hubitat Cloud endpoints?

In the meantime, I suspect that you could construct the URL yourself based on the existing URL you have. IIRC, the format is:

https://cloud.hubitat.com/api/{hubUID}/apps/{appId}

You can get the hub ID from your Hubitat Settings β†’ Hub Details. So your final URL would look something like the following (which you could use in a URL Custom Tile)

https://cloud.hubitat.com/api/{hubUID}/apps/{appId}/graph/?access_token=119ff685-xxxx-8d6c-xxxxxxxxxxx

Of course, this depends on how the graph itself is internally generated. If it references other 'local' hub resources, that could make it a bit more complicated and in that case, the app itself would likely need to offer the cloud option so it updates all the resources accordingly.

1 Like

Many graphs 'auto update' (from web browser to HE), so the cloud endpoints are likely not to work for these autoupdates.

Also HE is not doing compression from apps to browser, so it can send a lot of data.

Hopefully soon there will be compression on the endpoints to help with this.

Still stuck.

Ideally I'd like to see temperature/time graph for the past say, 7 days. Maybe in 30 min segments.

I've never been able to get my head around it.

So, my question on this is if you create an LTS for a sensor/device, do you need to select something special for the graph or just if you select that sensor/device the LTS data is used?

If you create an LTS and want to use it in a graph, select that device:attribute in the graph as the input.

  • ie webCoRE will figure out if there is an LTS for that device:attribute itself

If you do not create an LTS, it will use the device data in the HE db

A graph can have both device (with LTS if enabled) or fuel stream in the same graph

Where are LTS listed? Not seeing it as a graph input - only sensors.

LTS is called a Fuel Stream in webCoRE (ie an LTS creates another fuel stream)

So they should show up in the graph apps

"Select Data Source(s)" -> "Data Source Selection" see Fuel Stream

This may be different depending on source, but for what I was trying to graph (illuminance from openweather) you just select the sensor/input and it says it has LTS activated during config. Initially I missed it due to selecting two different sensors (one w/lux vs one w/o lux at the end of the number). It actually couldn't be setup as a Fuel Stream.

I created an LTS but it does not show up as (1) a fuel stream or (2) as a data source for a graph. In the graph settings, under data sources, it says that no fuel streams are available. However on the main graph settings page, I do see that the LTS was created.

Any pointers?

need to show more settings.

creating the LTS app does not create a fuel stream, you still have to define them in the its app.

How do I define them in the lts app? I only see two options:

1-Select Device/Data
2-Configure/Report Data Storage

Under #2, I just see a list of Current Attribute Storage and the only thing I can click on is the name of the device and the attribute I am generating LTS from. Clicking on them takes me to a text file/report.

Otherwise when I go to WebCoRE -> Settings, Local Fuel Streams is enabled. When I click on Fuel Stream Settings, I can see WebCoRE long Term Storage show up under the list of Fuel Streams. Clicking on the LTS takes me to the same settings page I screenshot above.