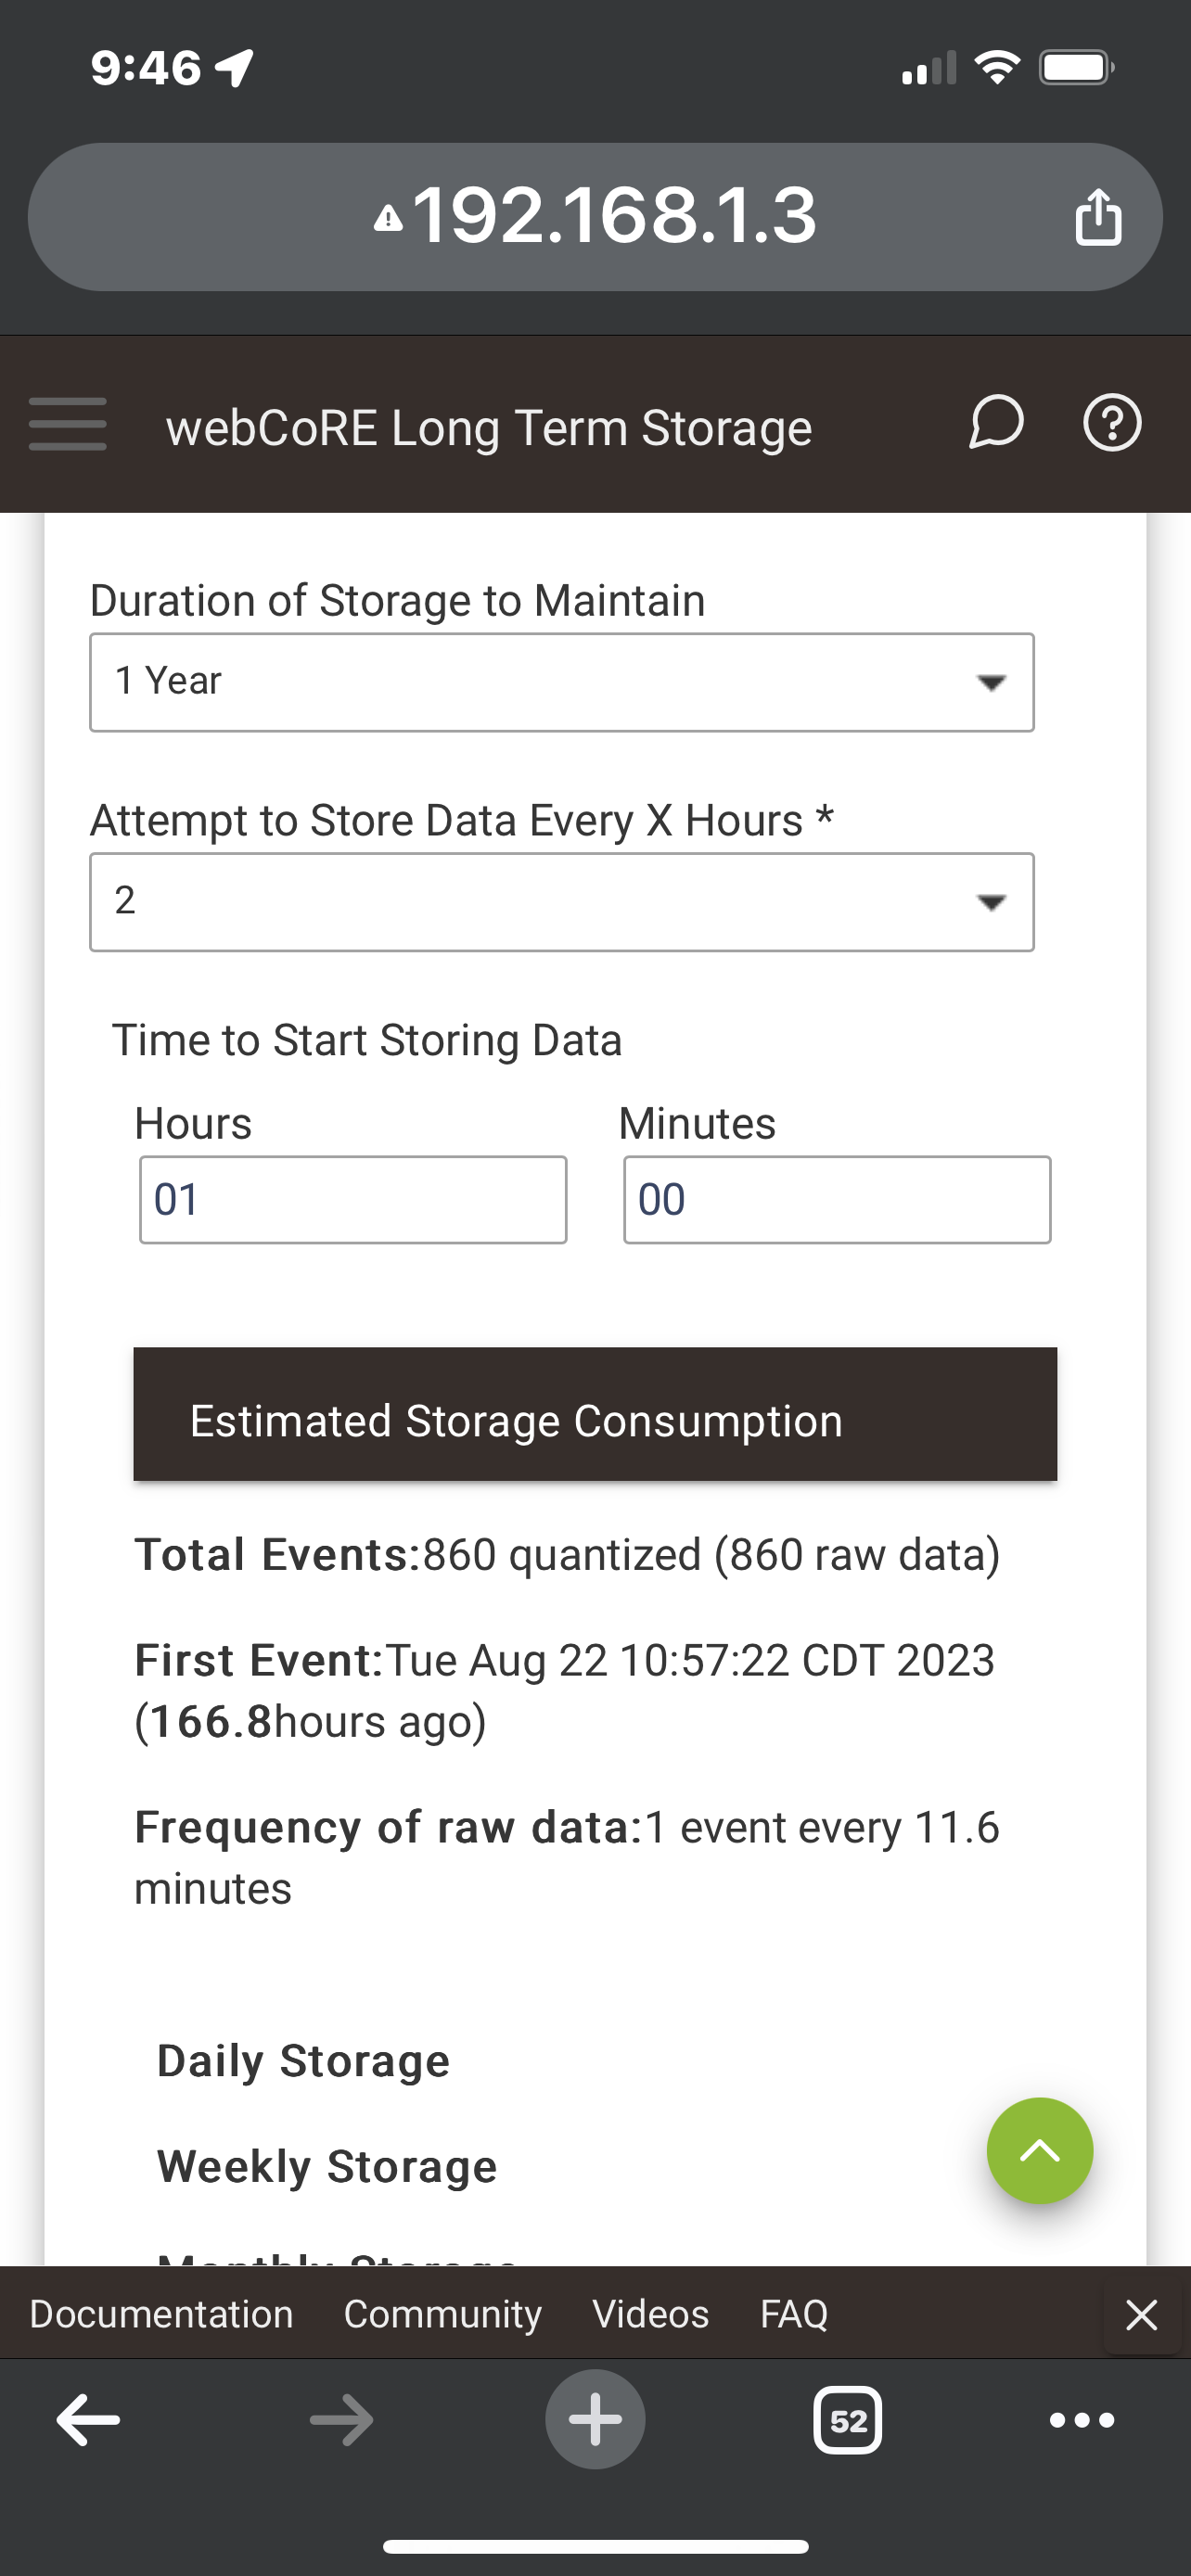
So what you are showing is you have an LTS configured and it is gathering data.
So what exactly are you doing that you don't see a data set?
So what you are showing is you have an LTS configured and it is gathering data.
So what exactly are you doing that you don't see a data set?
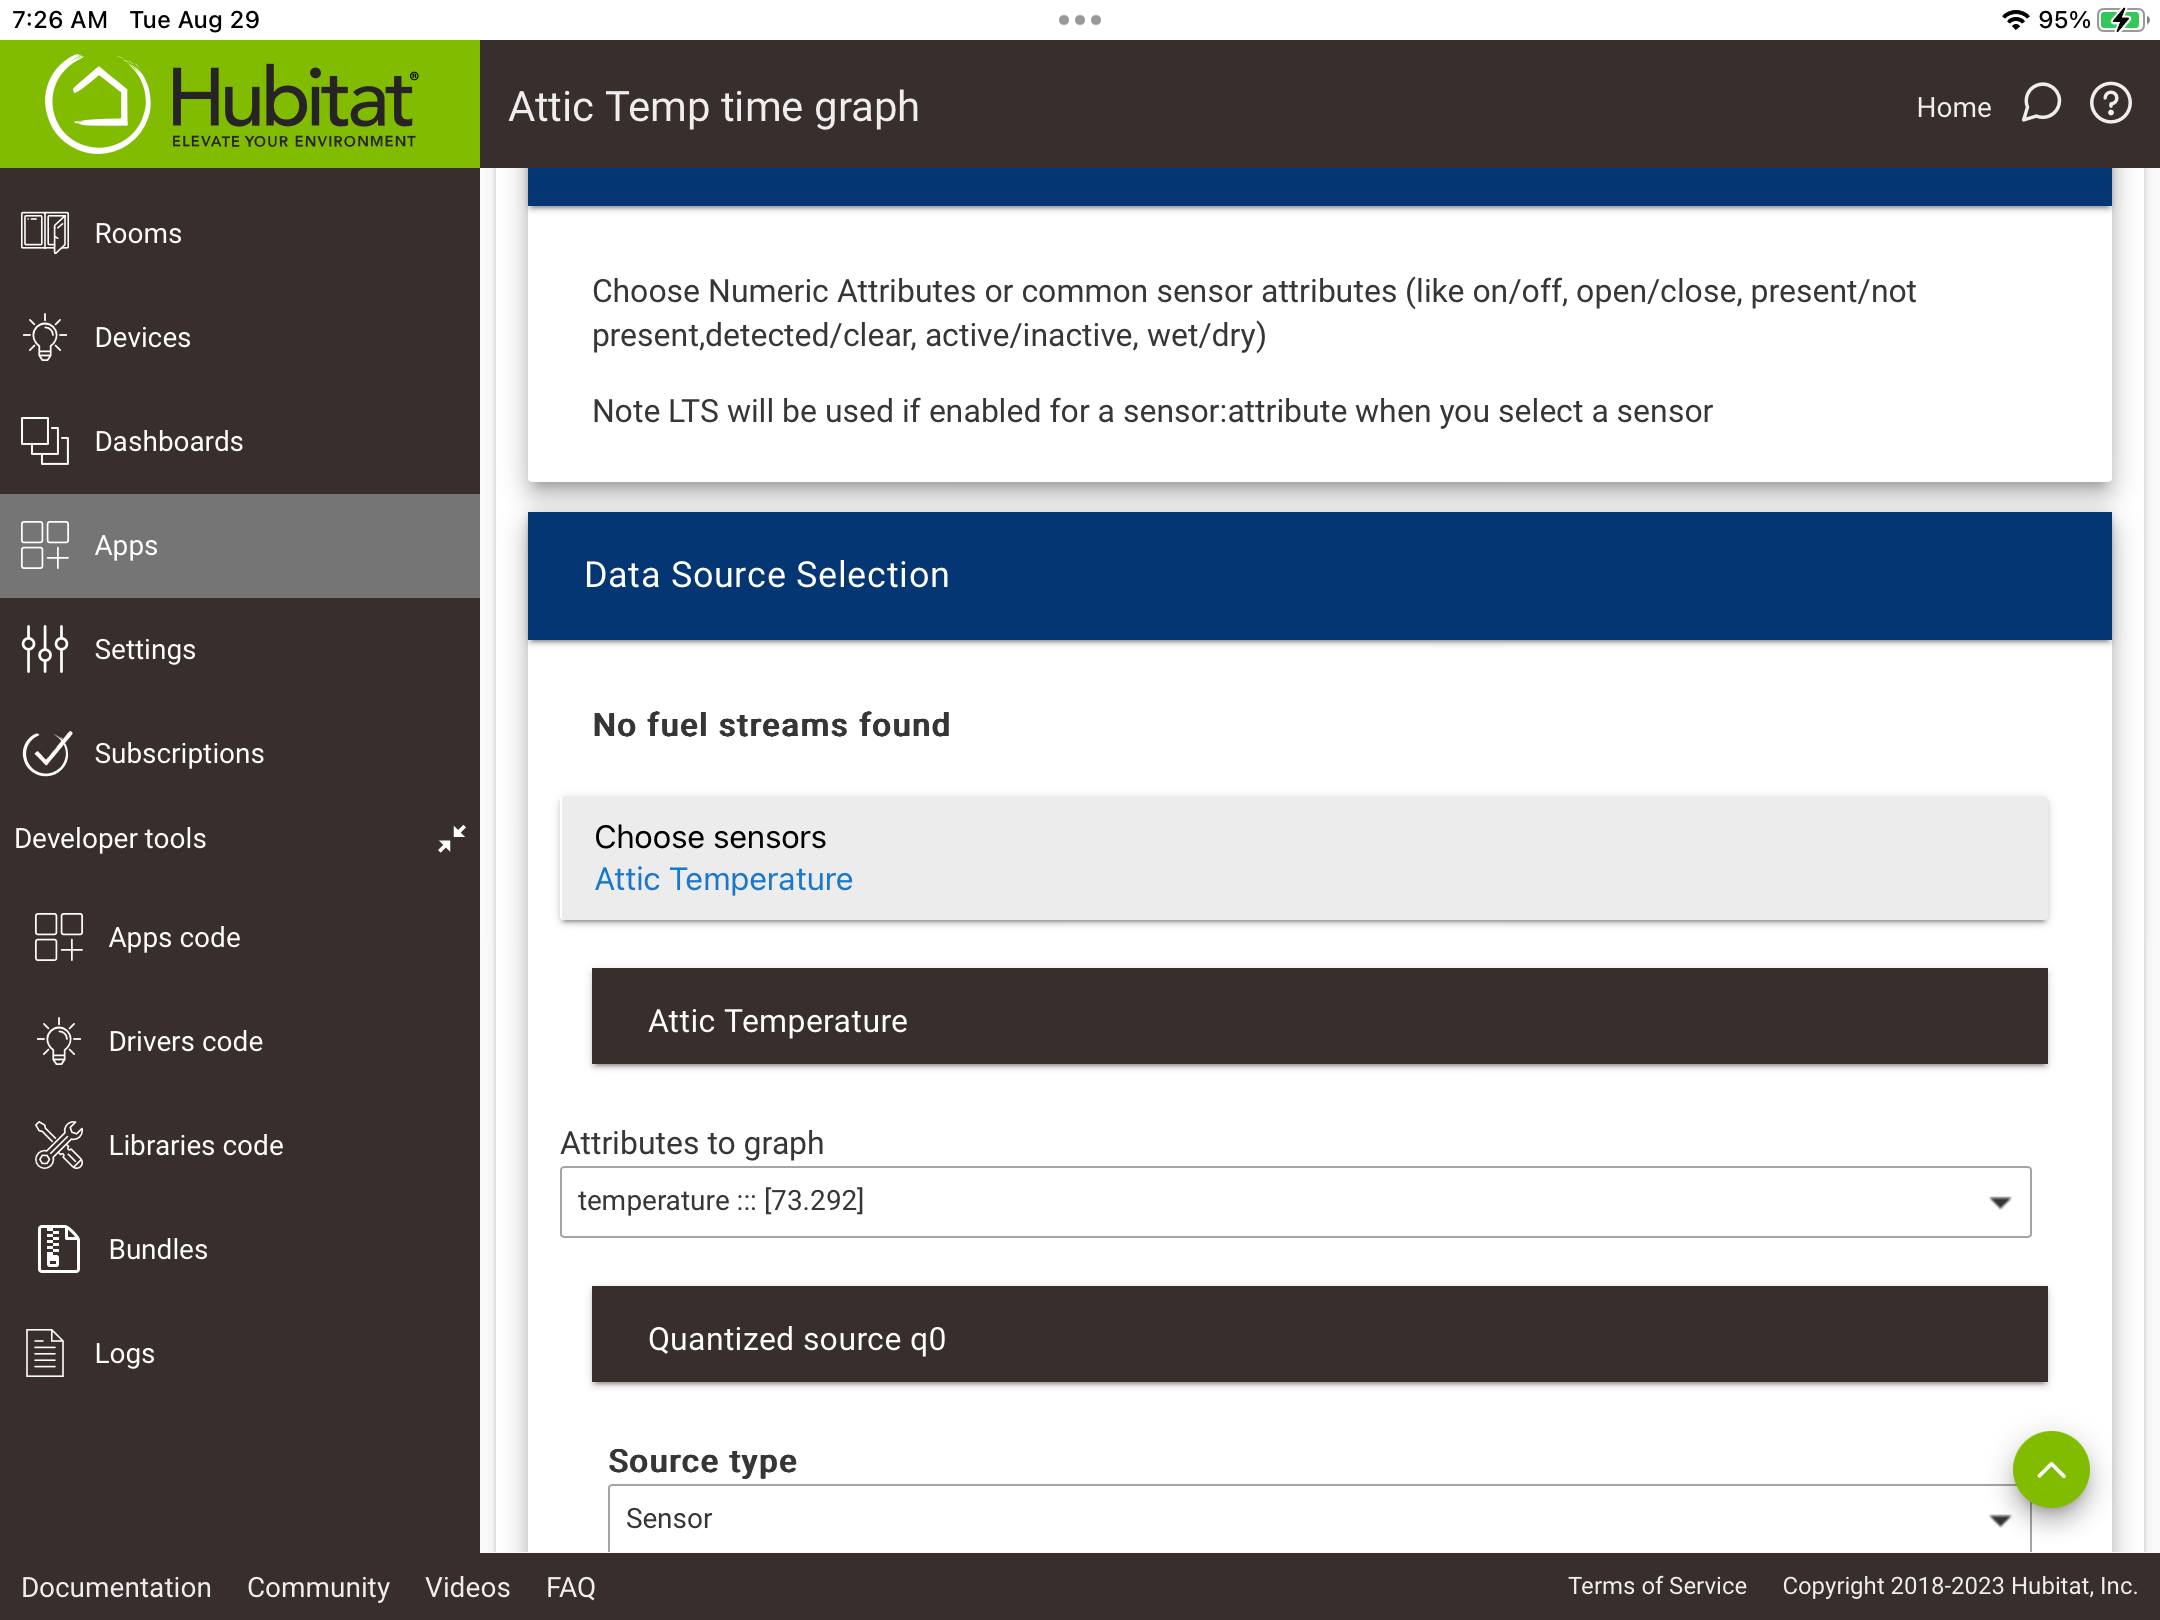
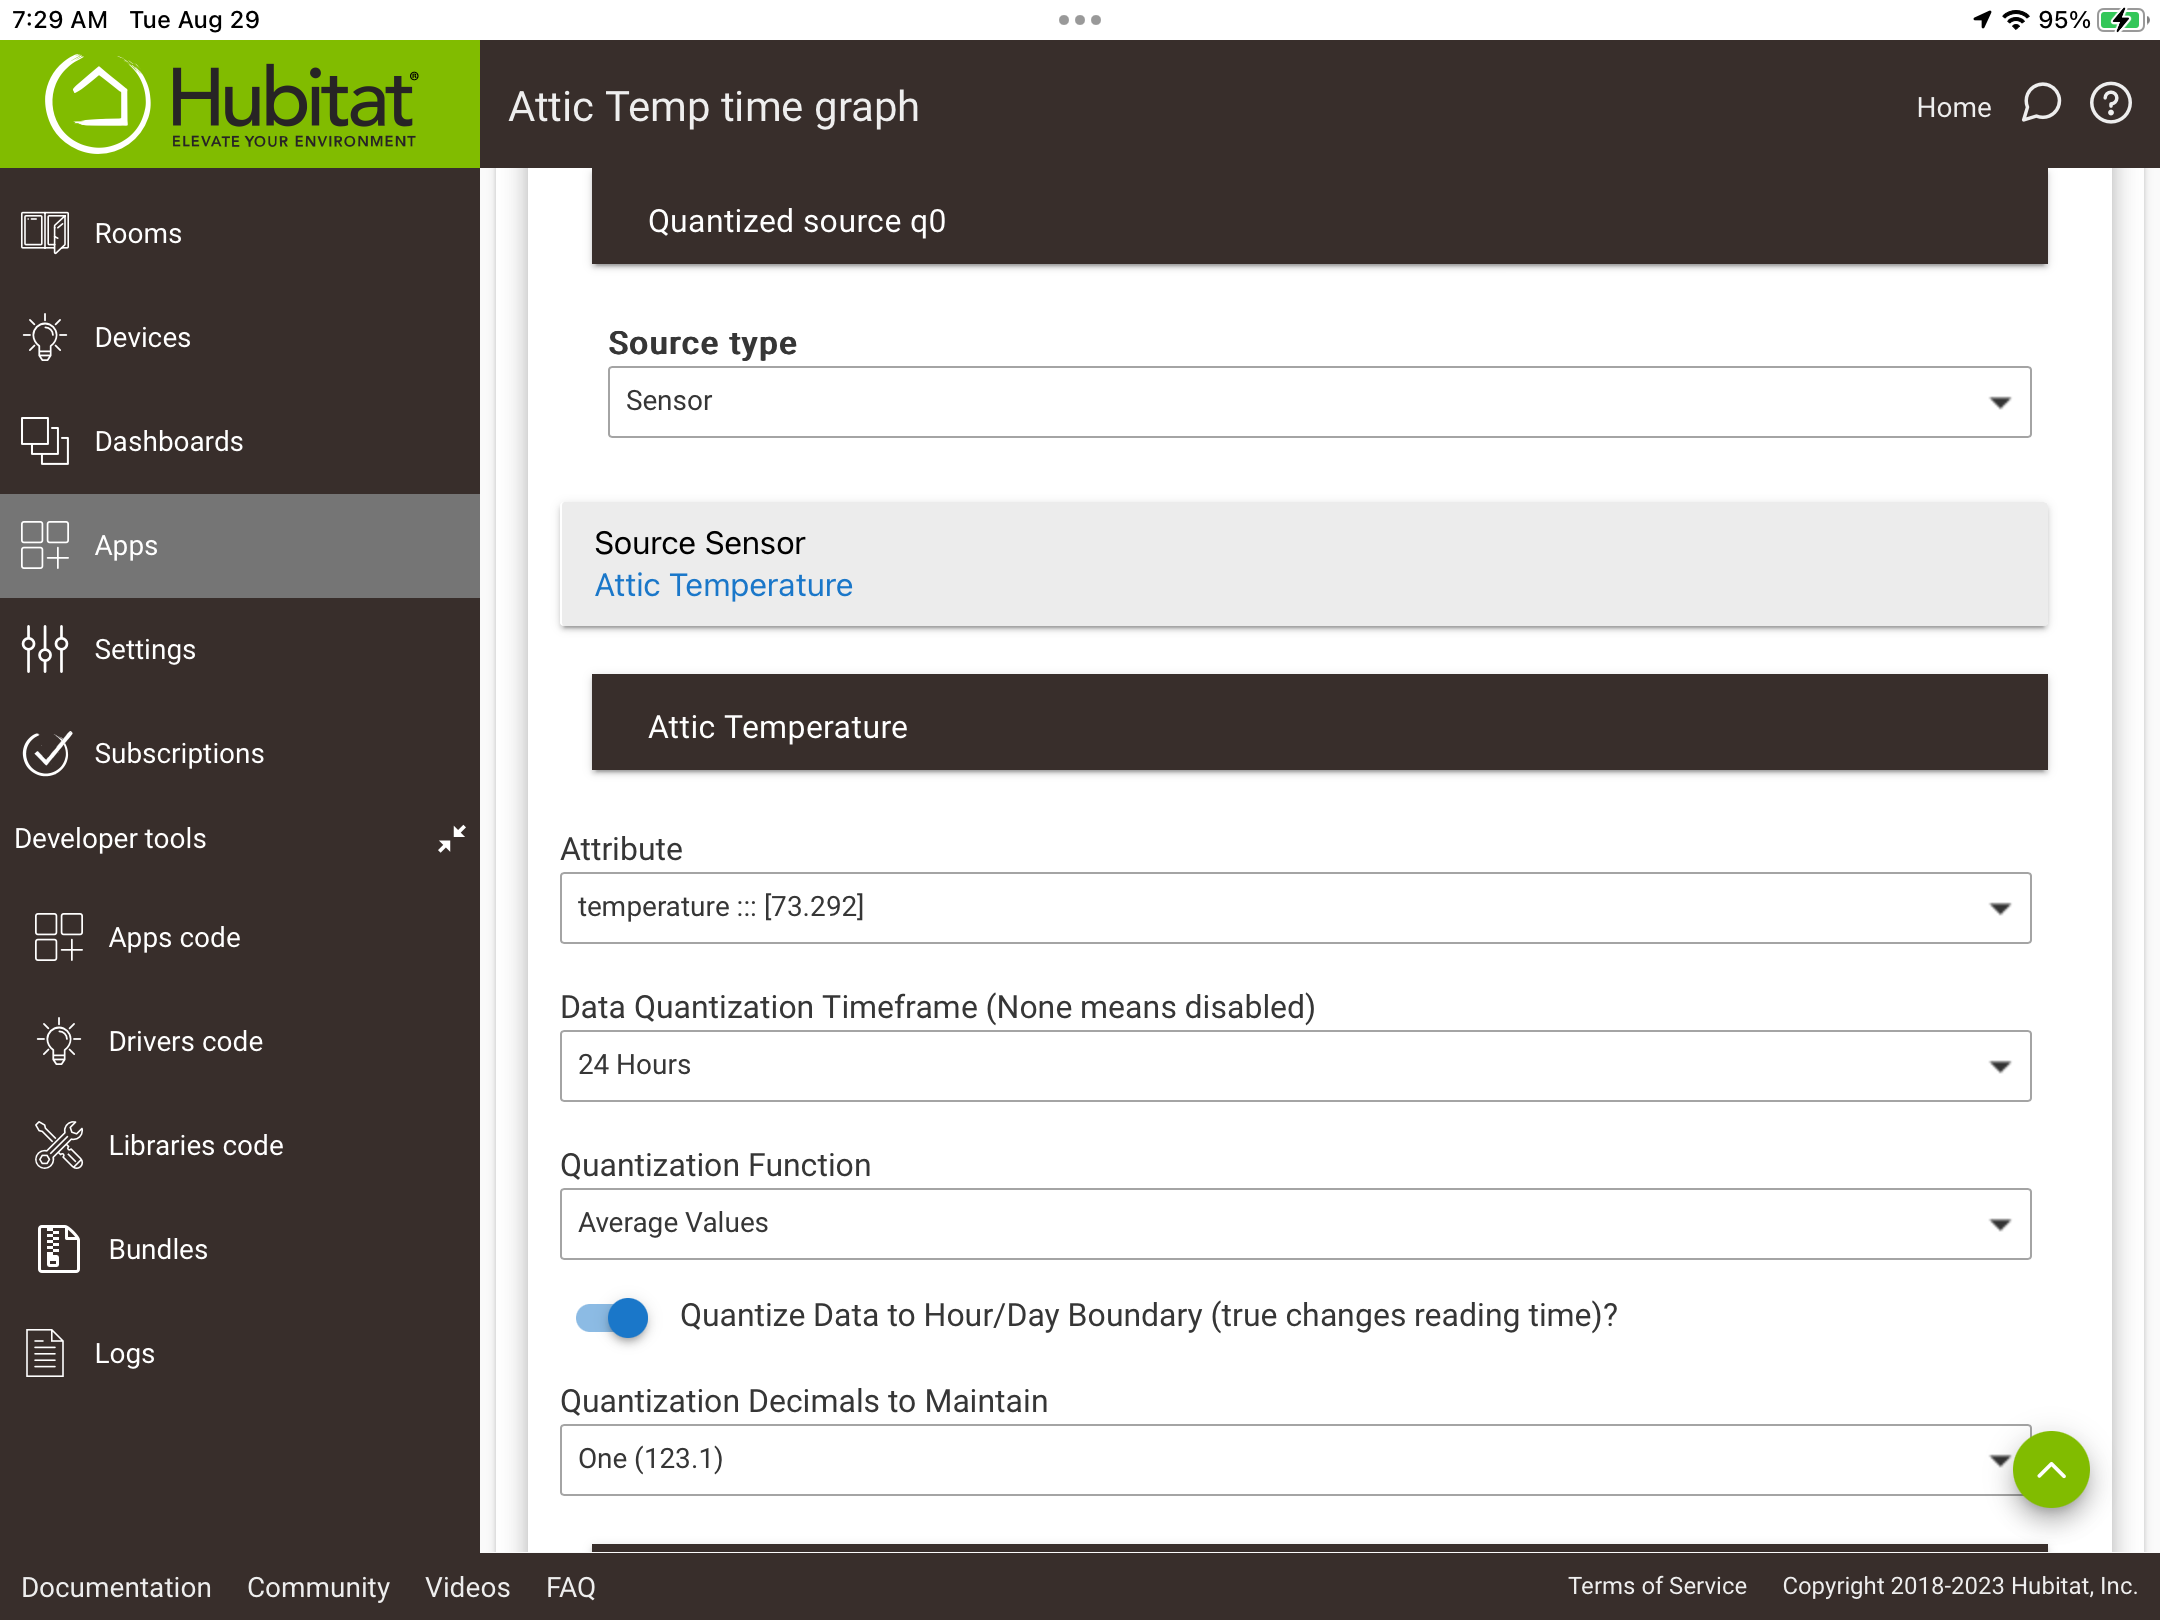
I want to create a graph that pulls data from the LTS. I don’t see LTS as an optional data source for any of the graphs that I build. I only see sensors, and no fuel streams.
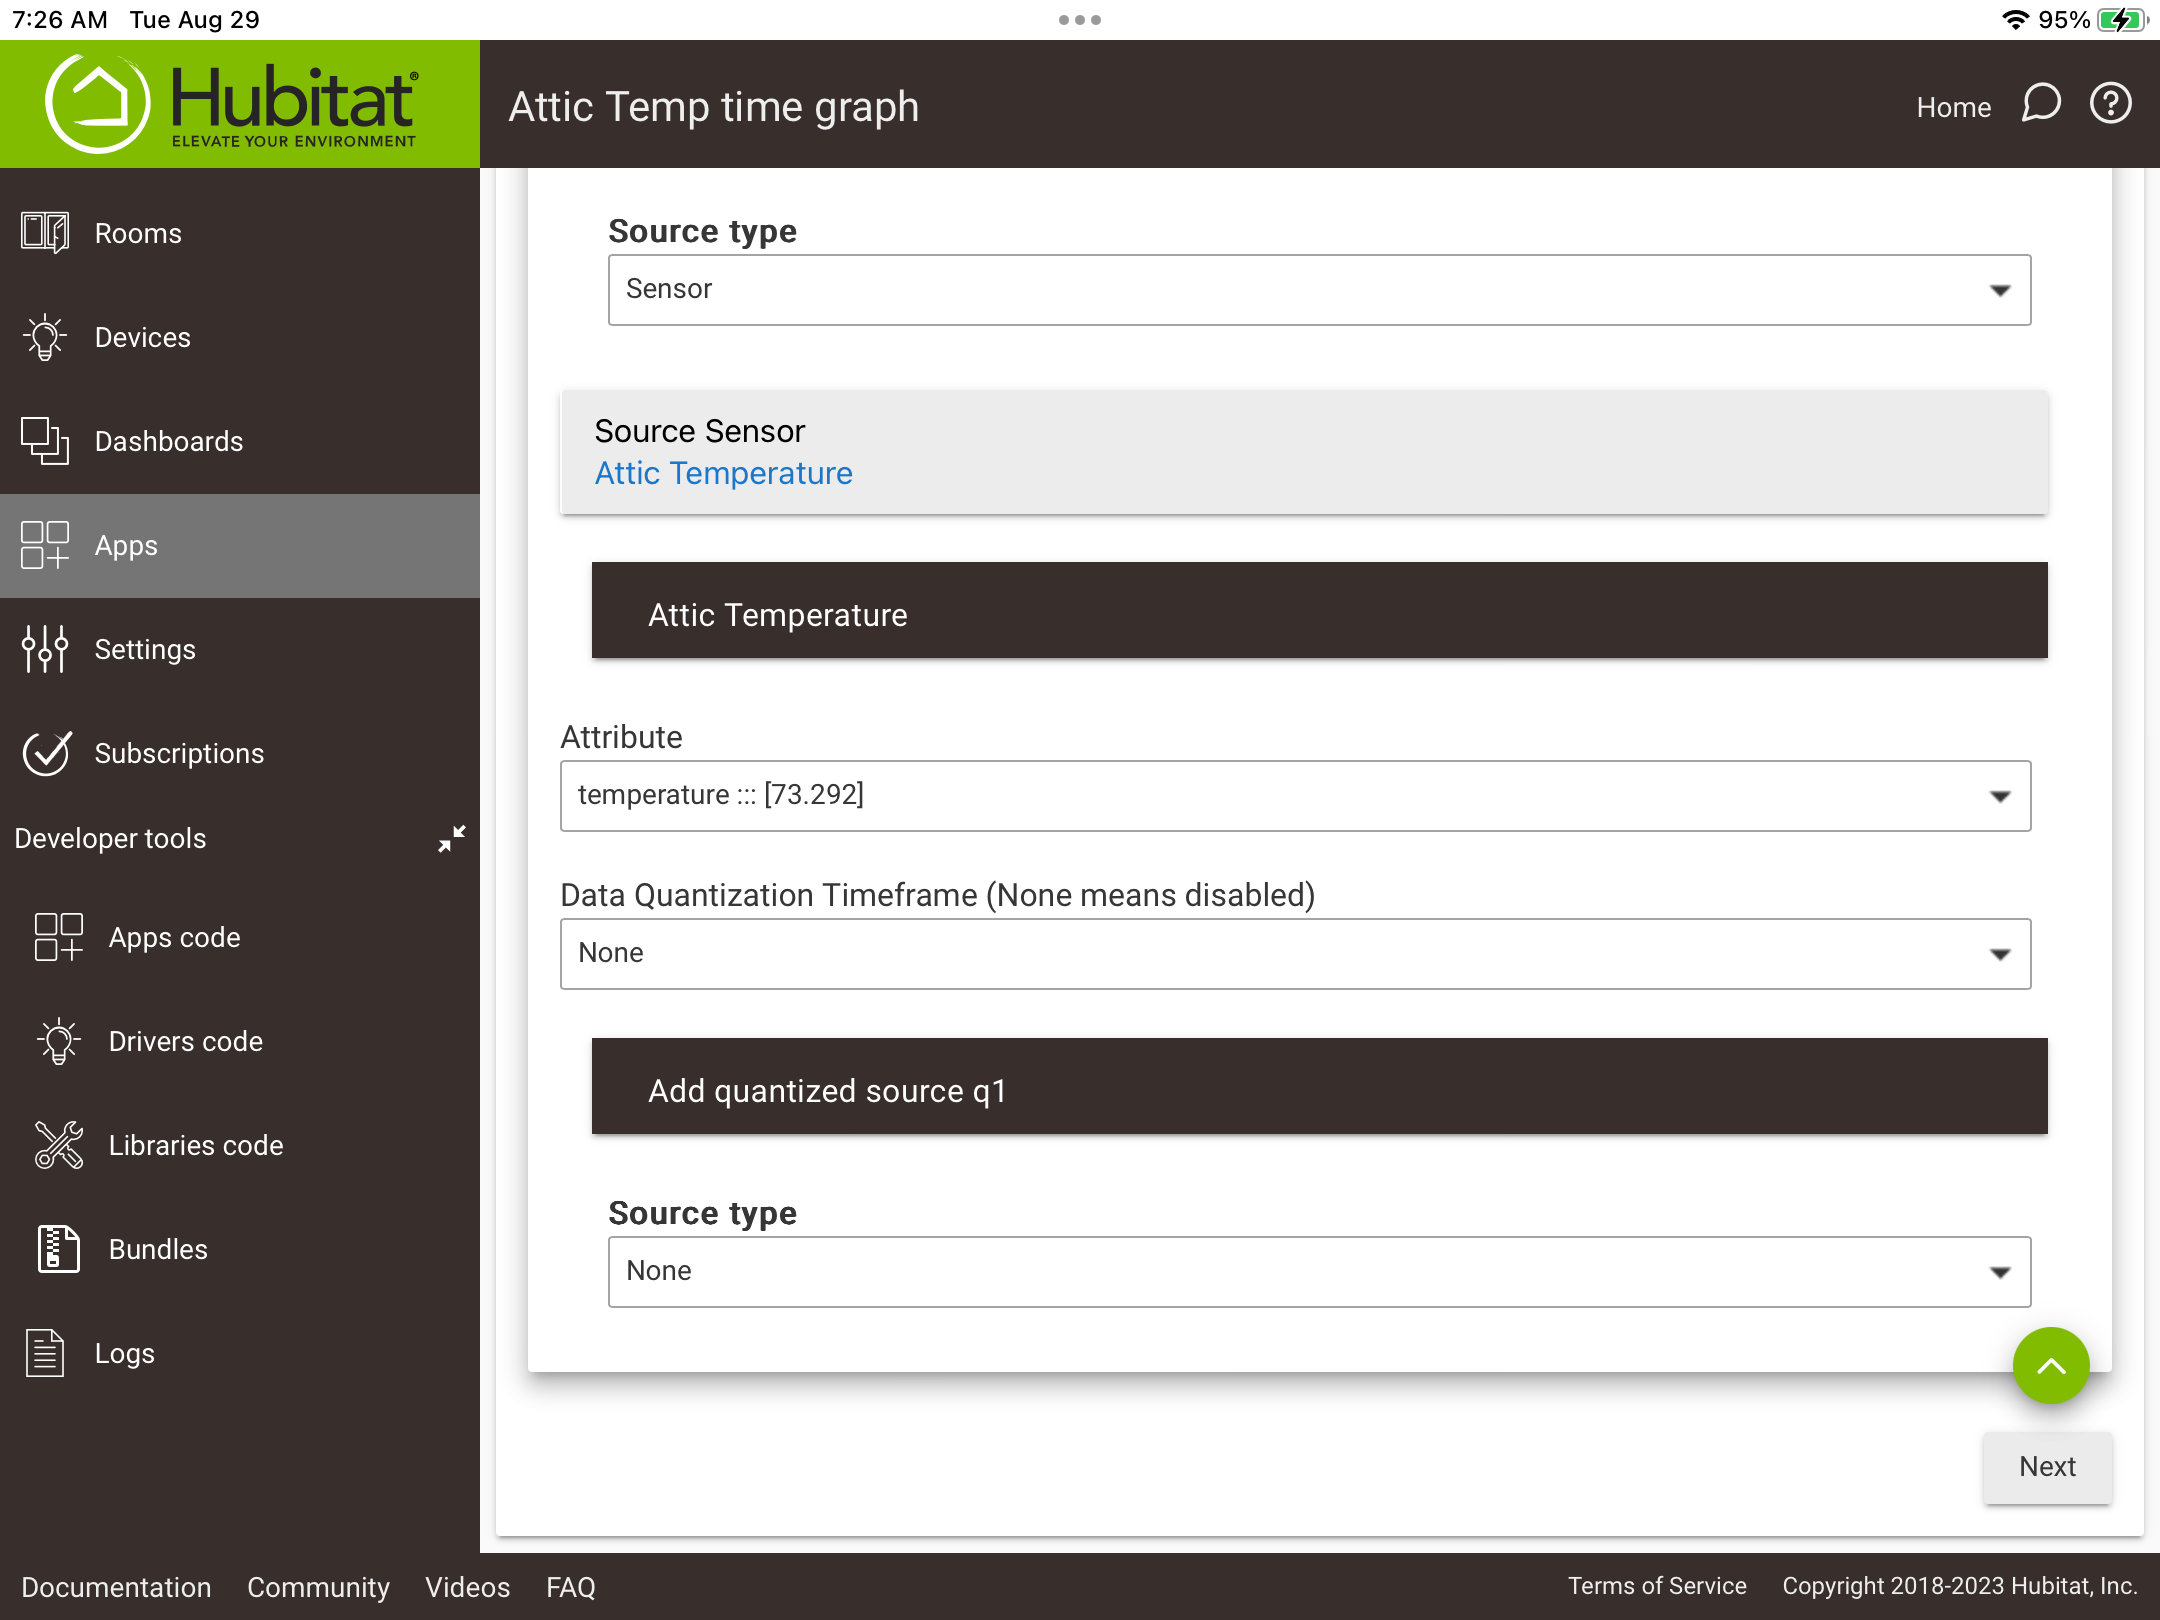
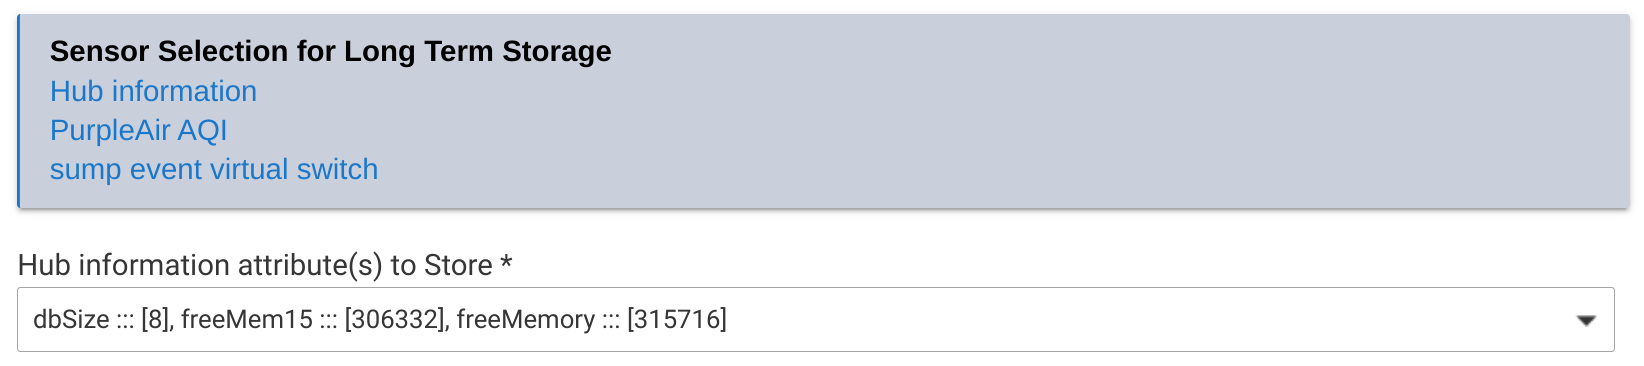
So you should be selecting the device:attribute you want.
If an LTS is there, after you select it, it will tell you LTS is in use for history.
If there is no LTS, you can still use the device / attribute, it will just only have the history of the DB.
Anyone using graphs, have you noticed a change in how a graph tile works in a dashboard?
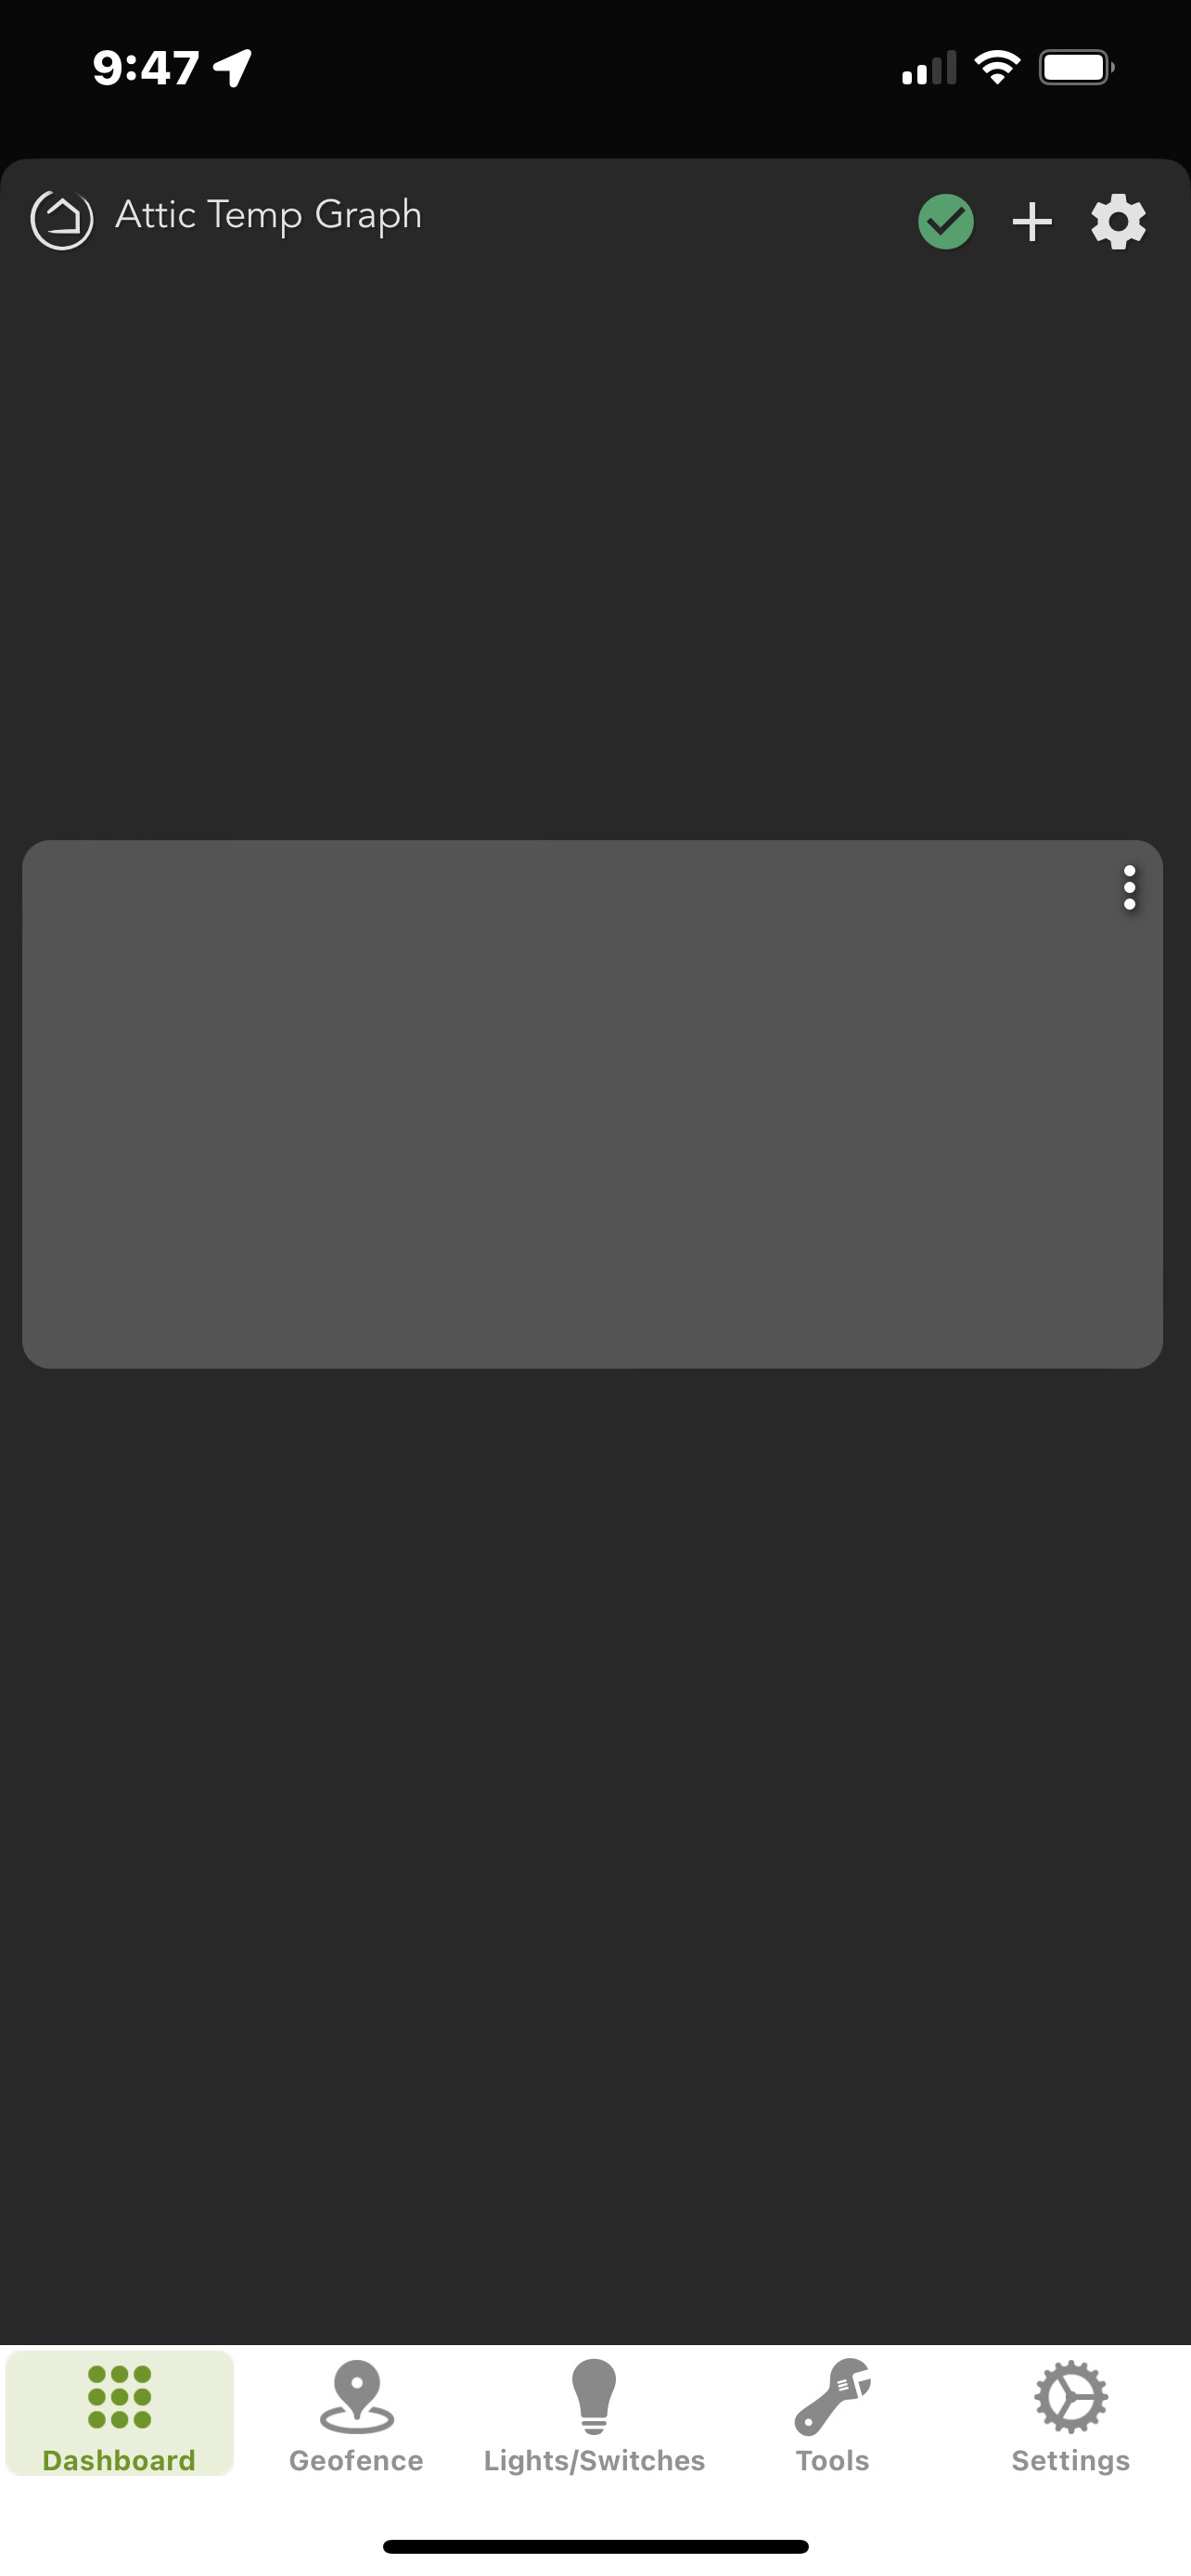
I updated webcore this morning and just noticed my graphs will not go full screen when I click them. I also tried in Edge with the same result.
I just updated webcore and my graphs on the dashboard still go fullscreen. I use Edge on Windows 11. BTW: I have to double click the graphs to go full screen and it was the same in the prior version for me.
@nh.schottfam put up a fix about 3 hrs ago so it looks like you got it. It's now working for me as well.
Did you enable the graph tile device? Does your graph preview display on it's creation page?
I think this issue was resolved by rebuilding the graph.
Thankfully found this thread, would never have worked out the LTS otherwise!
Clarification request: If I go through setting this up to get webCoRe to generate graphs, will I be able to see those graphs in the native Hubitat Android app even when I am accessing the app remotely (ie not on my local network)?
I currently use Hubigraphs, however I can only see the graphs I inserted in the dashboard when the phone is connected locally to my LAN. If I open the native Hubitat dashboard when I am away, the area where the graphs would show is just blank.
I am also wondering about this...
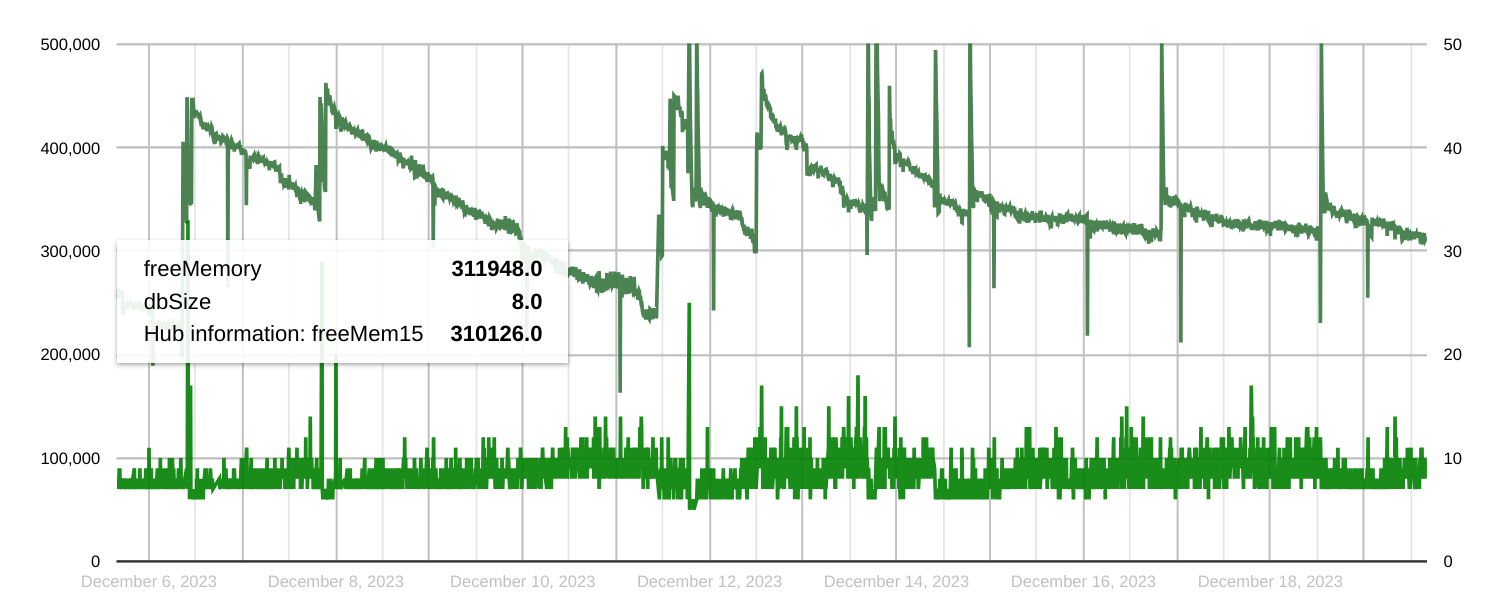
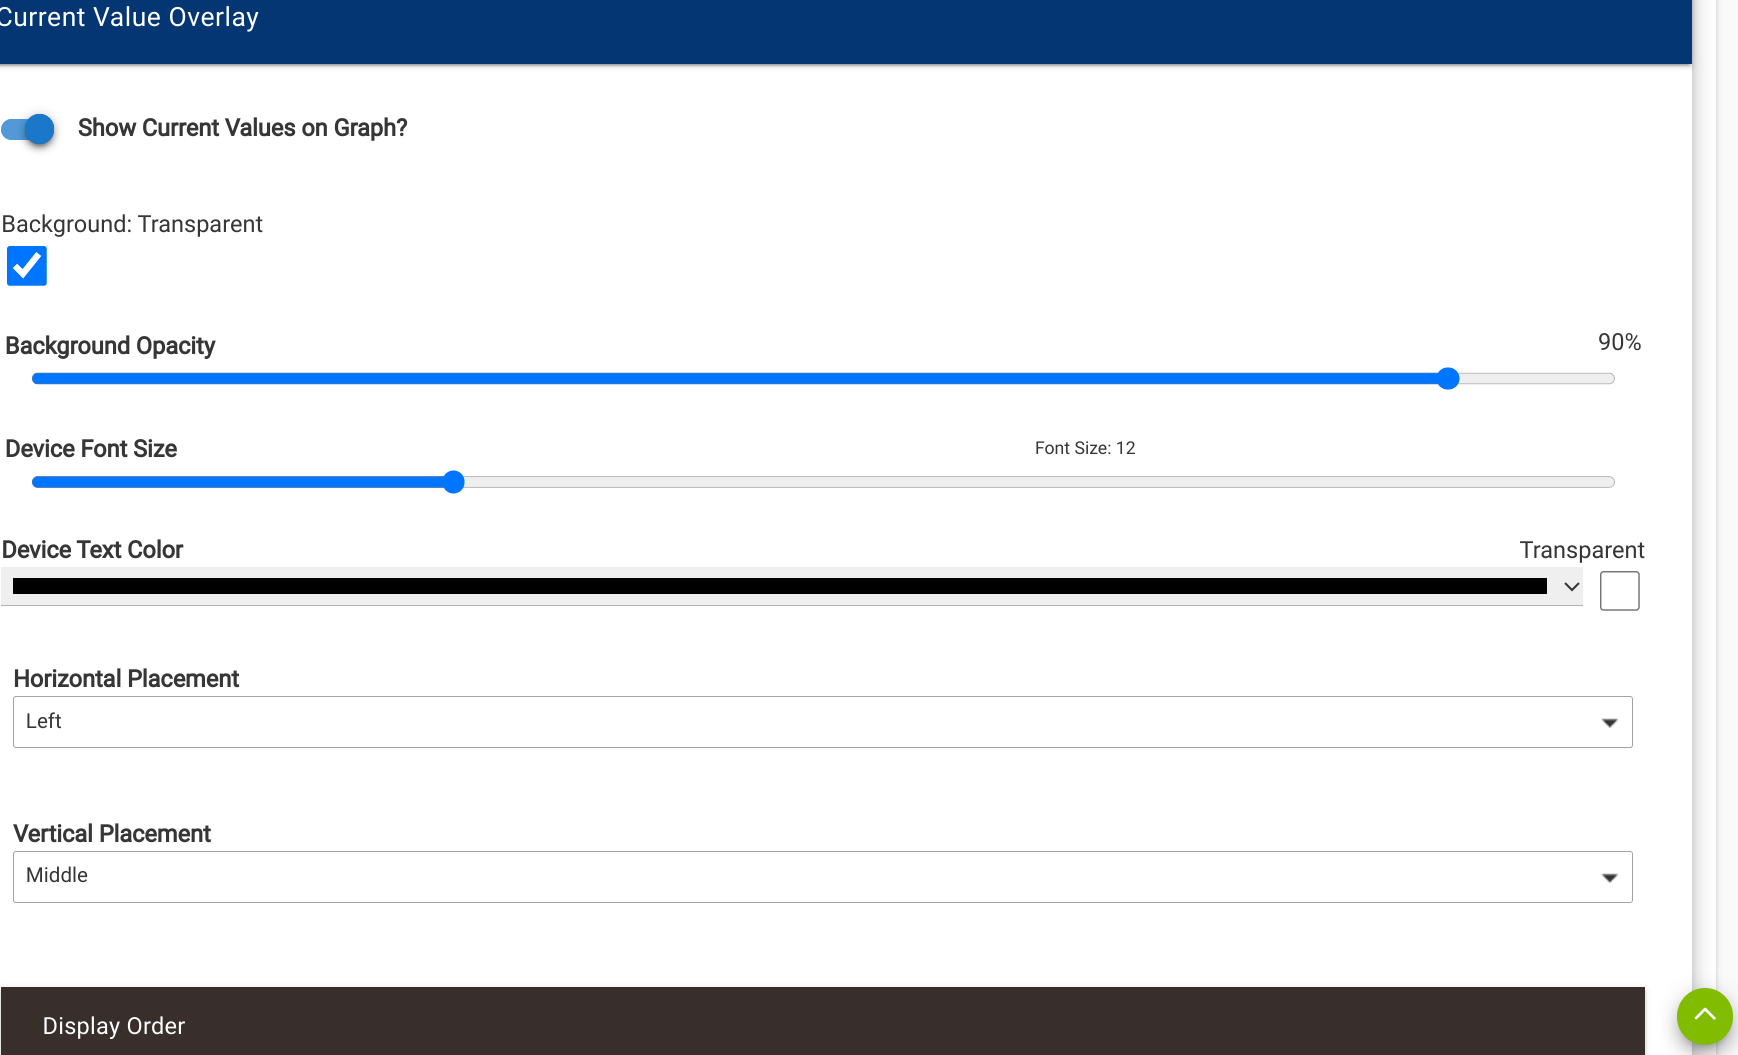
I'm moving my Hubigraphs to webcore. Is there a way to display current value on the graph? Below is a Hubigraph example.
Should work the same way.
Simply mimic everything in your current hubigraphs to webcore graphs.
@rlithgow1 @thebearmay Thanks for the quick reply. I have successfully setup my several graphs but I do not see where "current value" is available in the webCoRE line graph settings. I'm using the current built-in implementation of webCoRE on 2.3.7.138.
Additionally, double click on the Dashboard sebCoRE graphs does not expand them like the Hubigraph version on the same dashboard.
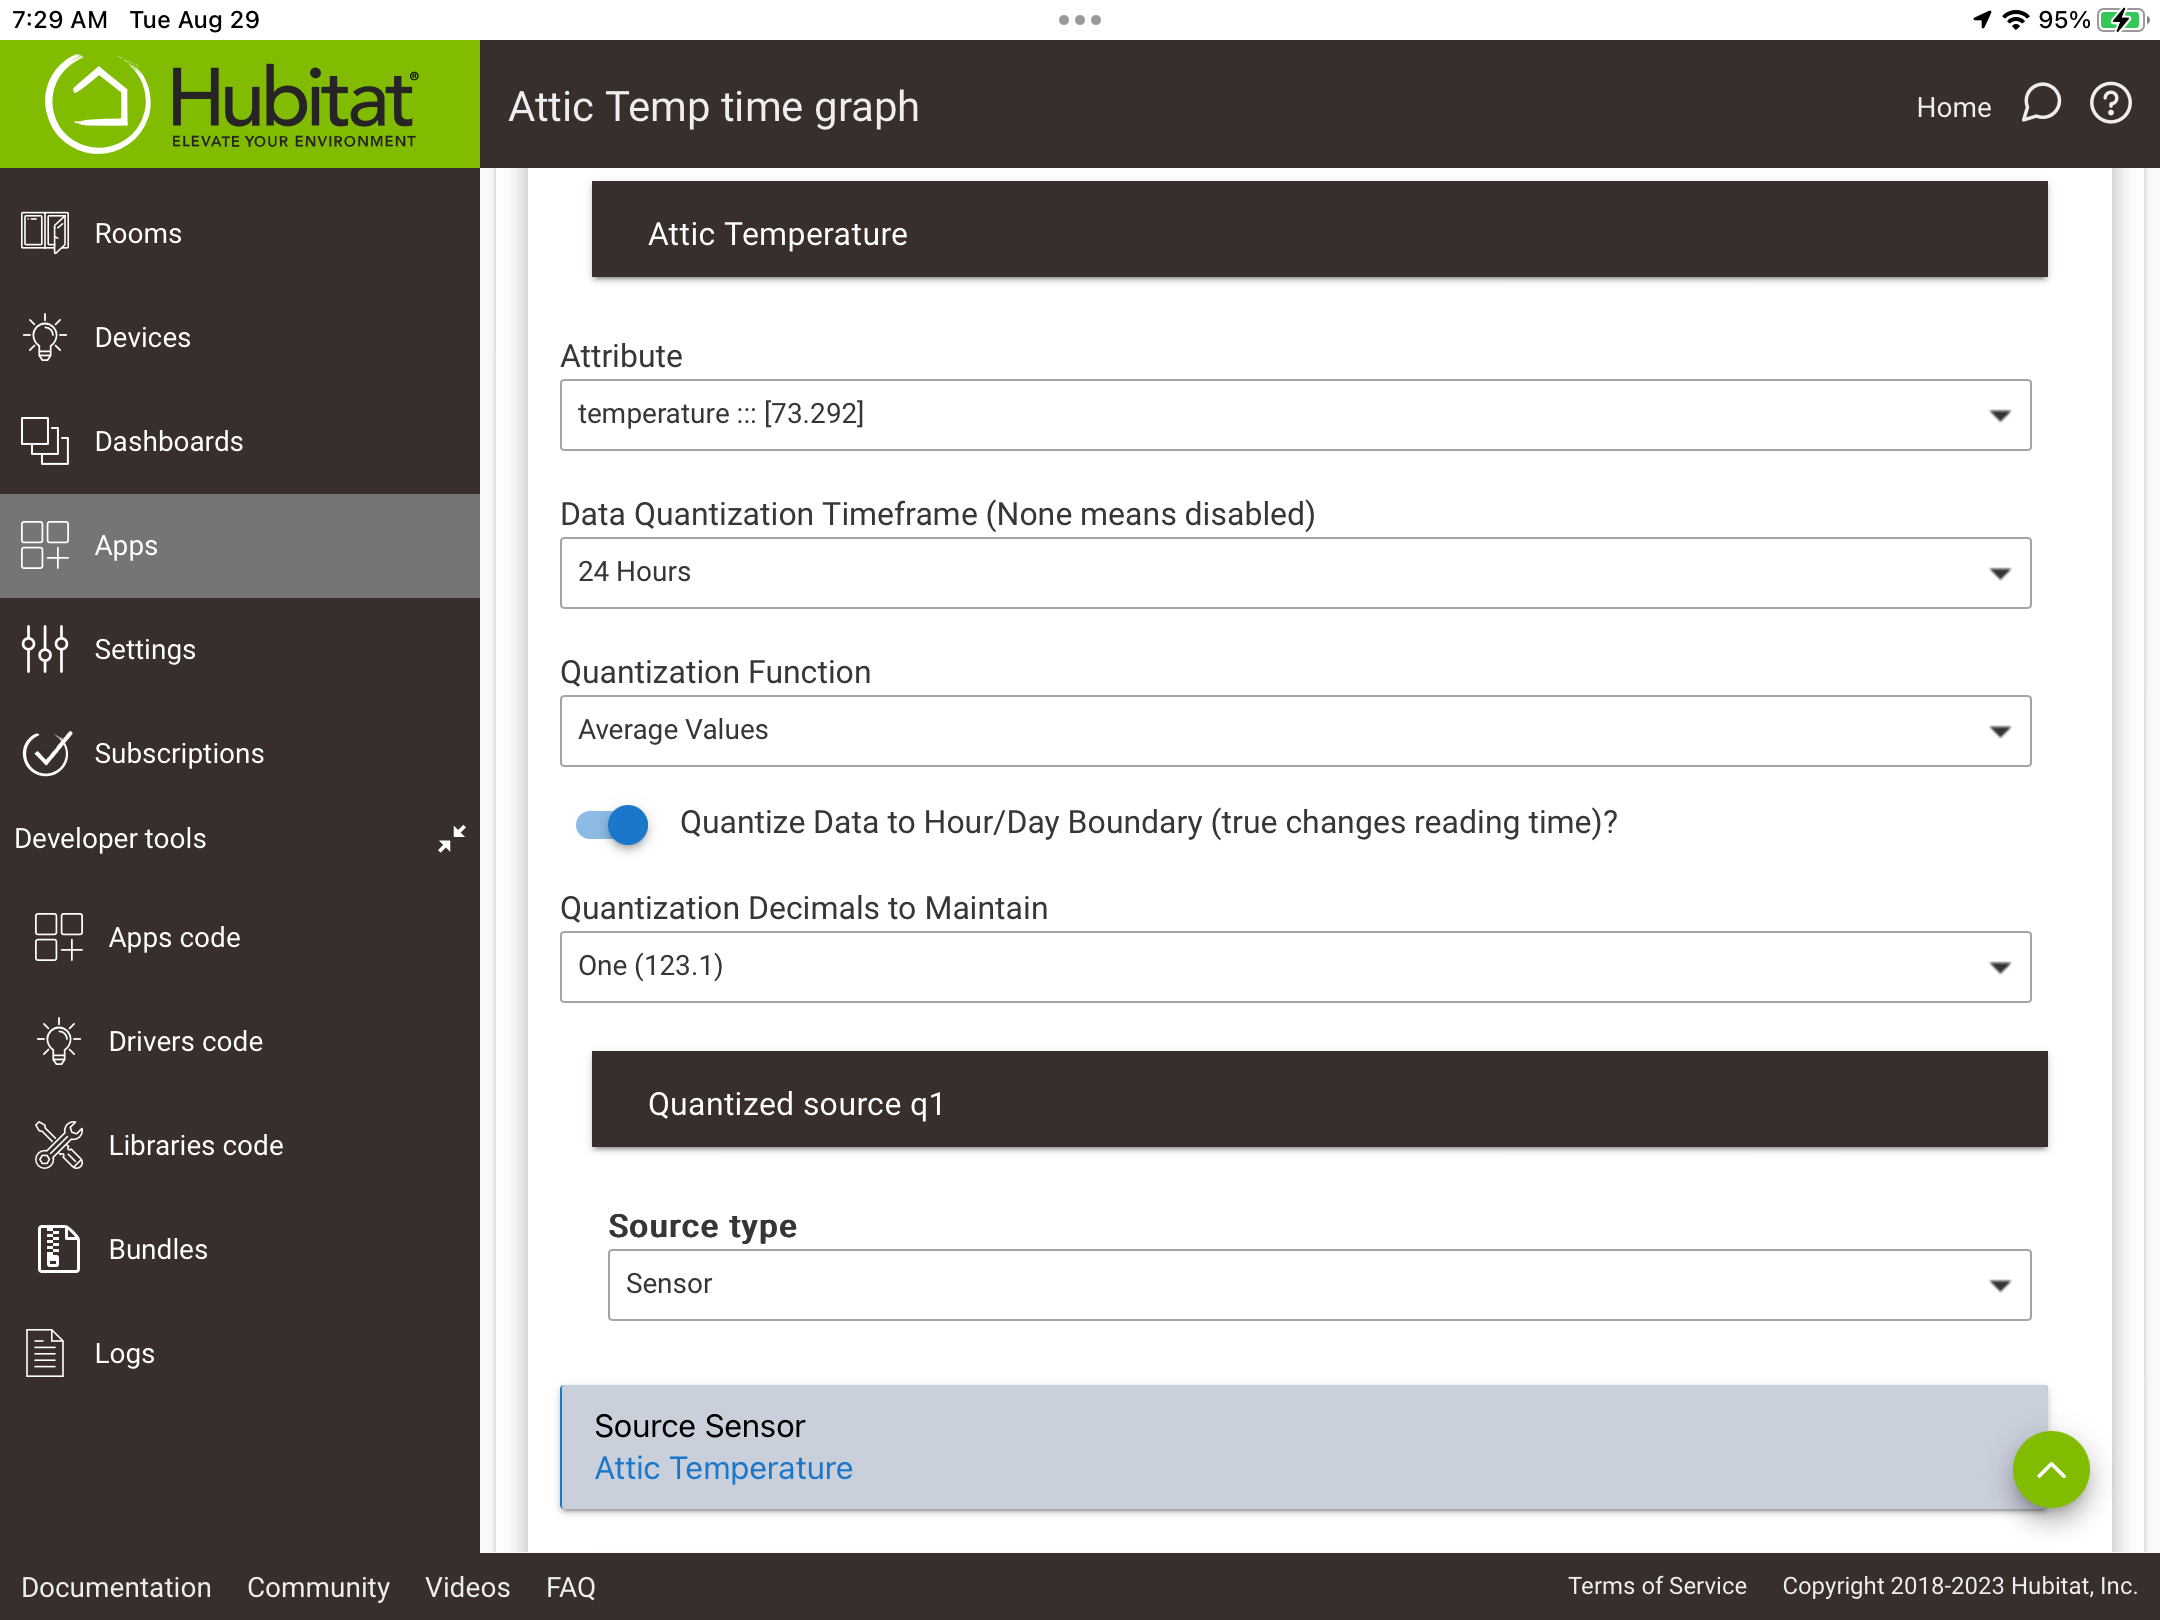
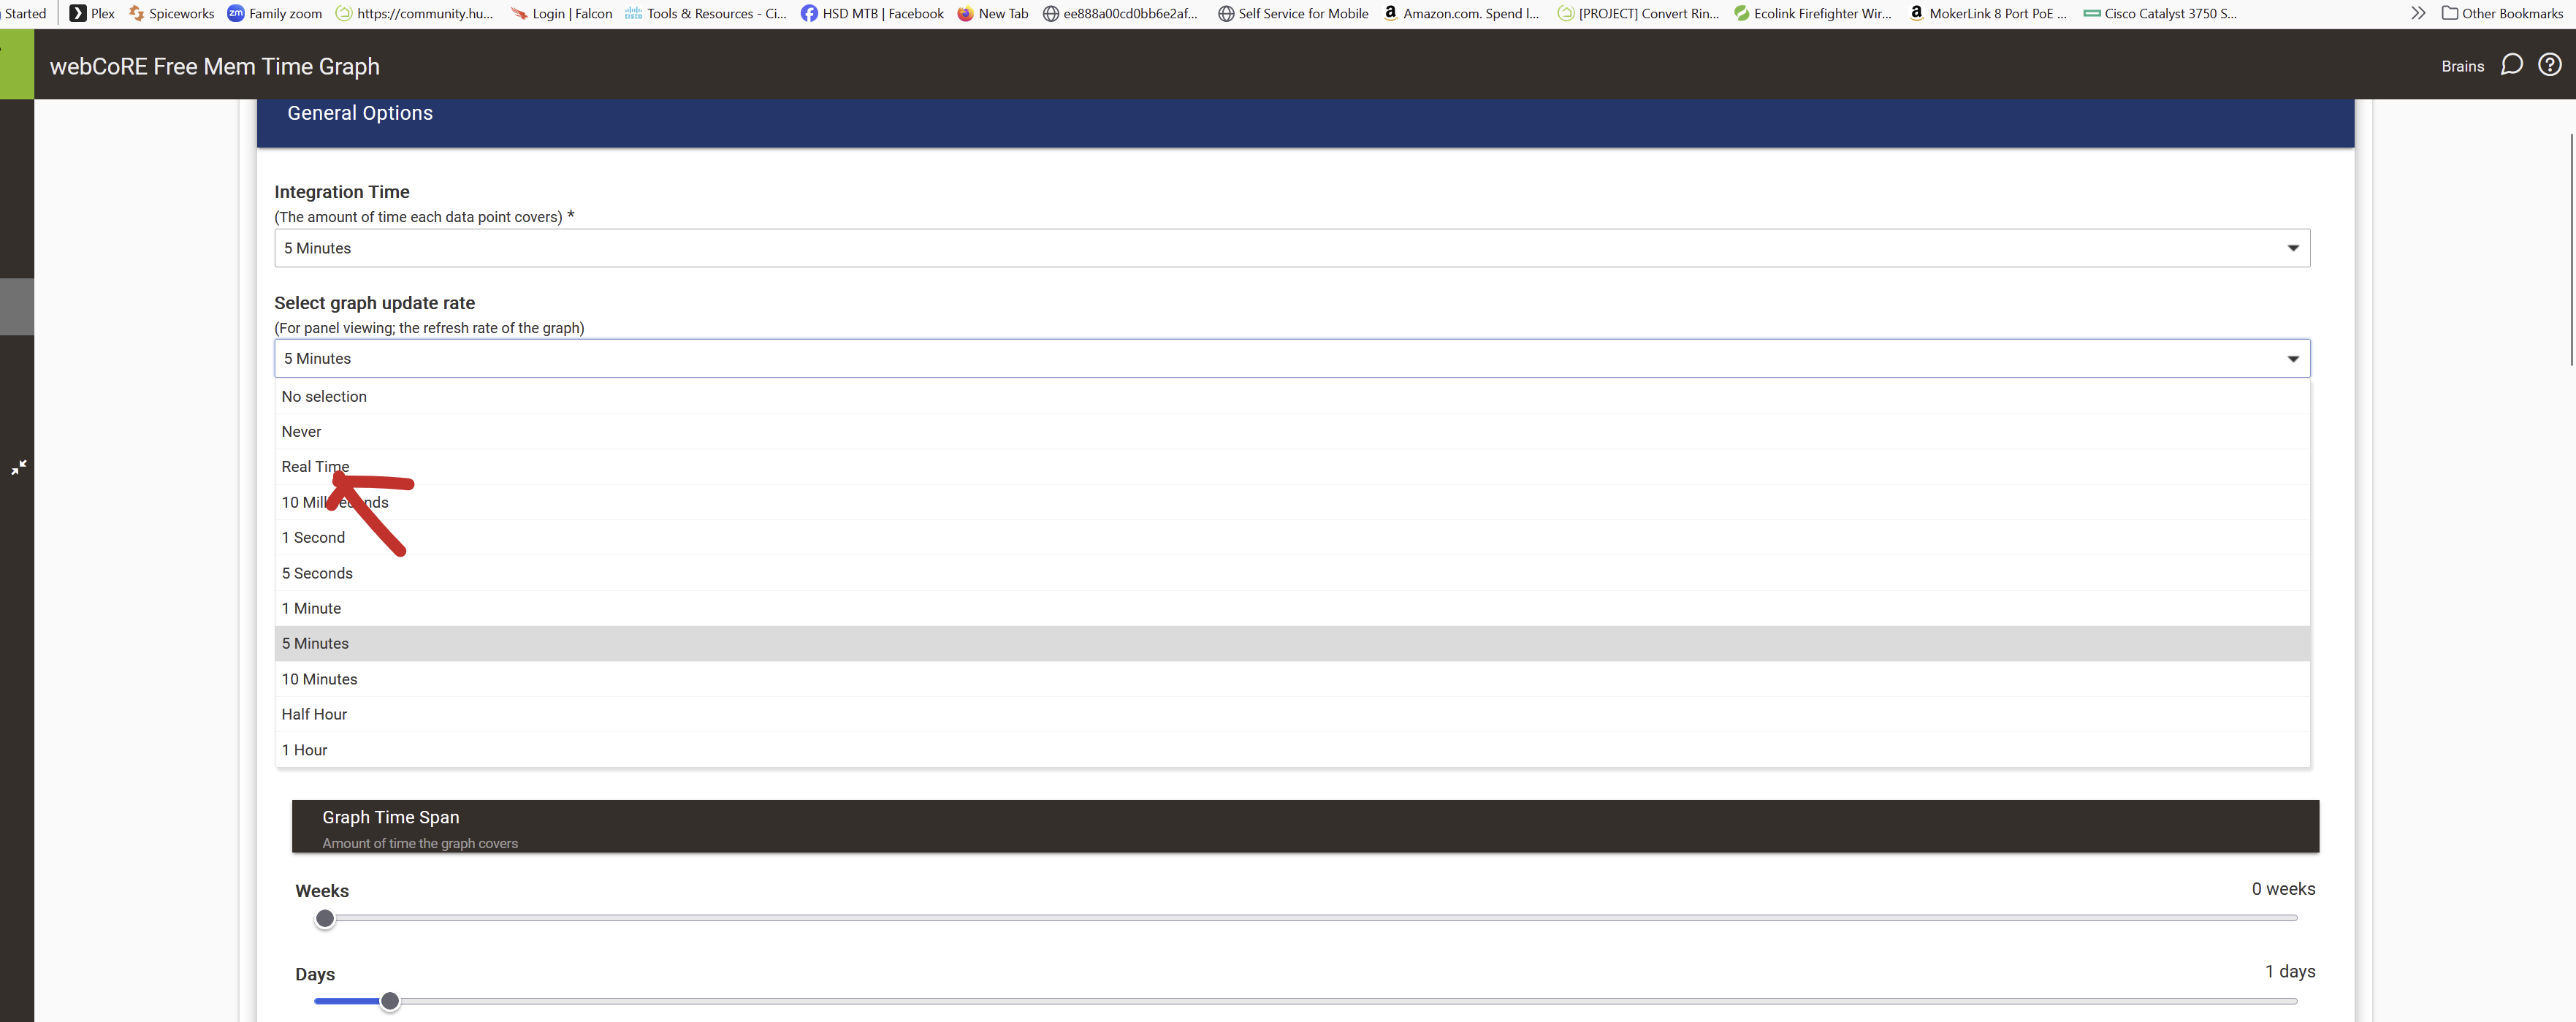
Pick time graph... under configure graph pick select graph update rate. Also you need to turn on long term storage
Not sure what this has to do with "current value." All of the attributes associated with this graph are already set up with long term storage and are being correctly populated. Are you saying that the webCoRE implementation of "line graph" cannot or could not be capable of supporting "current value?"
I have never used a line graph I always use time graphs and they have the show current value on graph option. Not sure why the line graph does not. Perhaps change to the time graph, I am not entirely clear what the difference is between the two. Your graphs appear to be time graphs, data over time. Or wait and perhaps @nh.schottfam can explain.
I see in timegraph options for "Current Value Overlay"
So would need to have more details as to your settings.
Download the Hubitat app