Yes it does, the question by @bbrannon is does a line graph have that option?
1 Like
I can make it work with time graph. I was previously using line graph in Hubigraphs with a similar result. It appears that the "Current value" option was omitted from the webCoRE Hubigraph import. Maybe an oversight?
I looked over the original hubigraph code for linegraph and do not see it there.
It is in timegraph...
@nh.schottfam @rlithgow1
I'm completely wrong about this. Thank you for taking the time to help me figure it out. After your reply I went back to look at the original Hubigraph graph creation process and there is no "Line graph" choice. It is "Time graph" and the first plot option is "Line." It has been so long since I set up a new one from scratch, I have always thought of them as line graphs. I've rebuilt all of my webCoRE line graphs as time graphs. Other than the availability of current value they are pretty much the same.
What is the purpose of Line graph as opposed to Time graph in weBcoRE?
Time series graphs help in visualizing trends over time whereas line graphs visualize a sequence of continuous numeric values
Display webCoRE graphs on Hubitat Android app? Local network. Graphs display as expected in the local Chrome browser dashboard on PC and Chromebook . Also display correctly from the webCoRE "Local Graph URL." The graph will display in Android mobile following the local URL if the security messages are overridden. I don't know if this can be solved by the webCoRE graphs implementation or Hubitat mobile app.
Is it the configuration of the tile by the webCoRE app or the Hubitat mobile app?
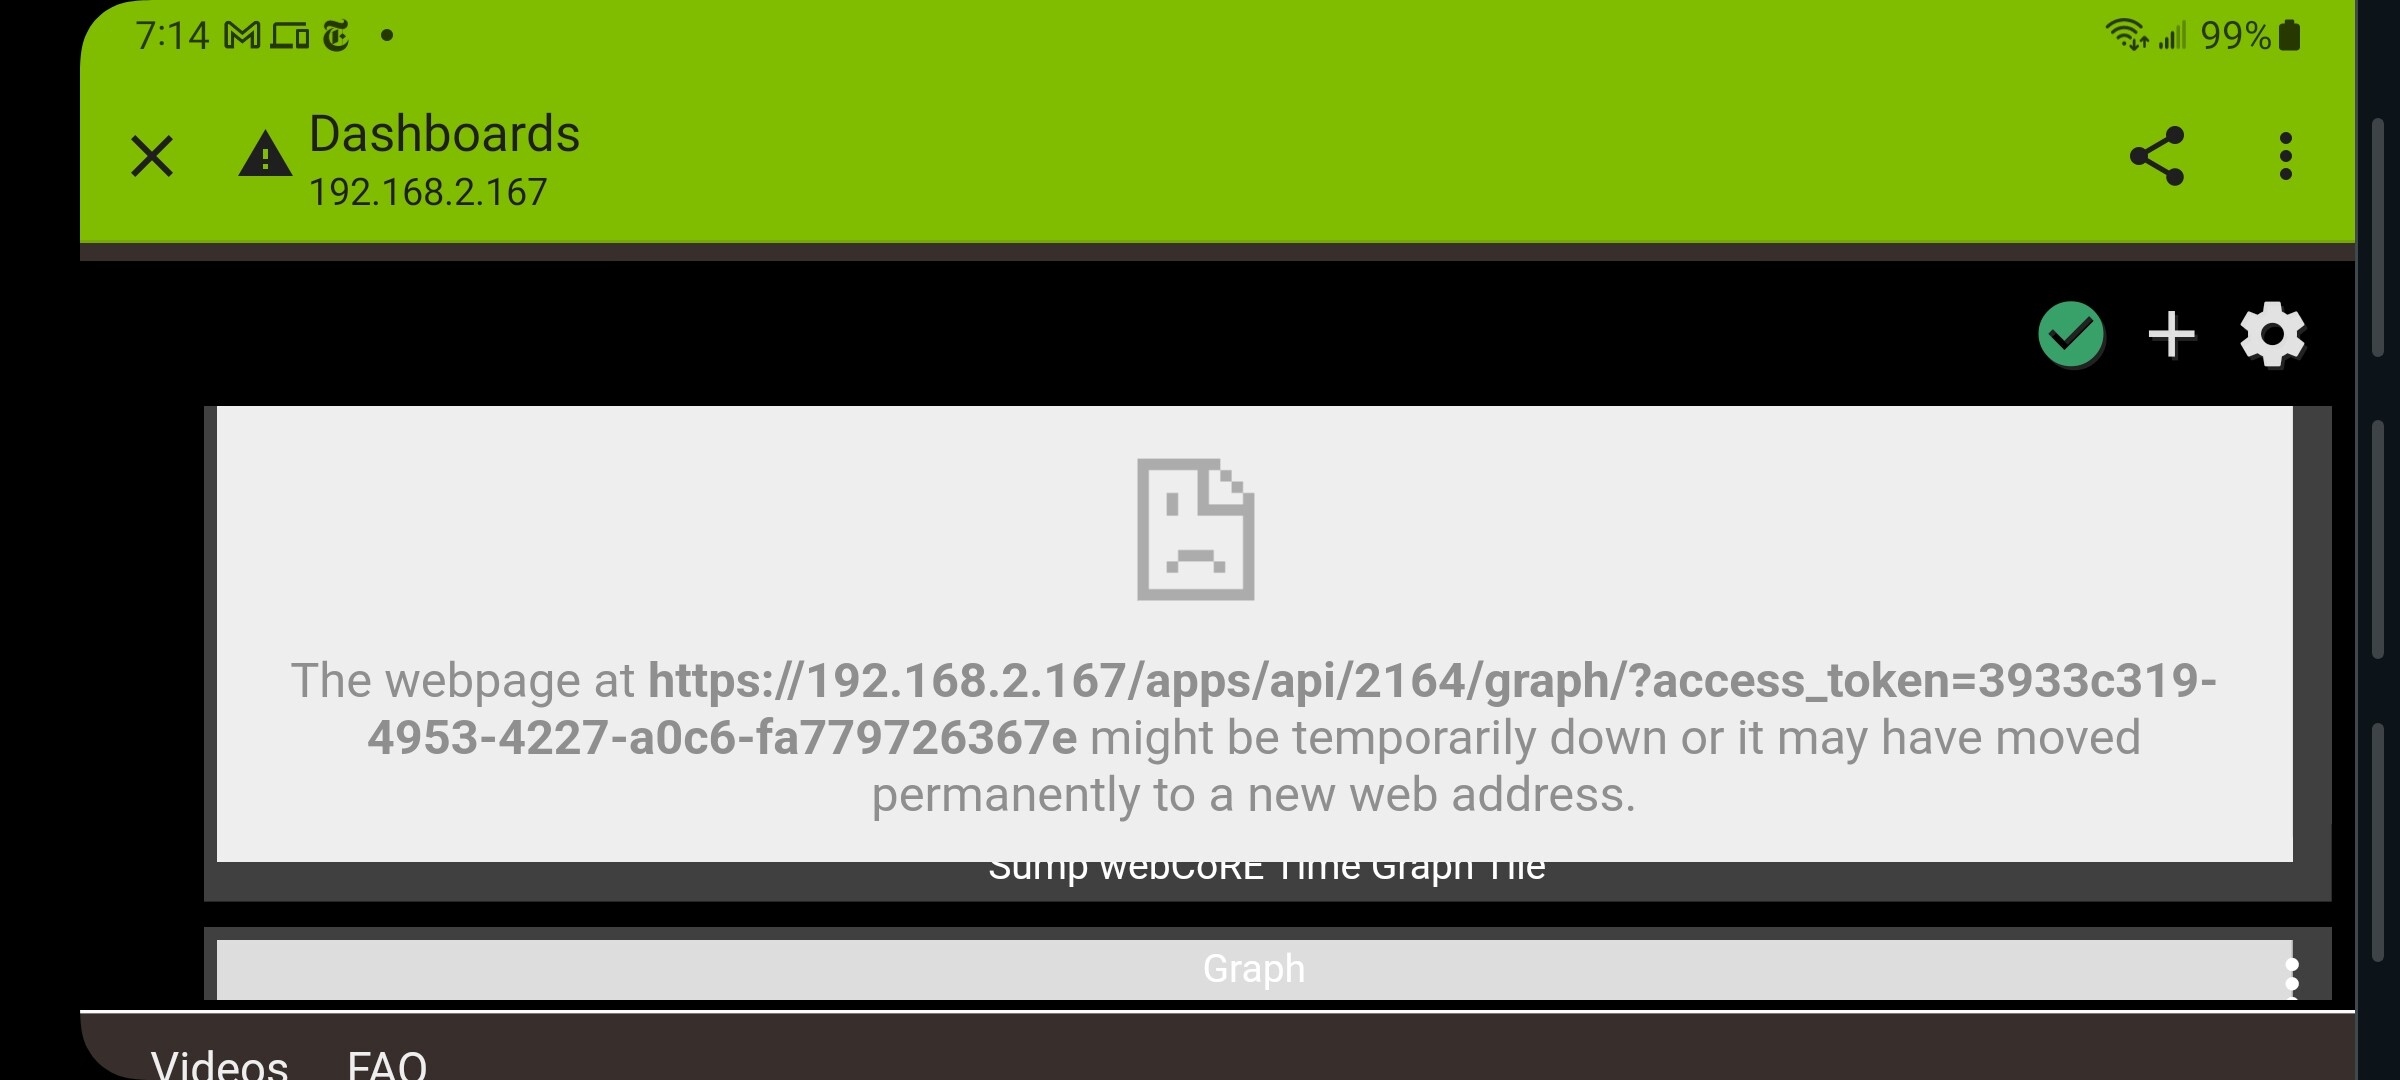
Change the https:// to http://
Evidently Hubitat can't do secure connection.
1 Like
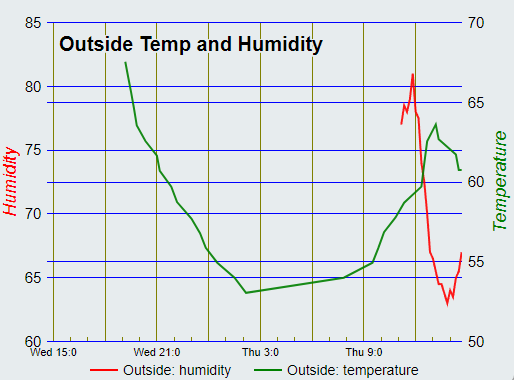
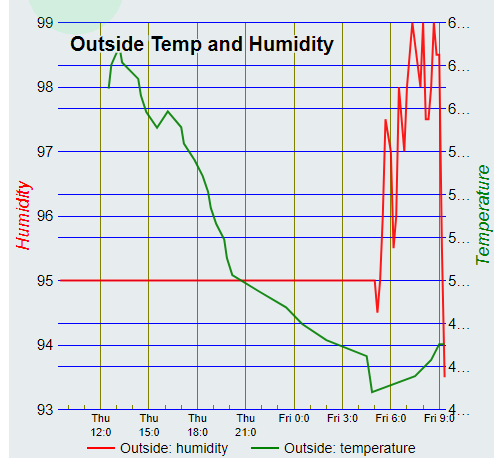
I've setup a temperature / humidity graph for a Sonoff sensor but I need help because the graph only shows a few of the latest readings from humidity and even the temperature never goes back to the start of the graph.
I set up the graph with Integration time: 10min, Update rate: 10min, Time Span: 1days. I end up with this:
Thank you. That had somehow eluded me.
There is a option to extend the graph to the left or right for each line graph that is built. Don't remember the exact setting but it's under the config graph section.
[edit]It's under handle missing values.
I don't want to just extend the line straight out to the left, I want to see the values that existed more than an hour ago. A straight line is meaningless. Why aren't values older than 4 hours being captured for humidity or 18 hours for temperature?
Are you using Long Term Storage? (LTS).
1 Like
Not sure! I don't recall ever doing anything with LTS, not even knowing what it meant either. I had installed Hubigraph, but removed it after having difficulties with it. There's not one reference to LTS, Long Term Storage, or Fuel Stream in the Hubitat docs! The OP of this thread talks a bit about all this in his first post, but nowhere can I find where/how to implement it.
There is a reference to LTS on the Select Data Sources screen, but no explanation about how to implement it anywhere.

OK.
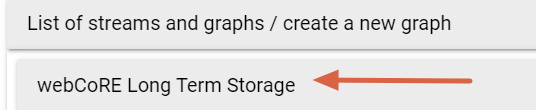
Go into webCoRE Long Term Storage.
Select Device/Data
Select your sensor.
Select the attributes you want to 'store'.
Select how long you want to store date for.
Under time to start recording, I split my times up so that they are not all trying to staore at the same time.
i.e. The first one might be 00:01, secone one 00:03. I'm not sure it really matters but it's just something I do. ![]()
And that's it. A file will be generated under file manager that will store the data for as long as you have selected. i.e. 4 days, 1 week etc.
If you now open your WC graph, you should see a button to select to use LTS.
This means it will go to the file to get the graph readings as opposed to the device.
Good luck.
EDIT: Actually with WC graphs you do not need to select LTS. If an LTS storage file is available, it will use it. Oops.
Here is what it says in the WC Fuel Stream.
Note LTS will be used if enabled for a sensor:attribute when you select a sensor
I was thinking of Hubigraphs. ![]()
Sorry didn't read you OP close enough, but you want to use LTS, as explained by @bobbles . The device themselves only keep a small amount of data in the event logs. You can increase that on the device page, by increasing the event history. I don't think that is recommended, using LTS is a better option.
1 Like
Um, that would be great if I could do it. In the Hubitat APPS, I click on WebCoRE and don't see anything about Long Term Storage.
When you click on WC in your apps menu, bedsides seeing all your pistons and graphs you will see this.

Click on it and this is where you select devices you want to put into LTS.
Alternatively click on the main WC app, then graphs, and I believe you should see this.
1 Like

This thread has raised my interest in al this, and I have a few sample graphs now.
Are you displaying the graphs in a HE dashboard, if so, how do you do that?
I’ve answered my own question! For anyone else:-
- In WC app, go to the graph, then select install tile
- Add device to the HE dashboard you want to display in
- Add tile to dashboard, select tile device, template=attribute, attribute=graph
1 Like
Another question, I’ll try not to answer myself…
How do you display the hubitat information tile?

