
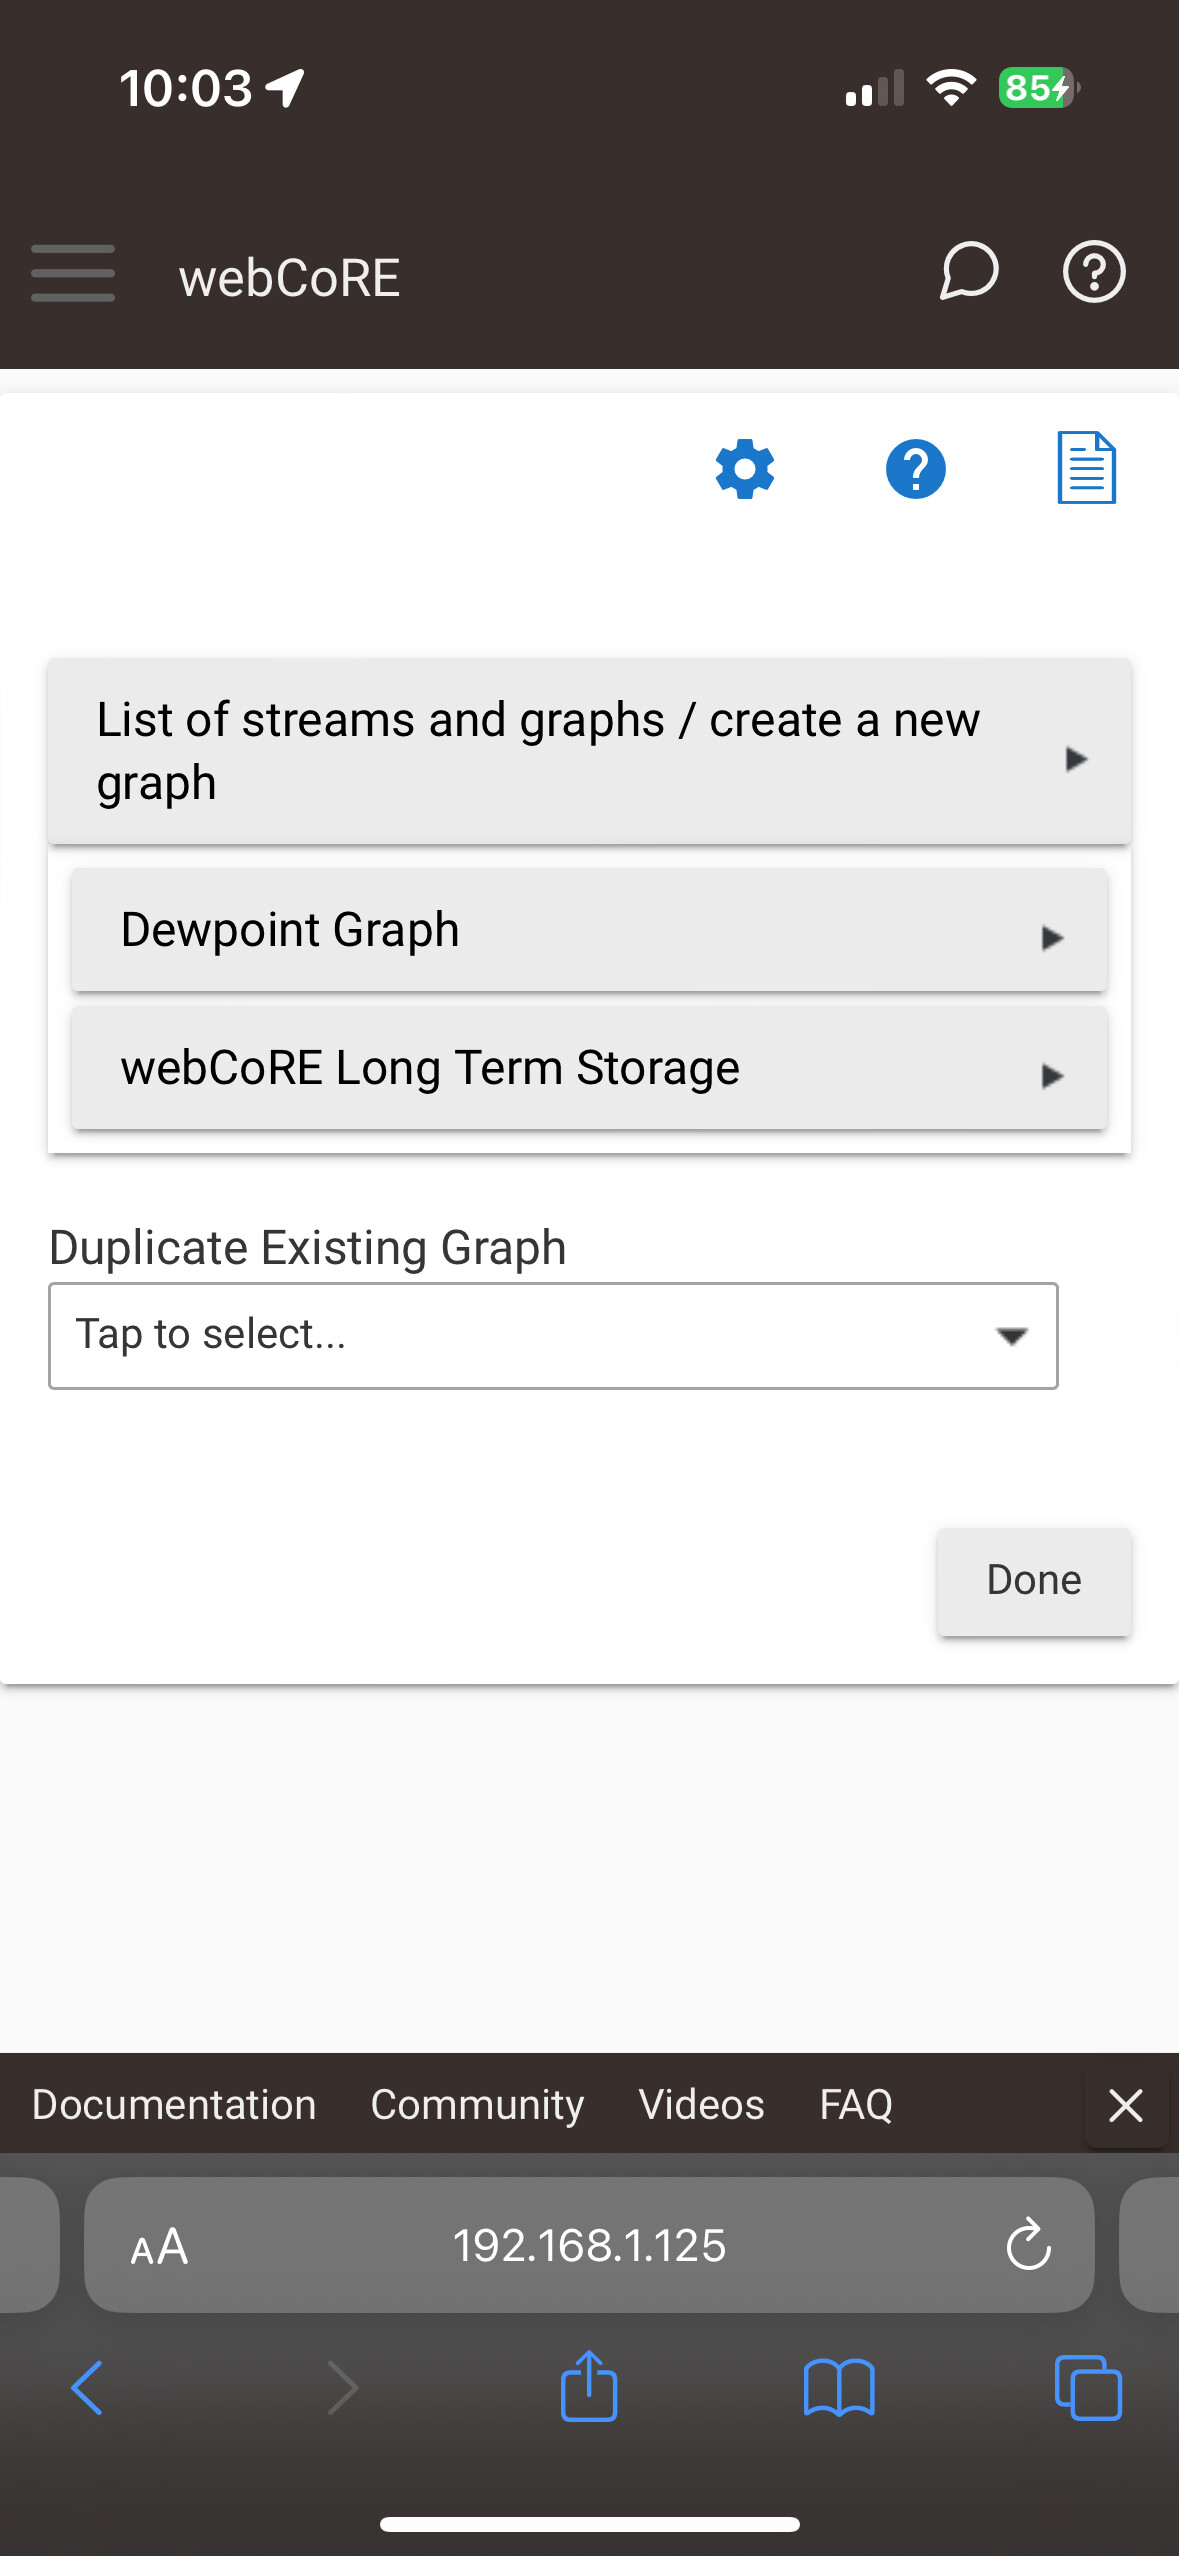
Then when I click on GRAPHS:

Install @thebearmay's hubitat information driver.
Much more than info that can be shown than there is displayed on that tile.
Is it the main apps menu under webCoRE?
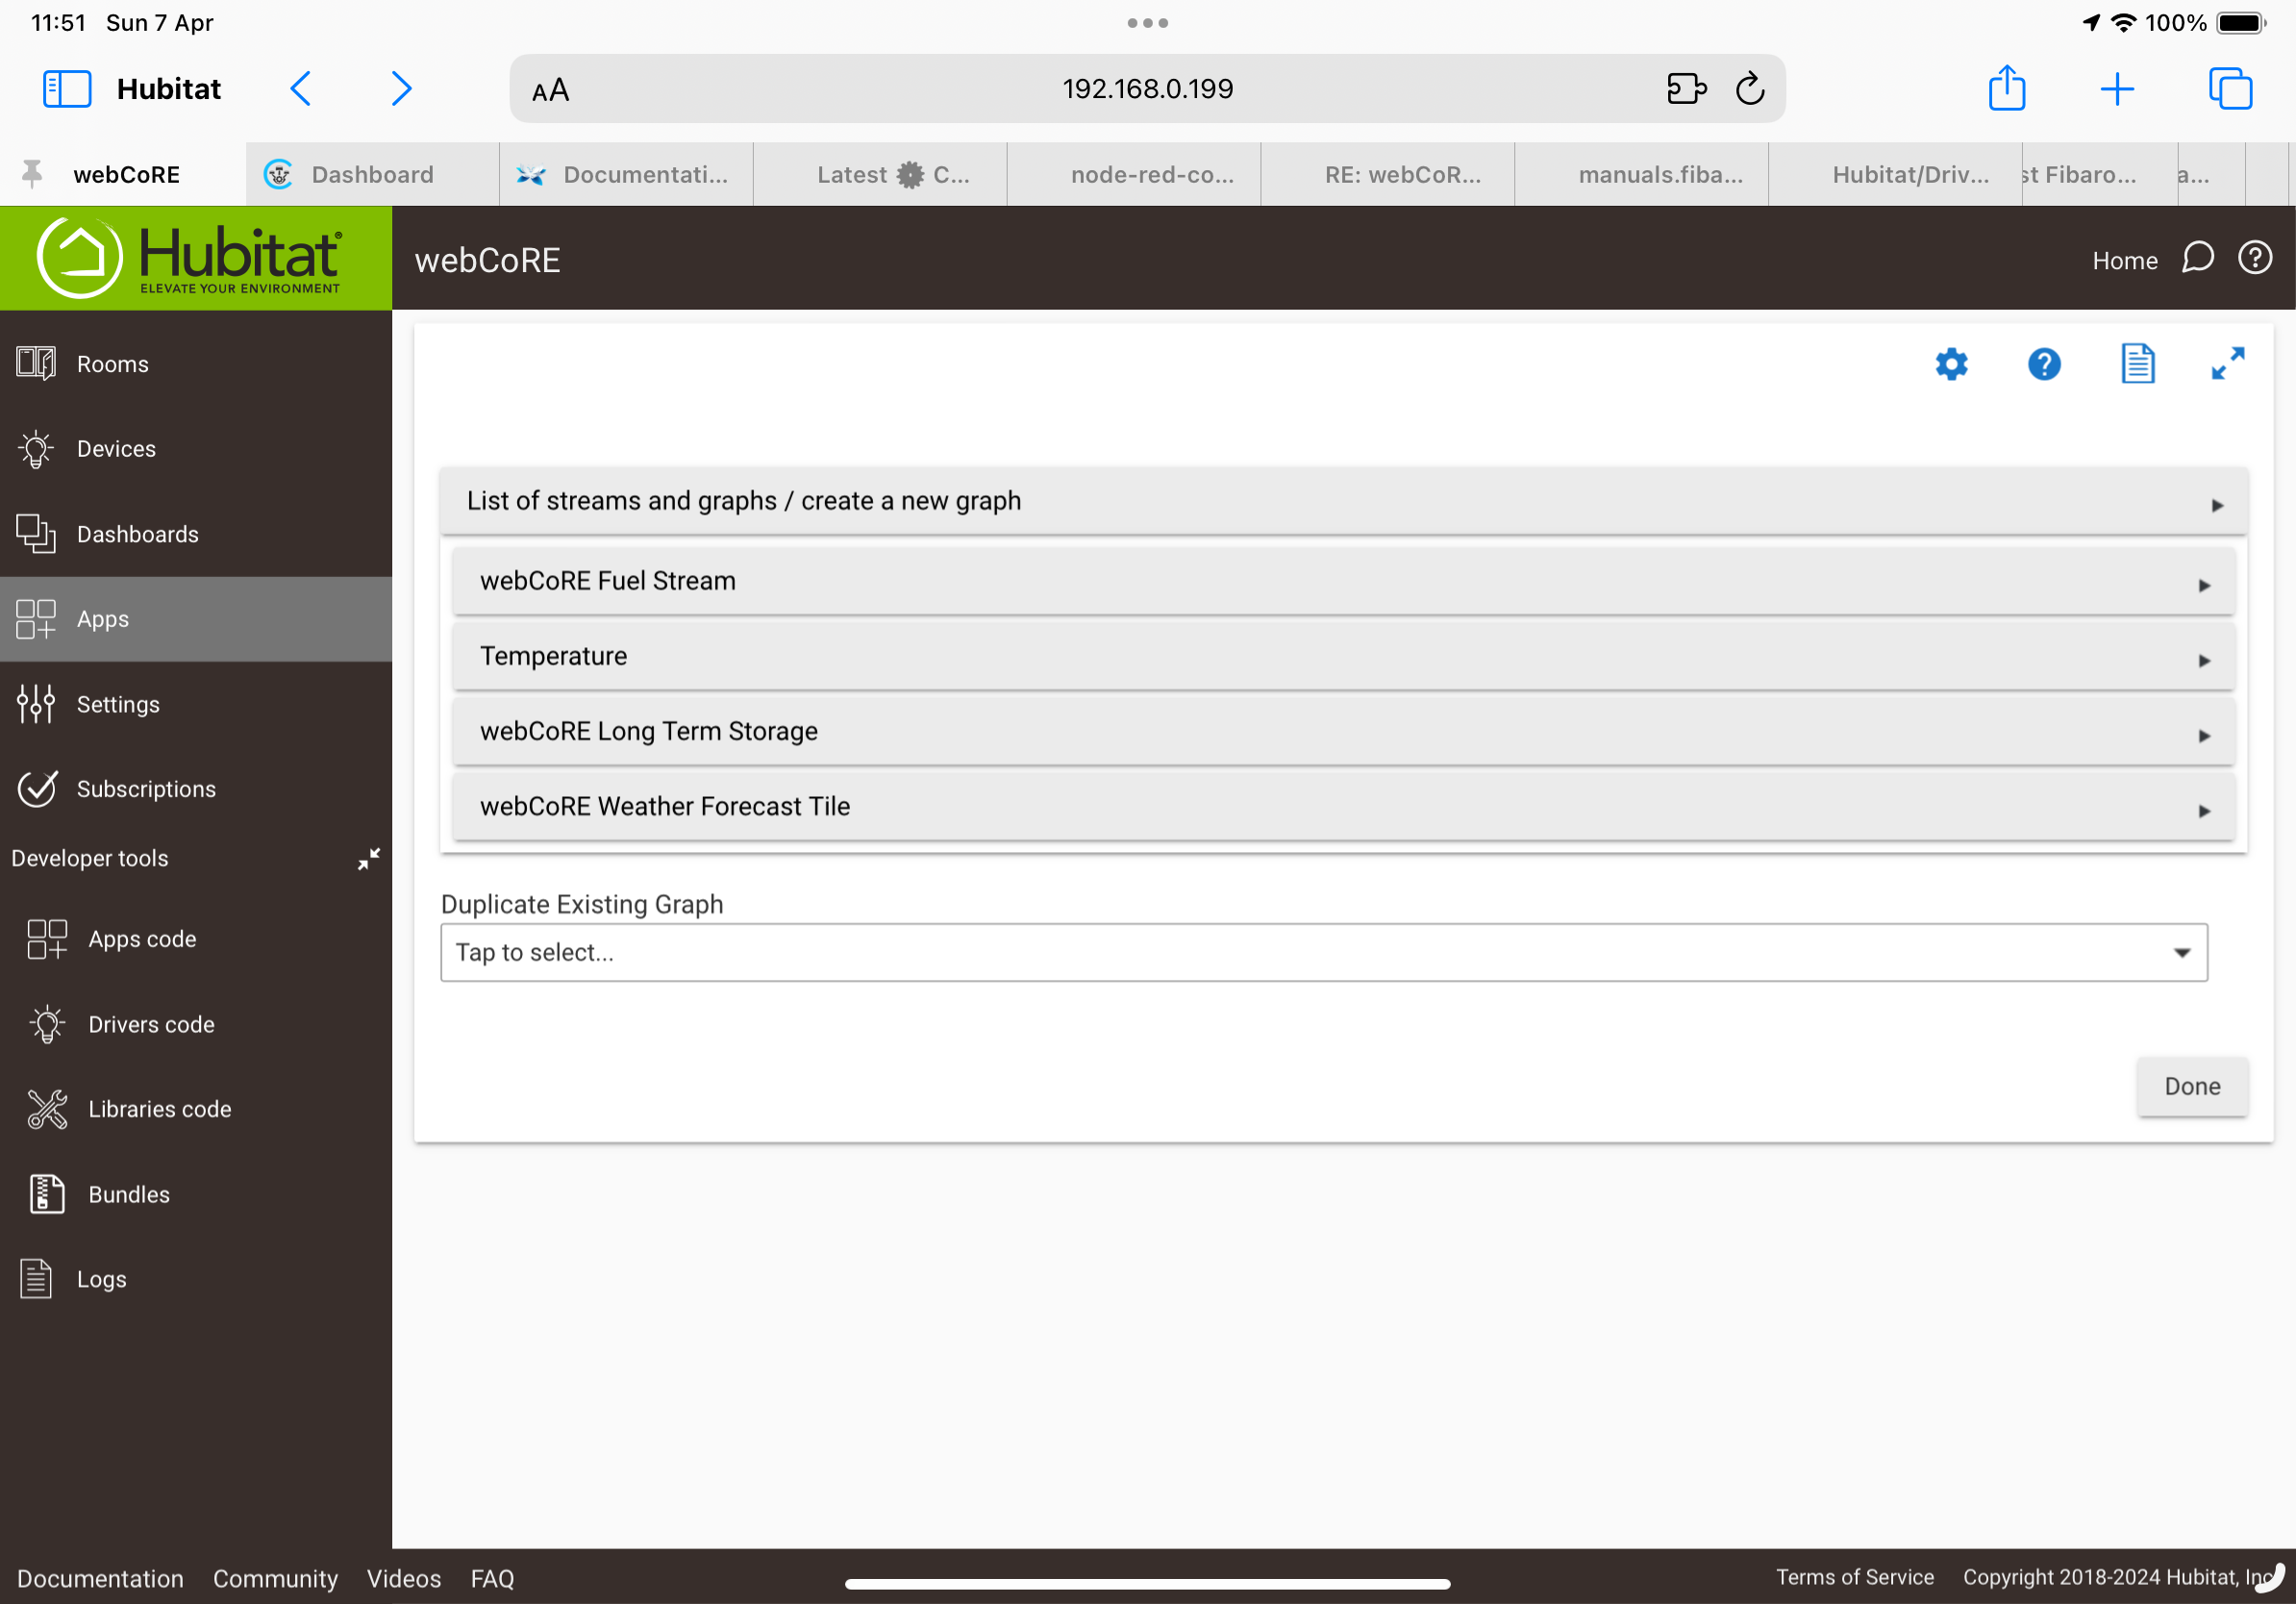
Ah, yes! Clicking on GRAPHS then has the ilnk for "List of streams and graphs / create a new graph" (or LTS). Clicking that, then selecting a "Graph Type" of Long Term Storage" did it.
Thanks all! Now we'll see if that improves the performance of my graph...
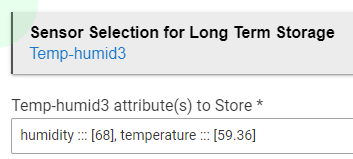
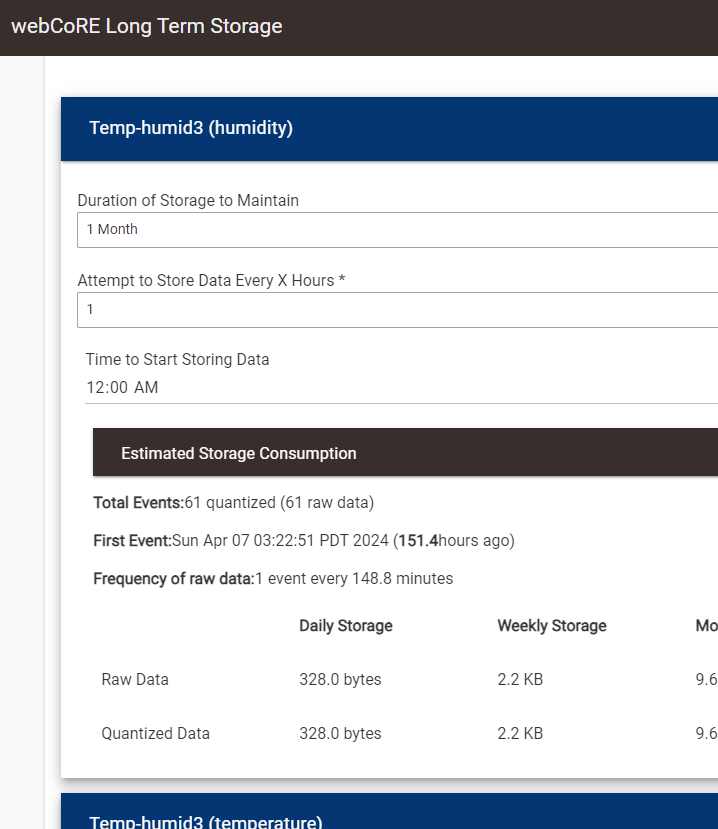
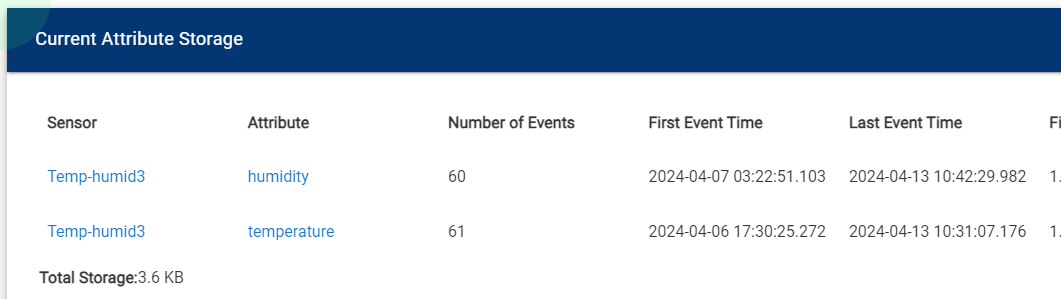
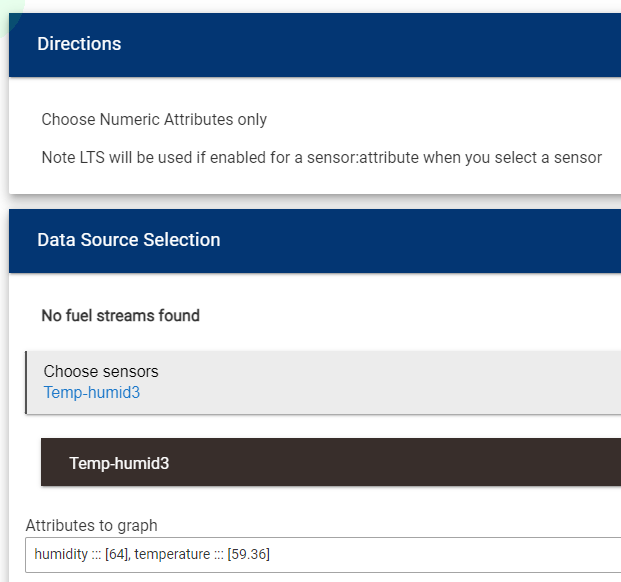
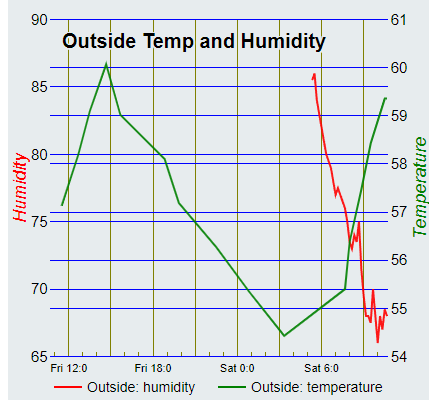
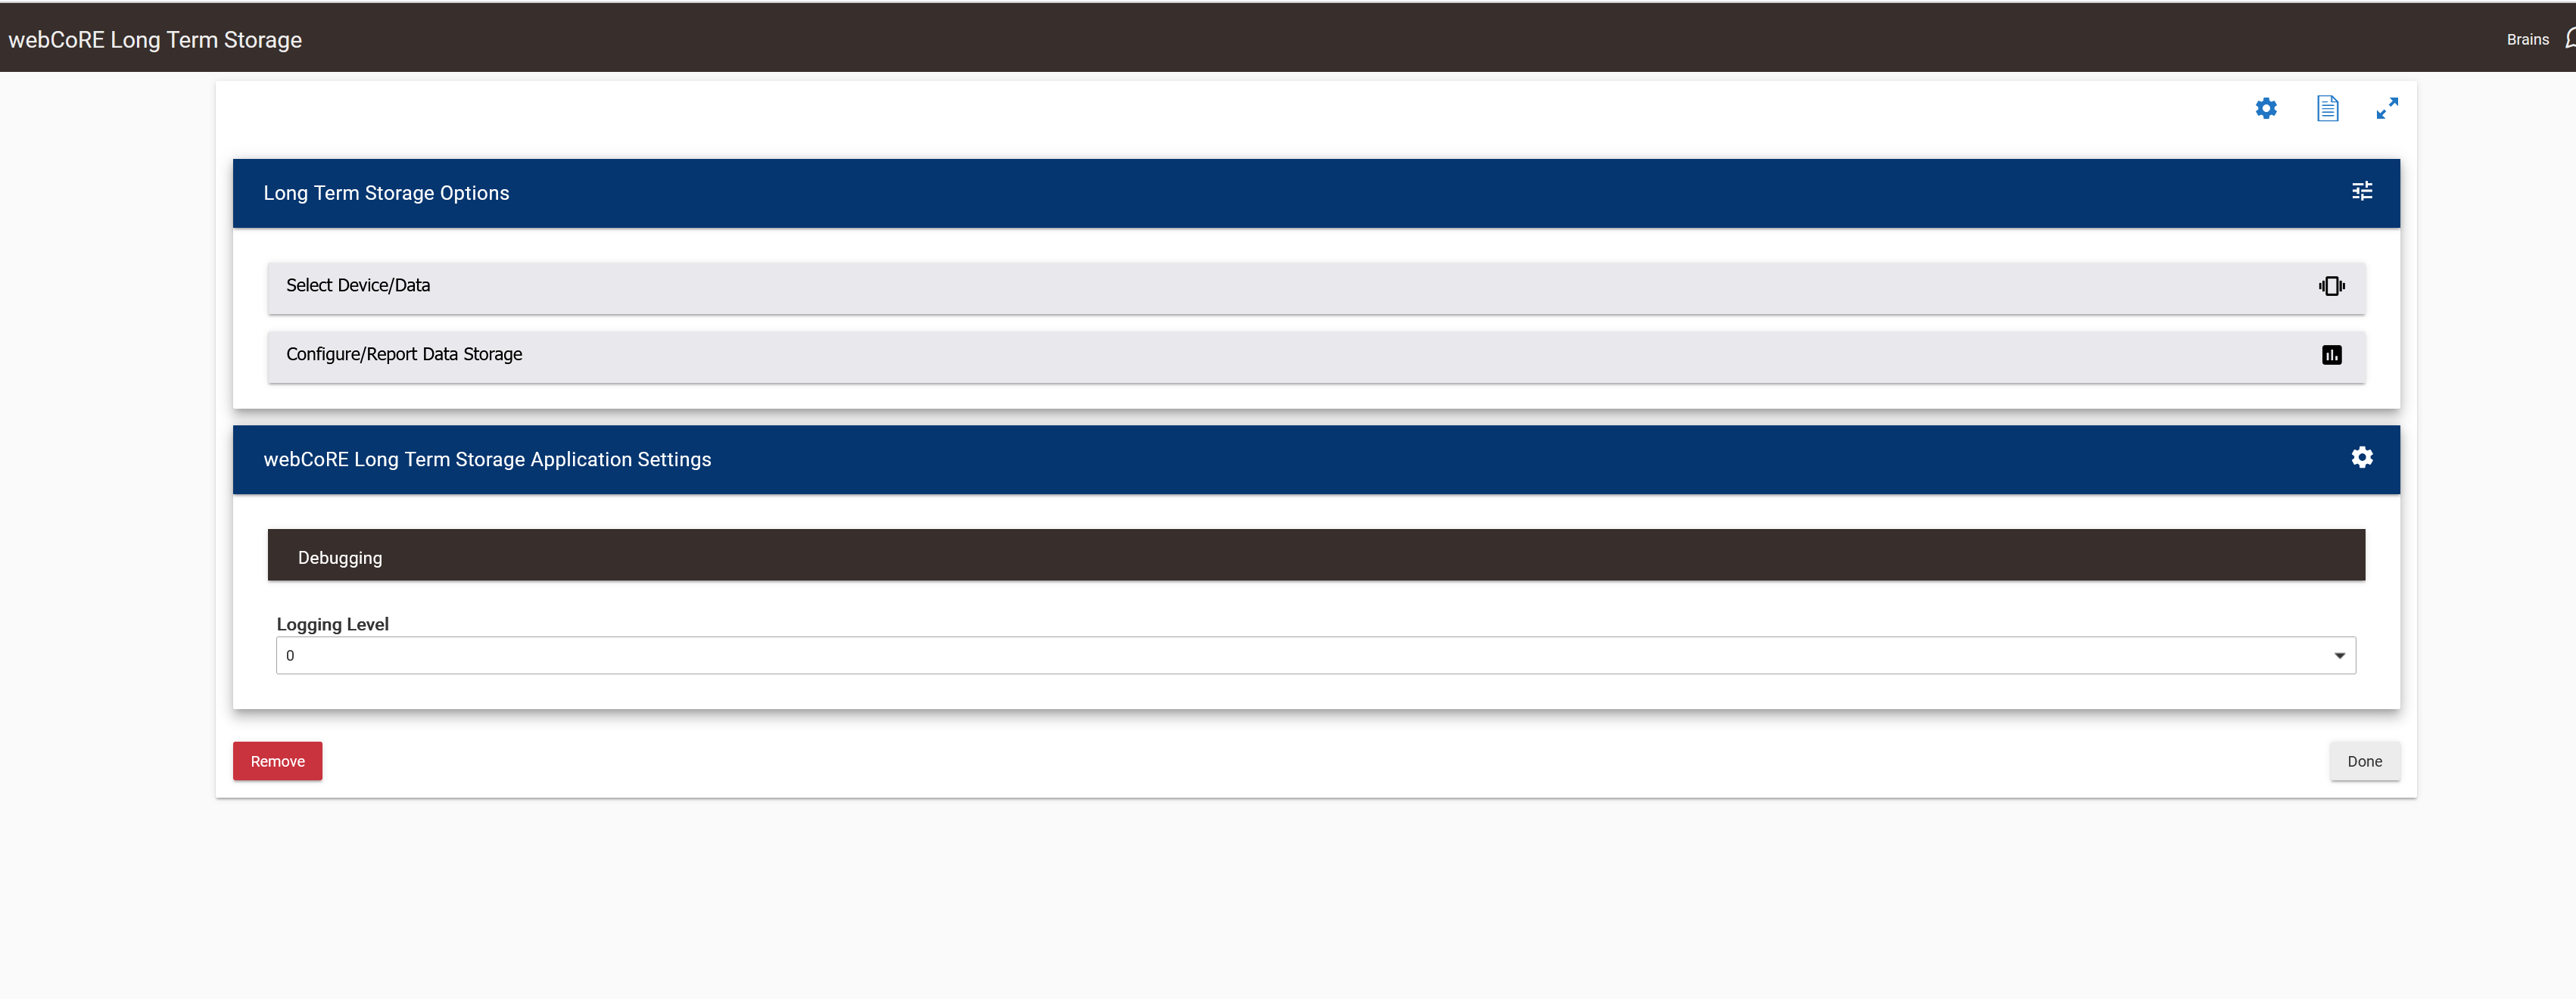
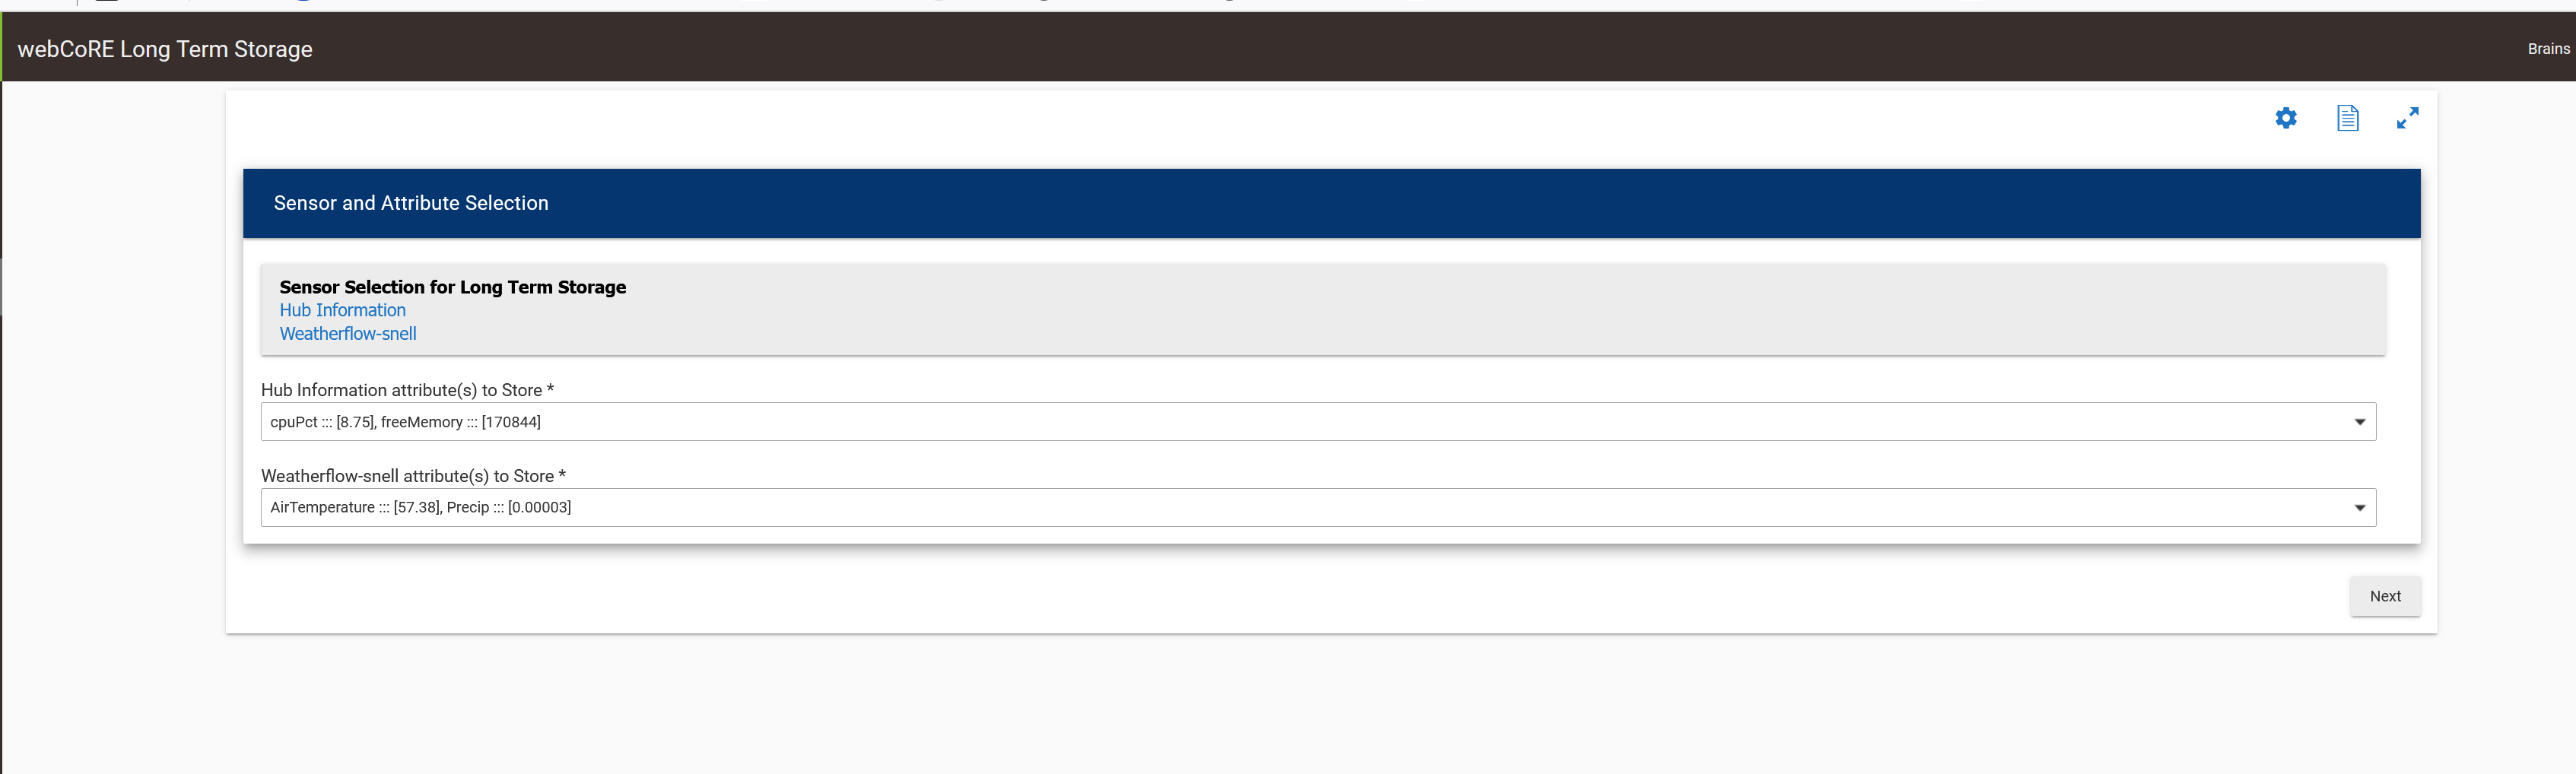
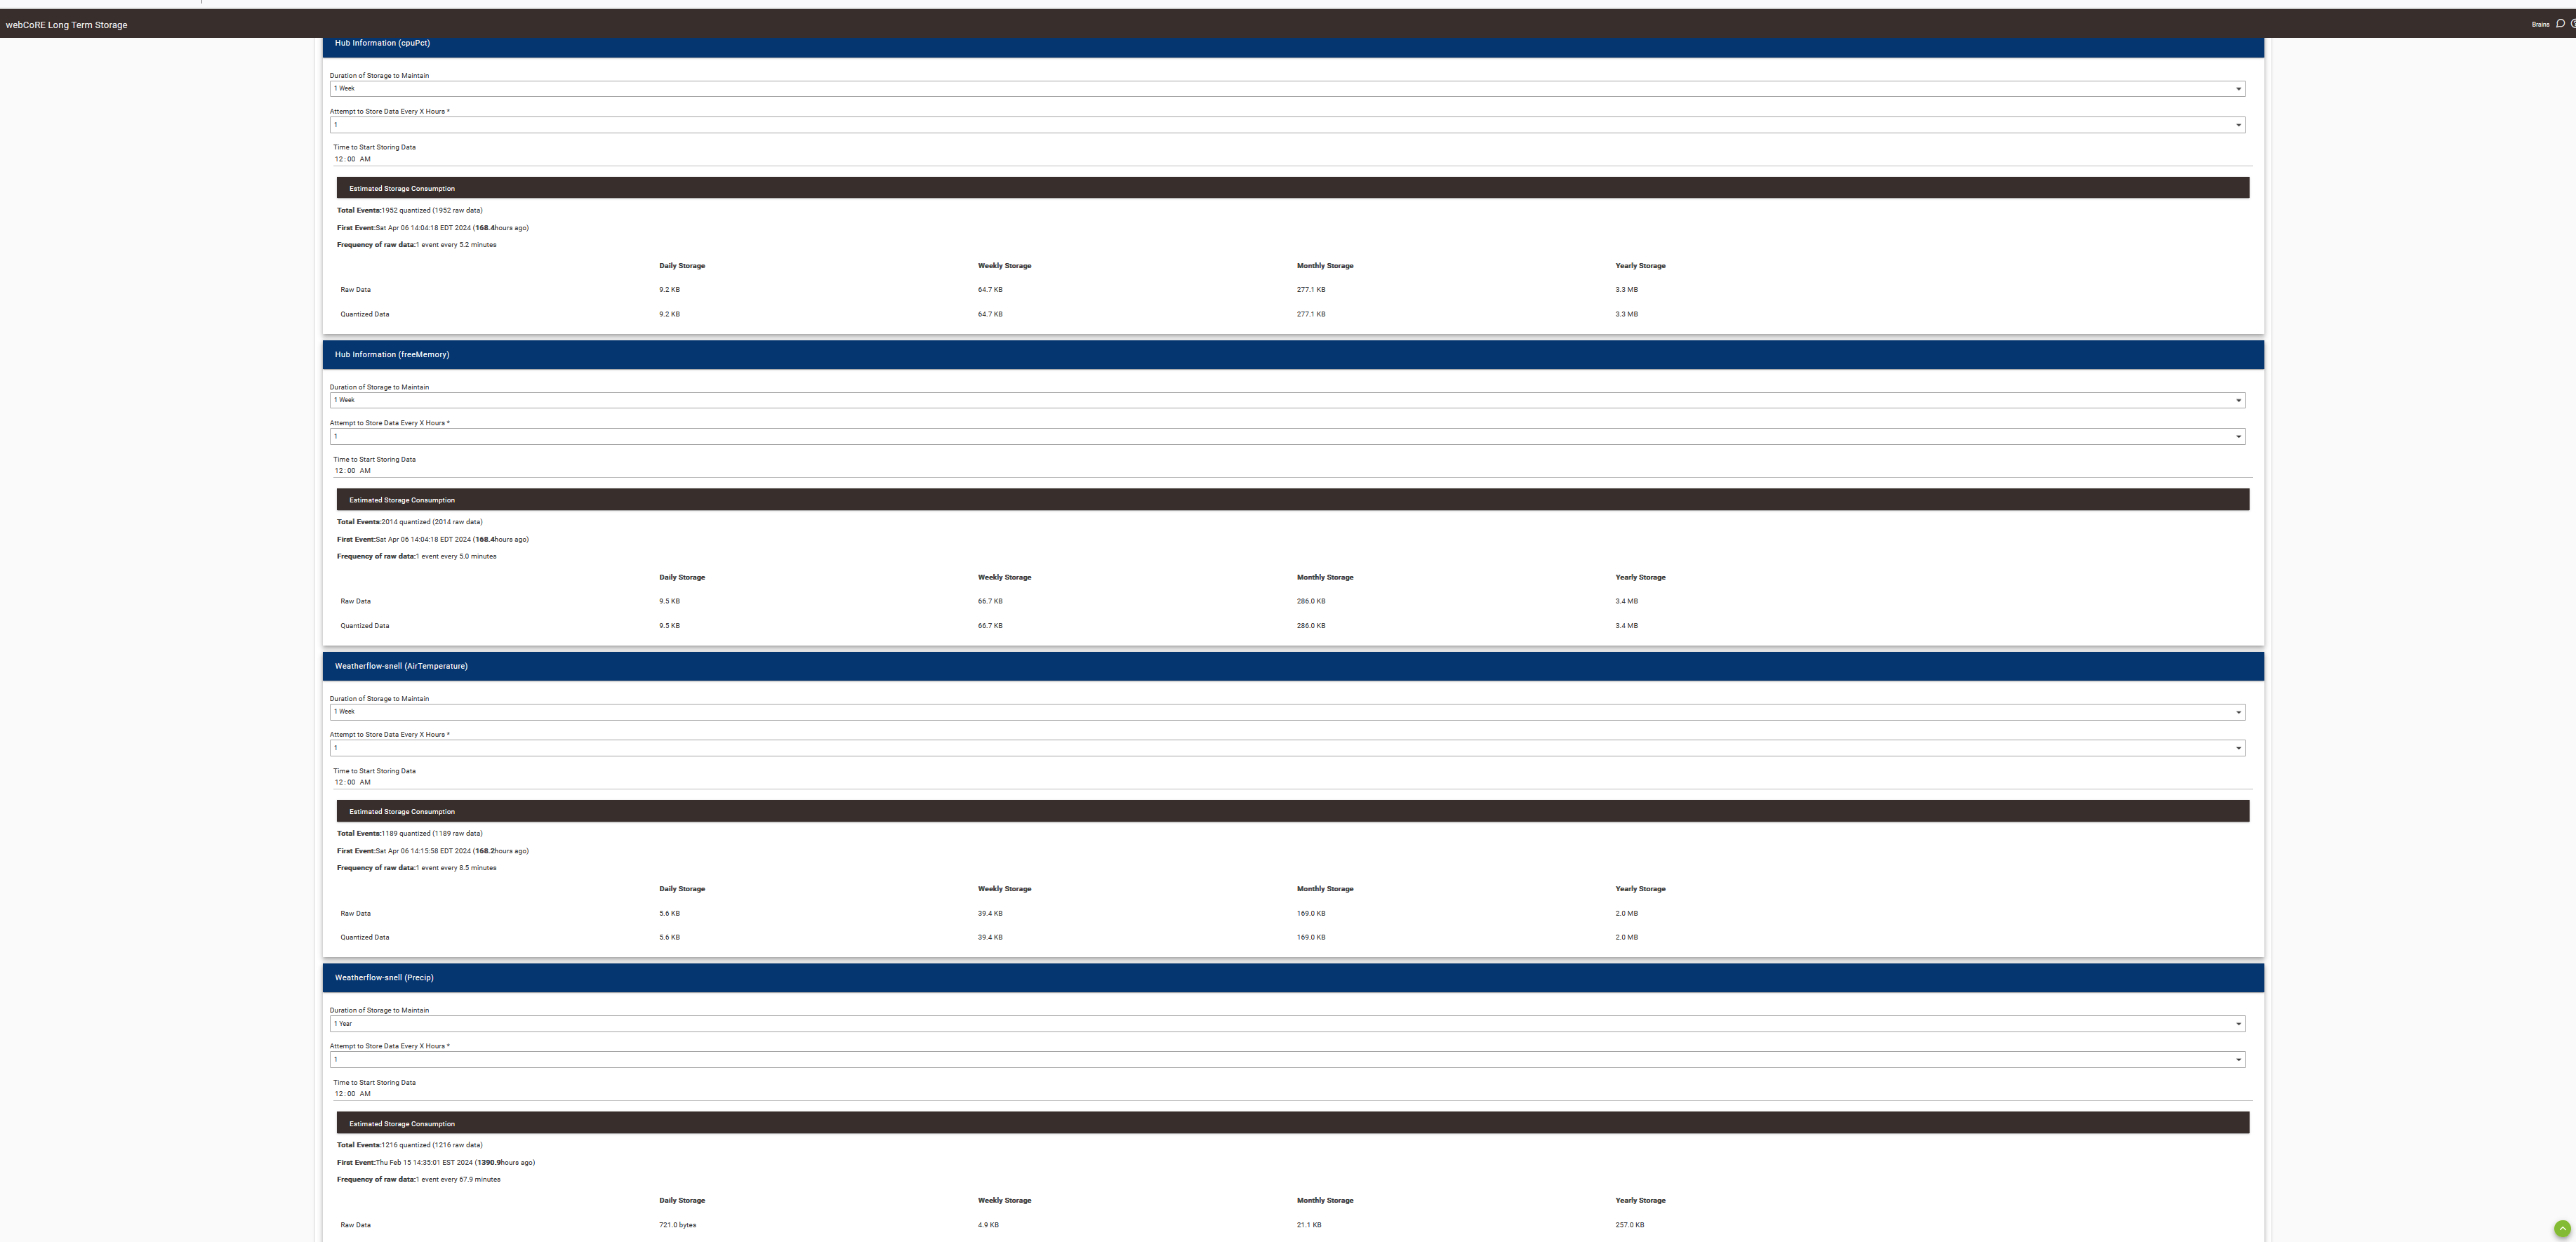
Yeah, that's just about exactly what I've shown above. So where's the problem?
You probably already realize this, but just in case. You need to allow time for the graph to populate.
Your humidity data says it goes from the 7th at 03:00 and the Temp data starts at around 17:00 on the 6th. From the graph that looks like that is where the two graph points are starting. So as more data comes in on humidity it should fill the graph. There is no data earlier than the 7th for humidity.
I wish there was a way to pick another storage location for LTS. If I had it my way, I'd store everything forever (for relevant points/attributes), but it still adds up and I will hit the hubitat limit if I don't take care to painfully pick exactly what I want. Storage on my NAS is cheap and I would like to store it there. Is this possible and I missed it? Or where can I make this request formally?
I'm also fine with a service like Google Sheets or something.
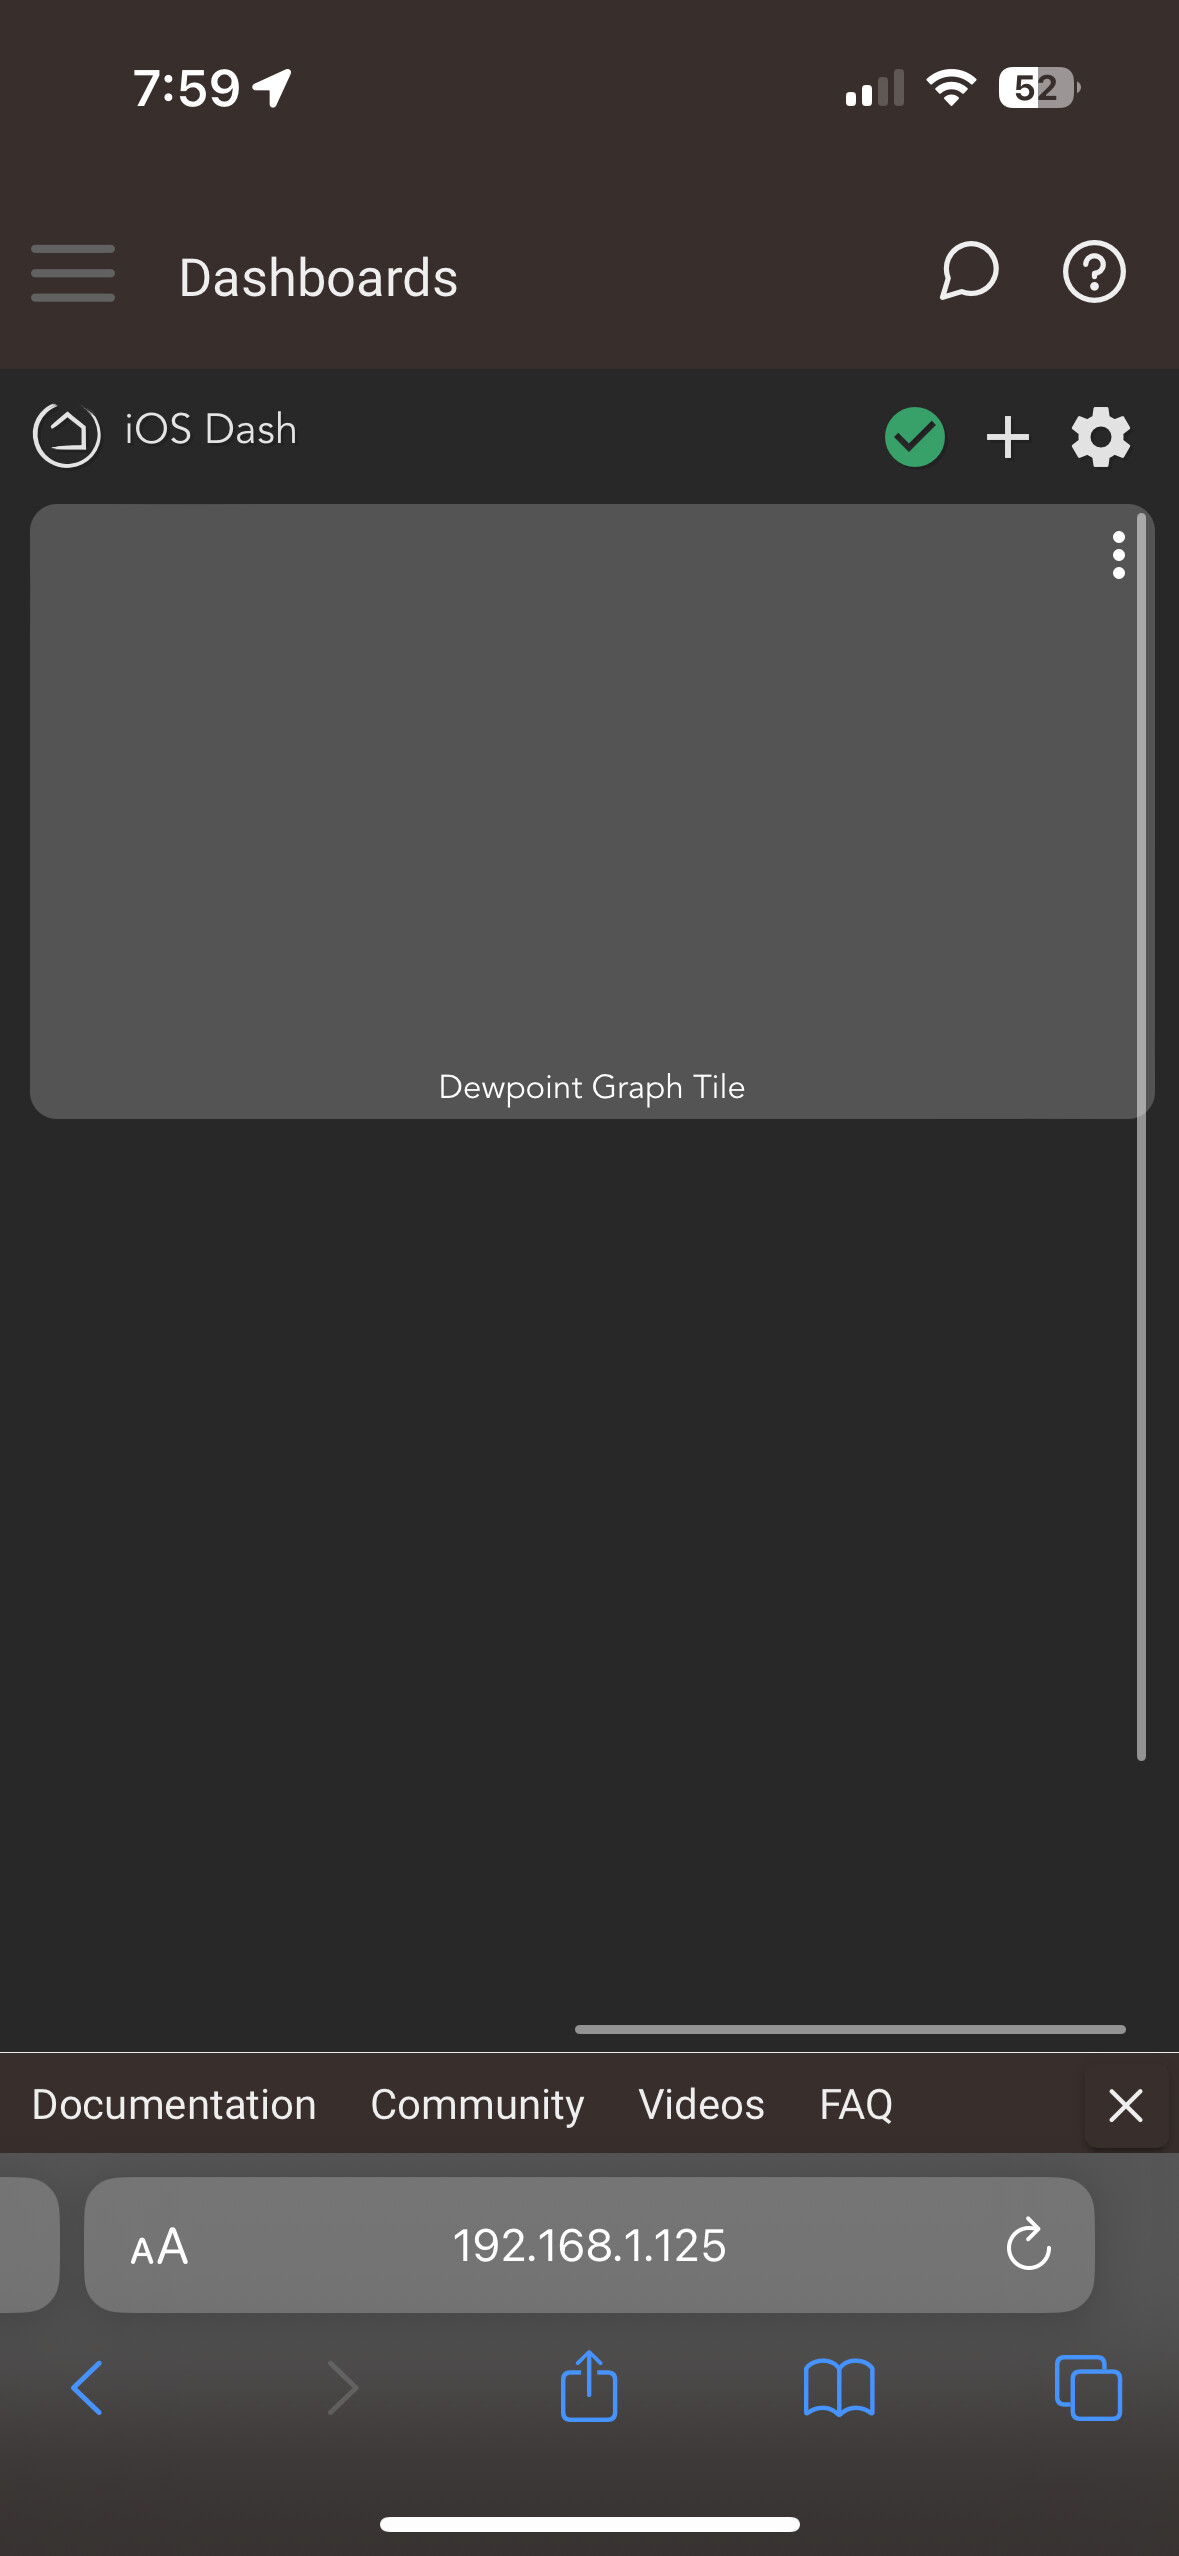
One additional question. The graph tile device does show up on my dashboard on PC, however it does not show up on mobile - both on safari and on the hubitat app itself. It's just blank grey with no graph drawn. Any ideas?
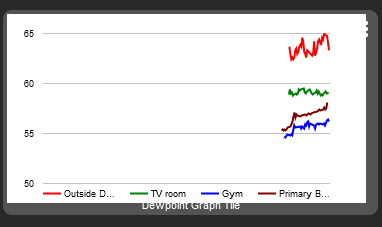
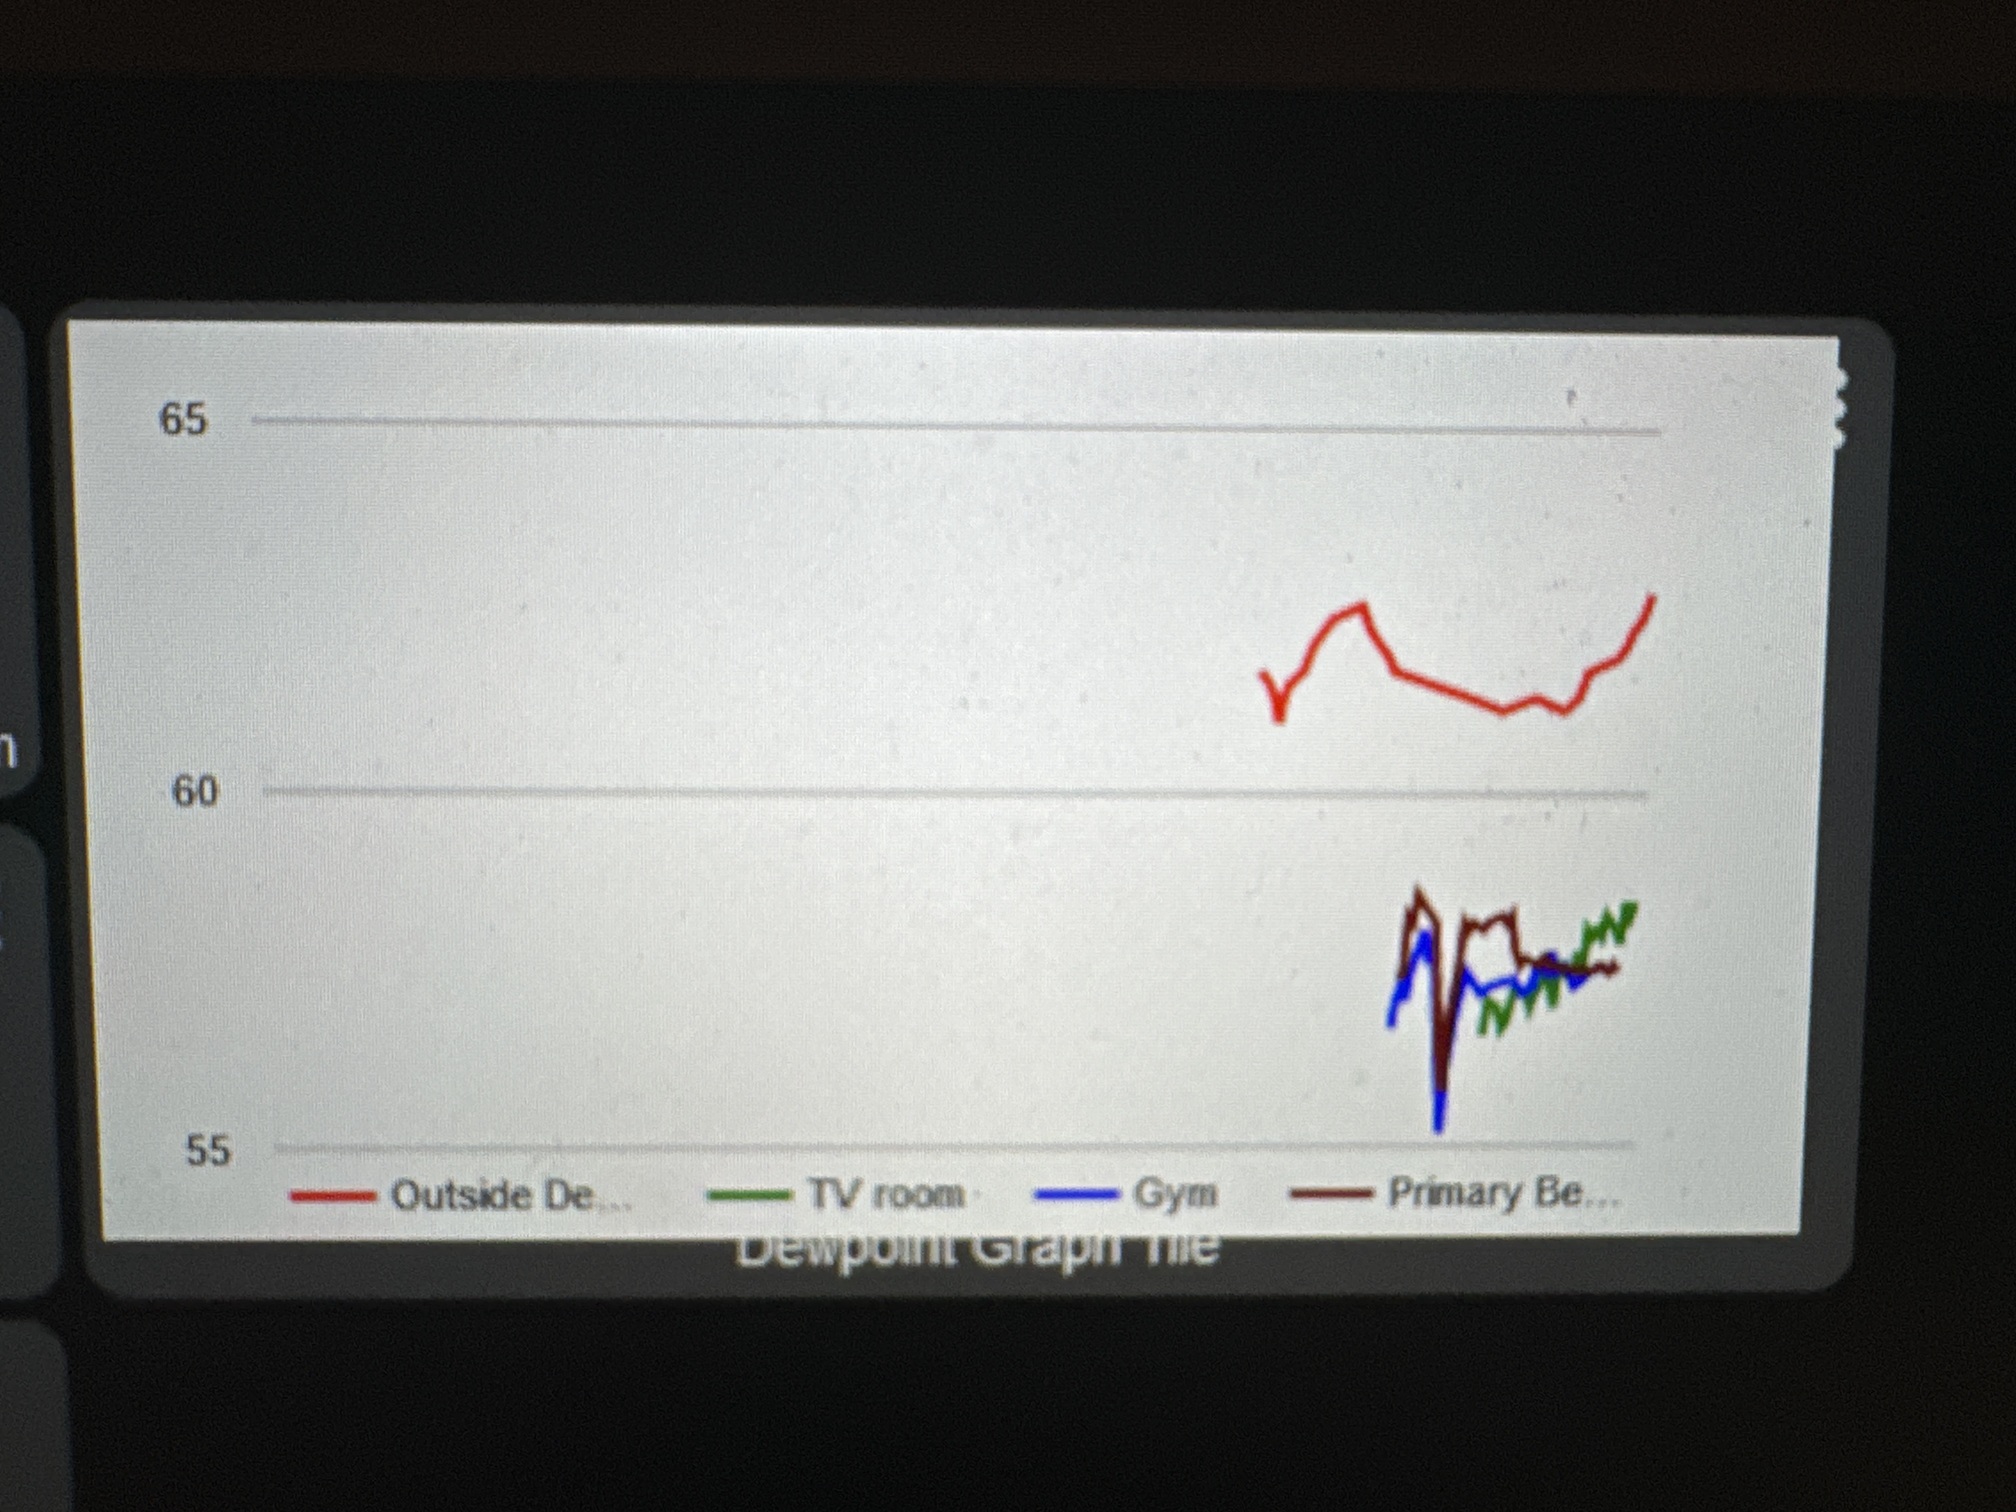
Here it is shown on PC:
Here it is shown on iOS:
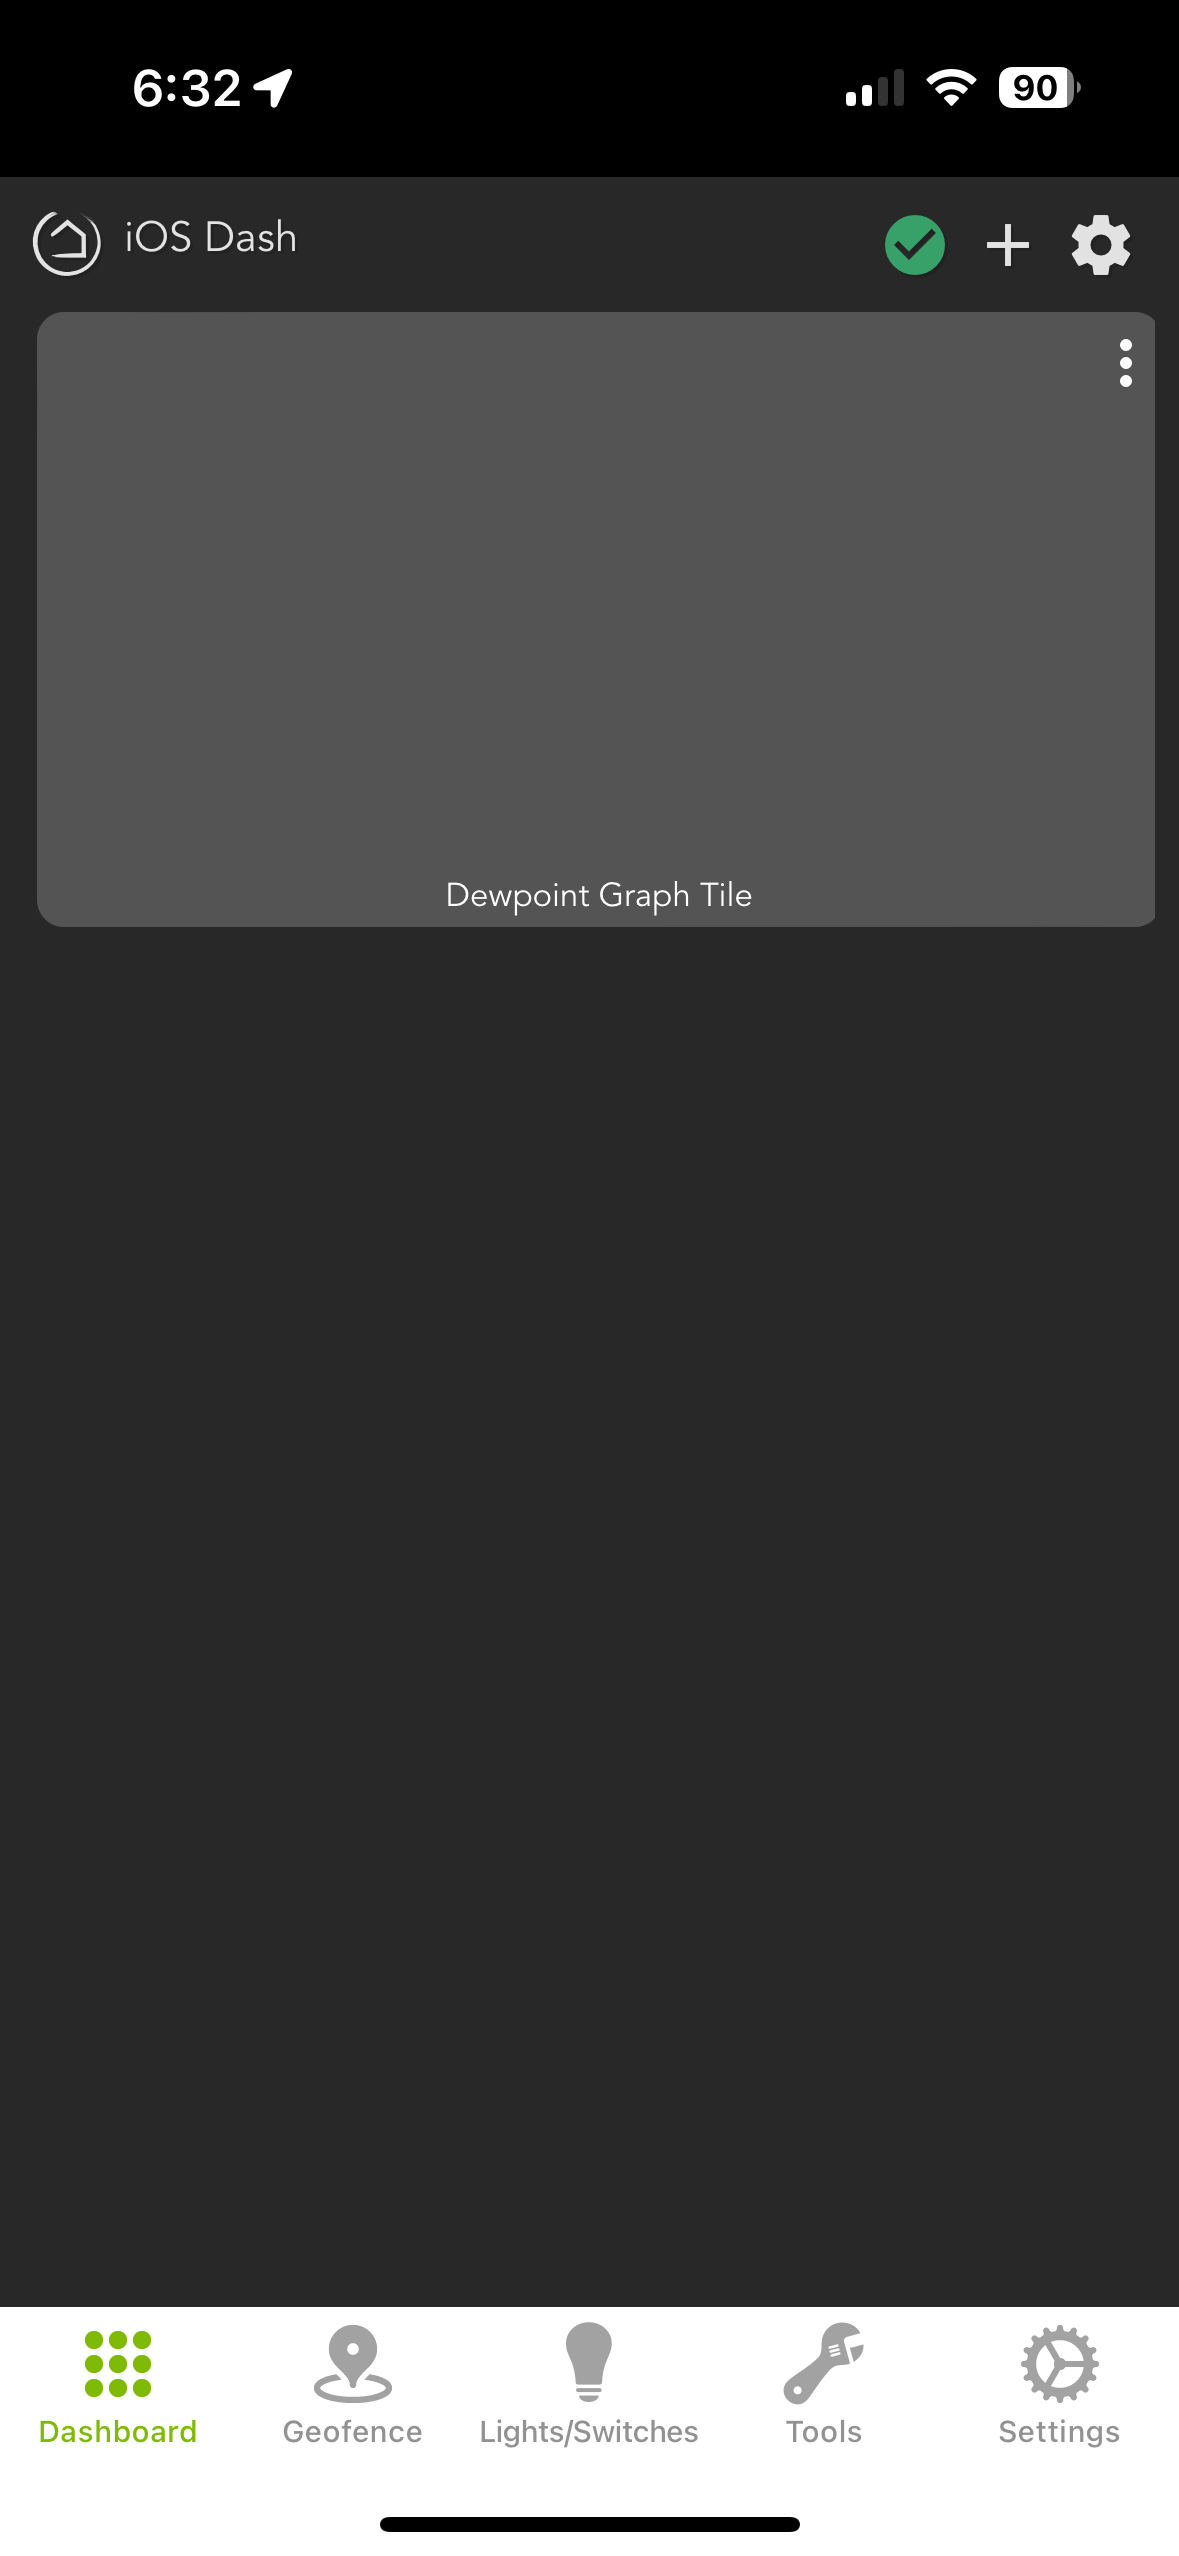
Edited to add screenshot of iOS.
Known issue - nothing generated locally comes through the cloud connection.
At least for me, even going to the IP address on my mobile browser, then navigating to the dashboard, I still see no graph. That should not be through cloud connection.
make sure you are seeing it as local on your phone. Also is your phone on the same subnet as your hubitat?
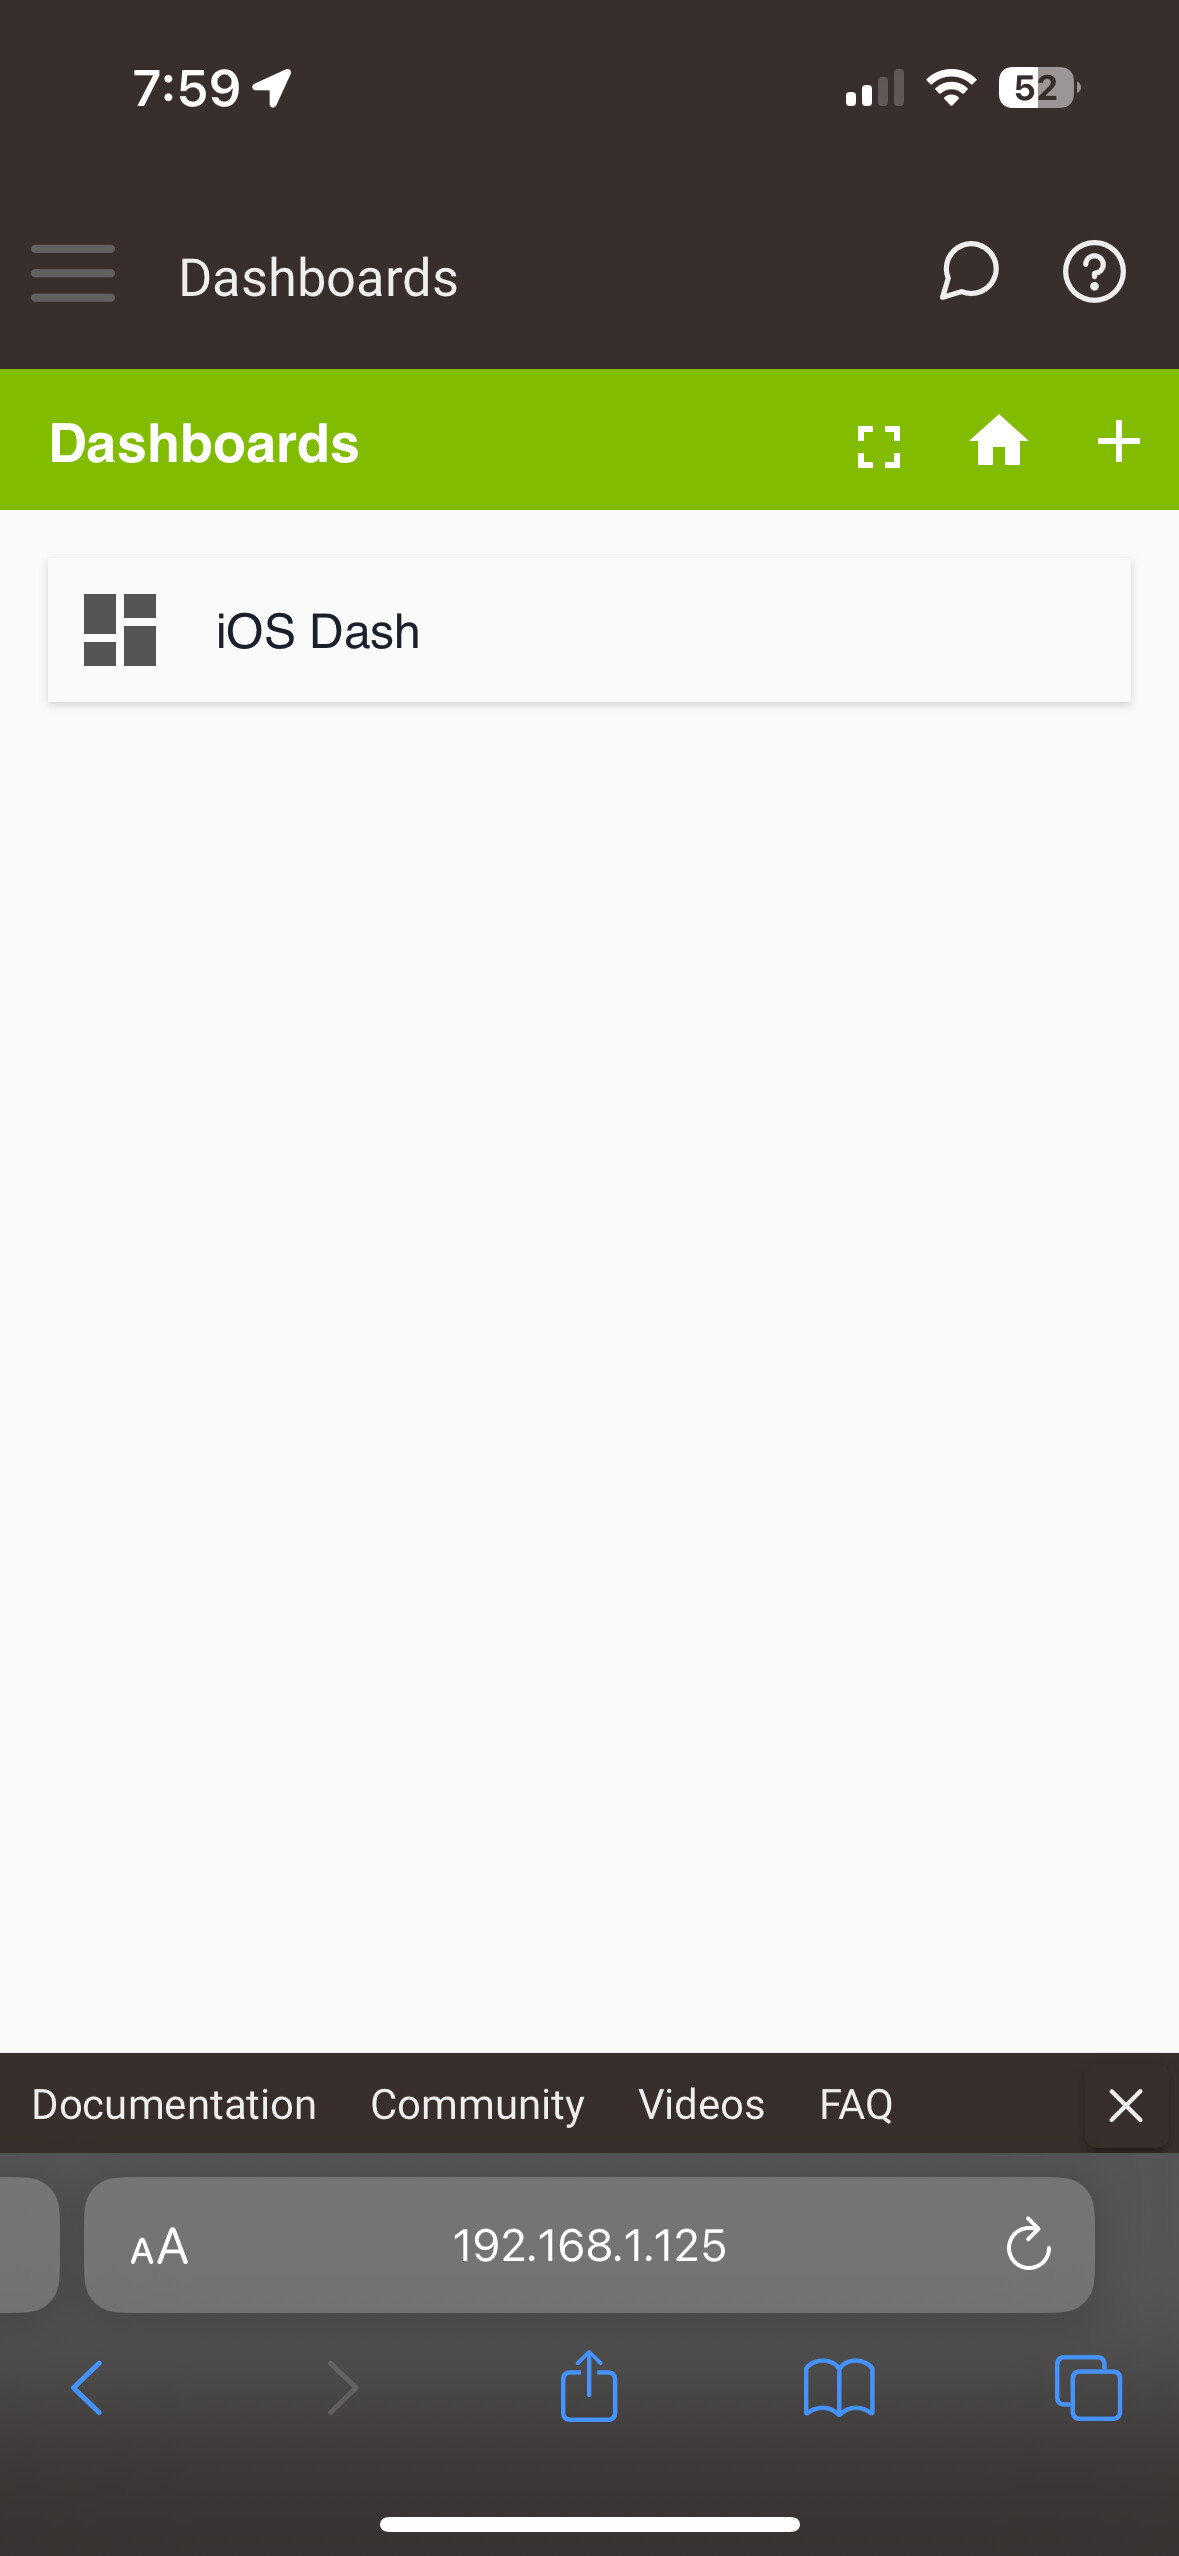
Do they show up on your pc?
You need to use Long Term Storage, set time span in the graph for days (mine is set for 5 days)
I have LTS set up for multiple years of data.
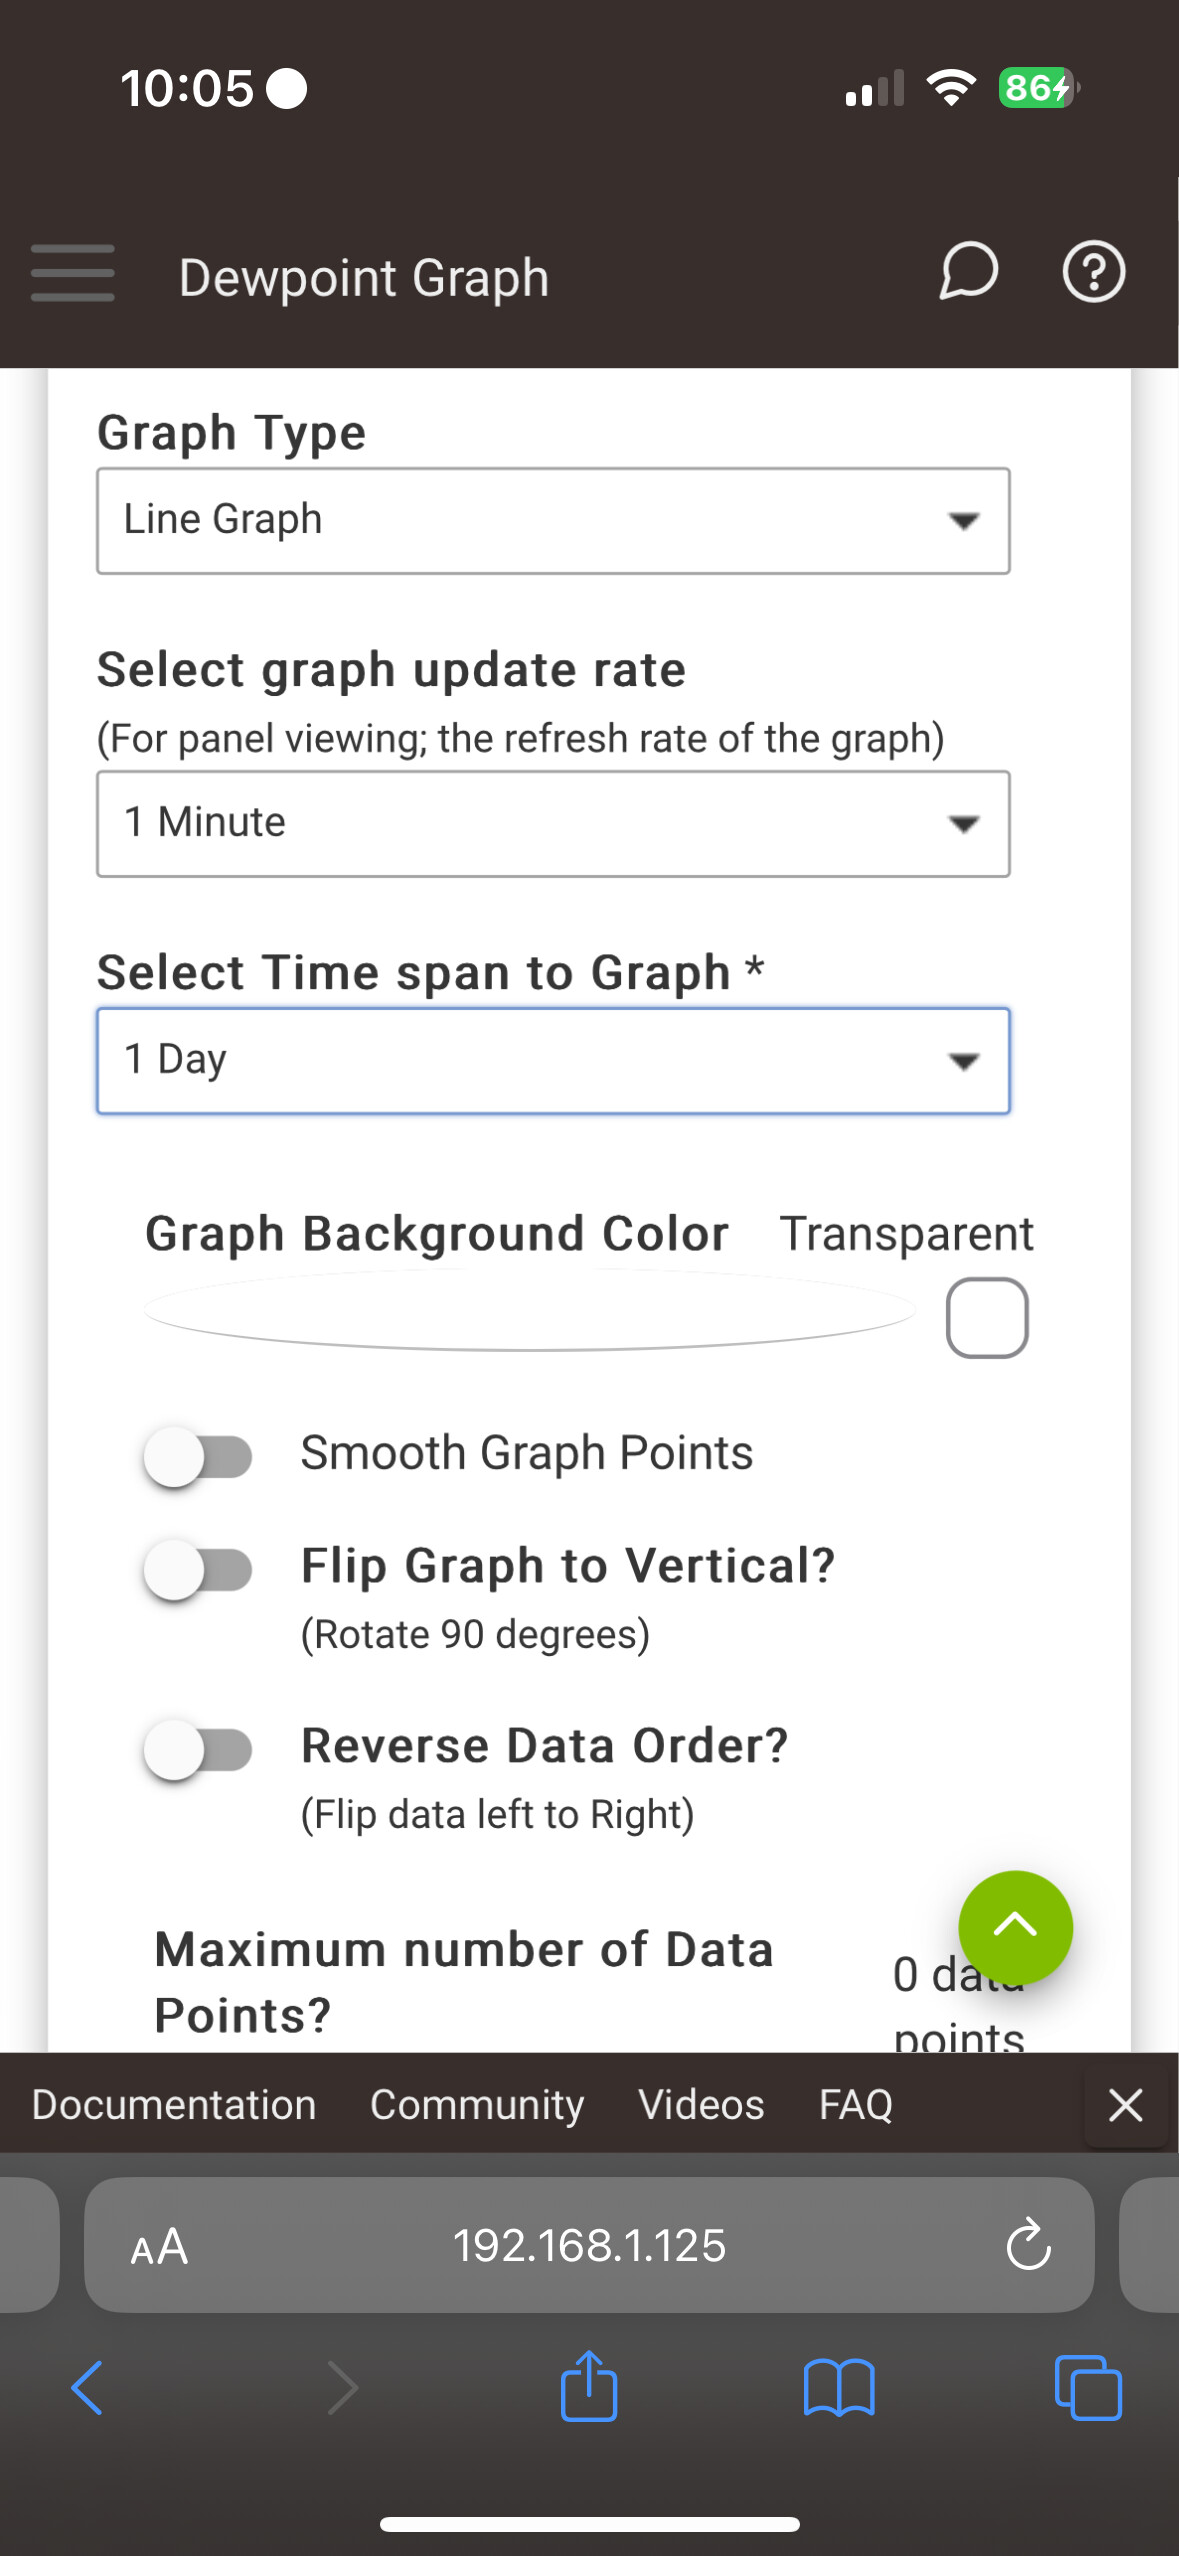
If I change the graph to something like 3 days instead of 1 day, the graph just shrinks even more. It’s pretty odd.
I did figure out the local vs remote issue at least, the graph said to use HTTPS. I toggled that off and it shows up on mobile at least now.
Still Not sure how to get it to fully populate instead of being scrunched to the right though.
Have you only just set up LTS?
If so, the LTS file will only have data from when you set it up.
Nope over a month so far! Maybe it’s not saving properly?