I must admit I use Hubigraphs and not WC graphs. (Which should be the same).
Maybe try installing Hubigraphs via HPM and give that a try and see if it works better.
I know this doesn't solve your issue but it may work differenntly. Who knows. 
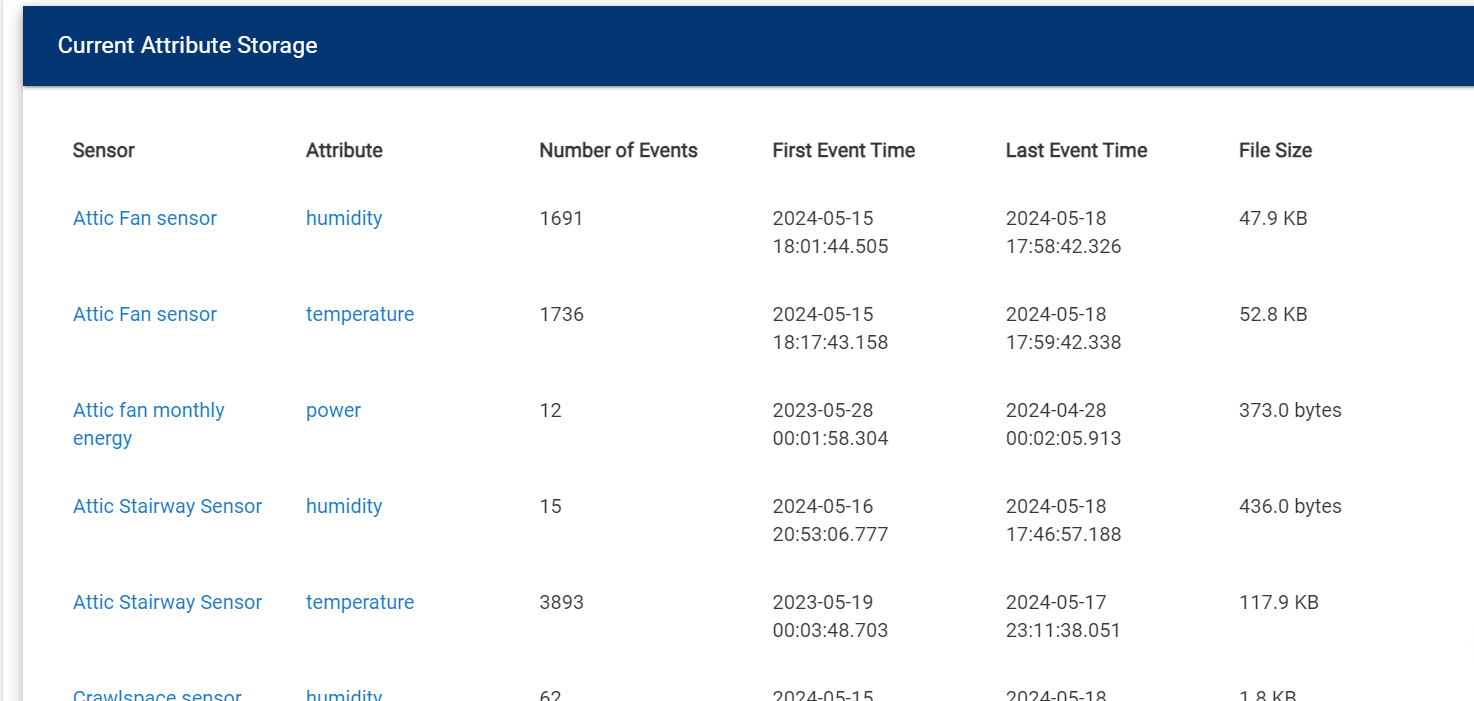
Yea the data was not saving for sure.
I went through the configure screen again. I didn’t change a single thing, just hit next a couple times and done.
It looks to be saving properly now. And the graph populates. Very strange!
I have also strange issue with graphs. Webcore timegraph shows only portion of days measurements, like
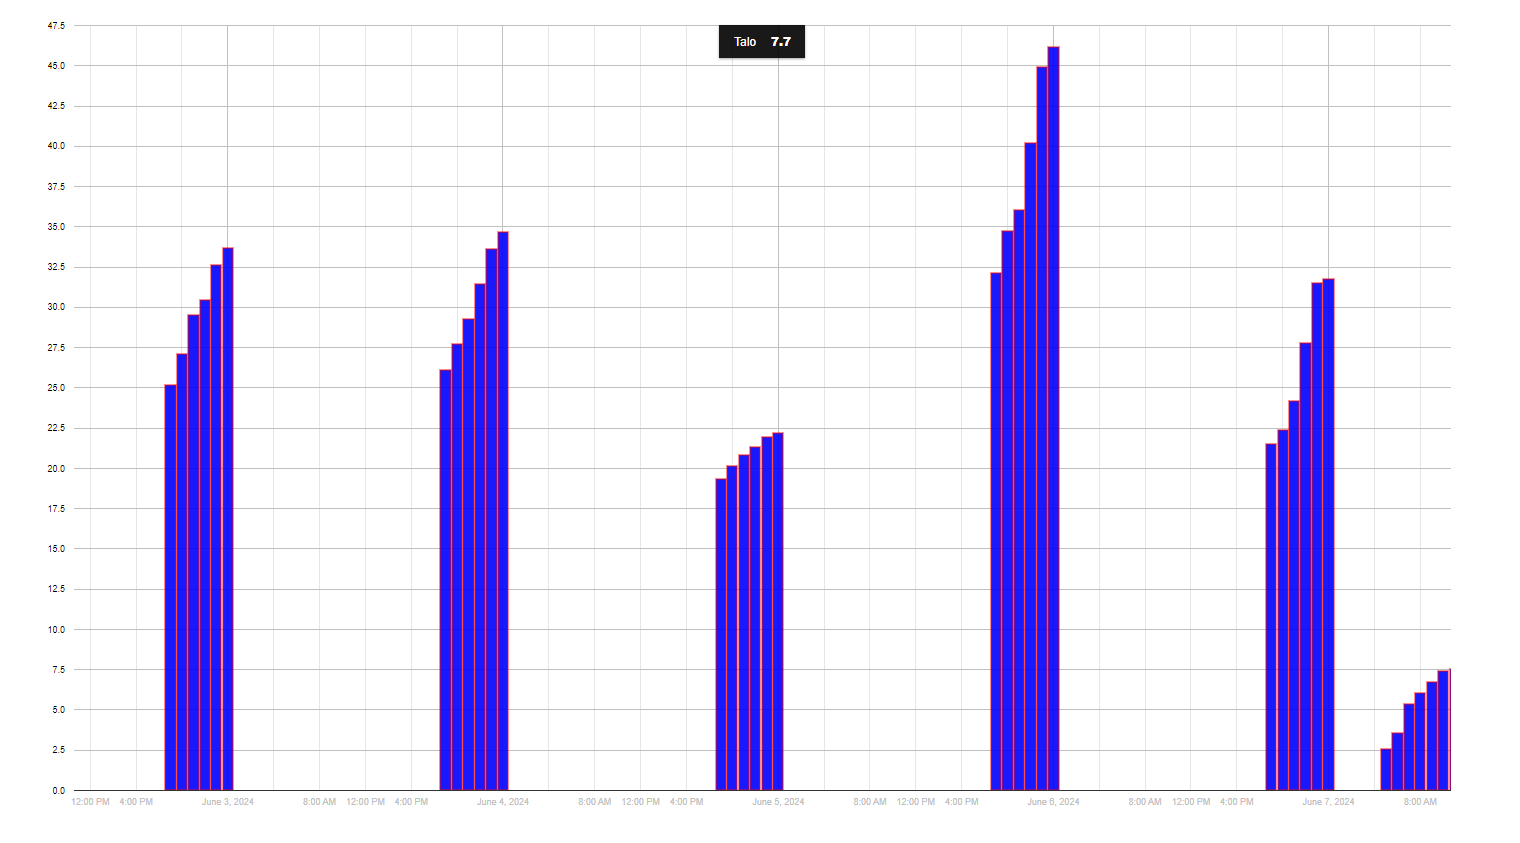
It cuts out values before 7 am every day. LTS is in use and having data:
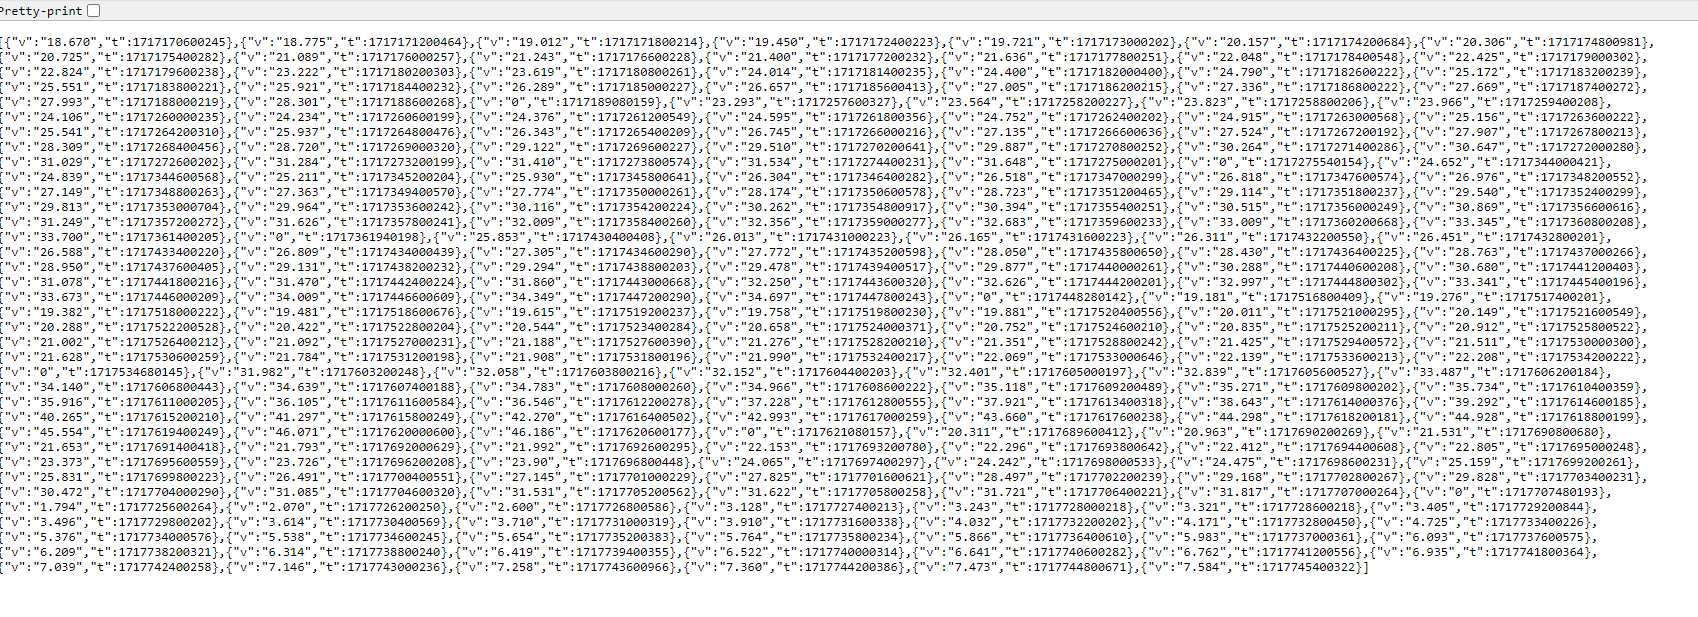
Also device itself have there energy values stored longer than one day.
And as you can see from graph, today it have cutted out values before 5 am but at the end of the day cut out will be 7 am. Why it is not drawing bars for whole day, any ideas?
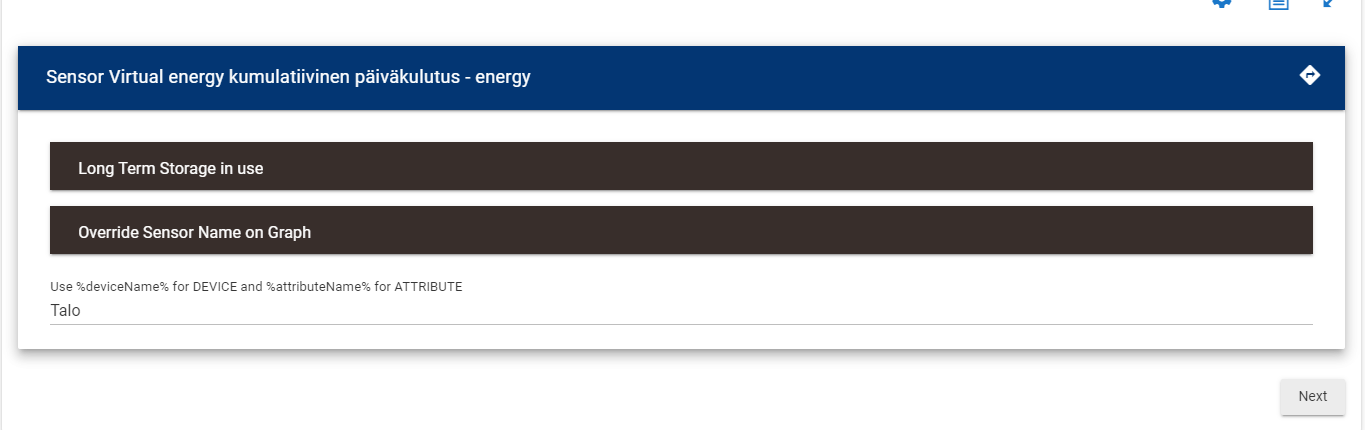
EDIT: While I was inspecting LTS data more carefully I noticed that data from morning hours is actually missing from LTS also, any ideas why is that?
You can look at your events from the device itself (that LTS is collecting).
My first impression is LTS has what the device sends, but the device events should answer that.
What is the device you’re monitoring? I wonder if it only sends changes over a certain amount? I know my fibaro dimmers have parameters to specify sending periodic power & usage data, and also the percentage power change to trigger sending a value.
Its virtual device. Its logging daily energy consumtion on hourly basis and I can see all of those events in device event log.
But yesterday I tweaked LTS settings a bit and now, at least it looks, to collect data correctly. Setting I tweaked was "time to start storing data", I changed those so that all are not starting at the same time, but having one minute gap between each.
I need to monitor situation for couple of days how it looks.