[RELEASE] Hub-a-Dashery app

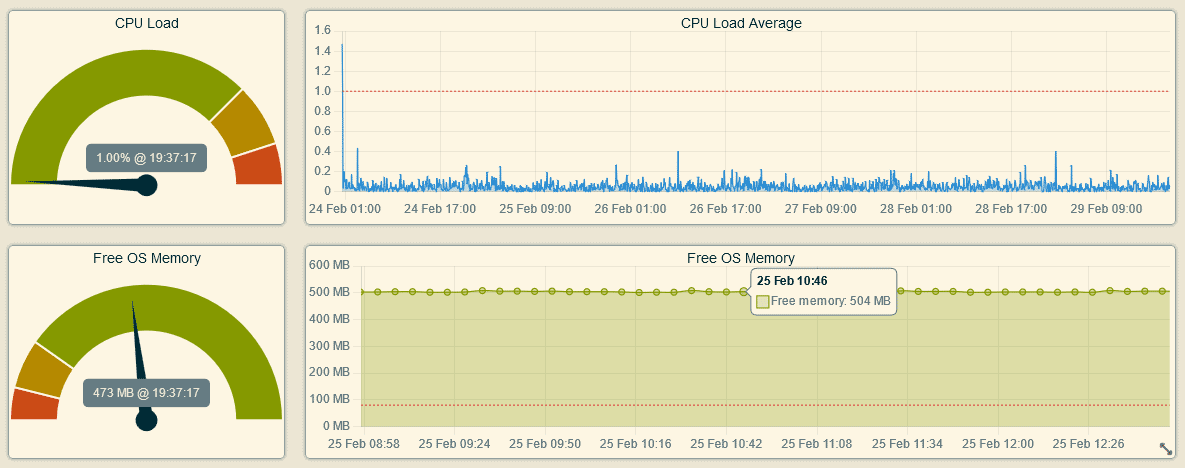
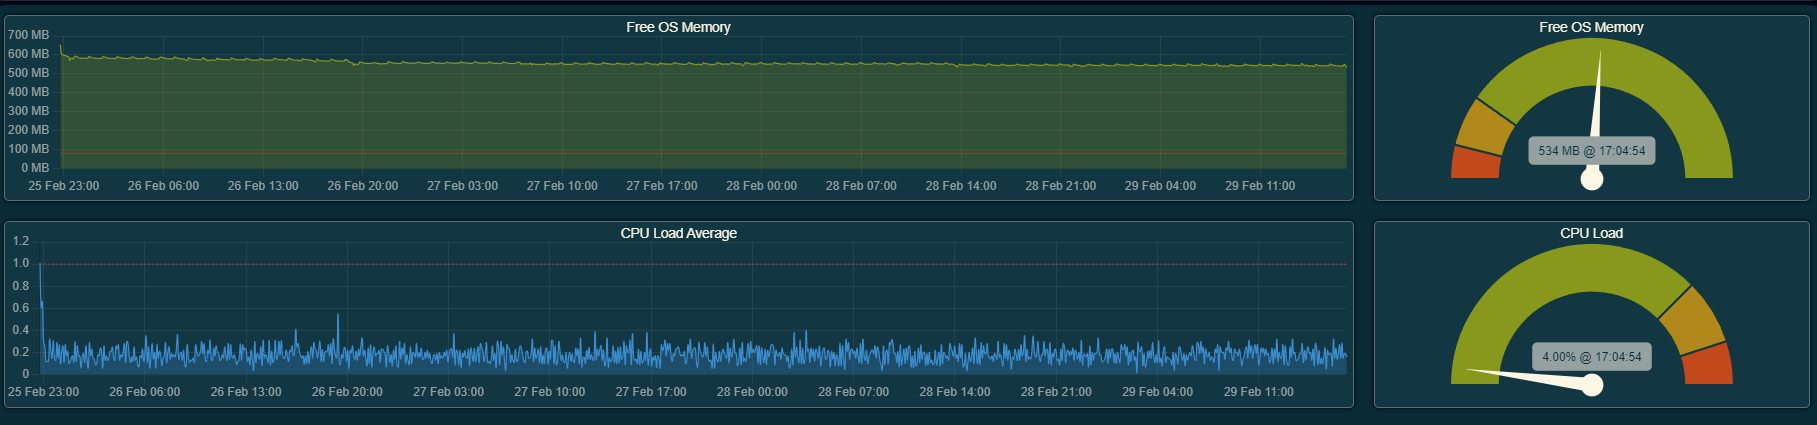
This app renders a dashboard that shows the free memory (RAM) and the processor load average of the Hub over time. You can access the data source at http://hubitat.local/hub/advanced/freeOSMemoryHistory.

Note: The data is reset after each Hub reboot and is not available for the first 15 minutes.

Dashboard features

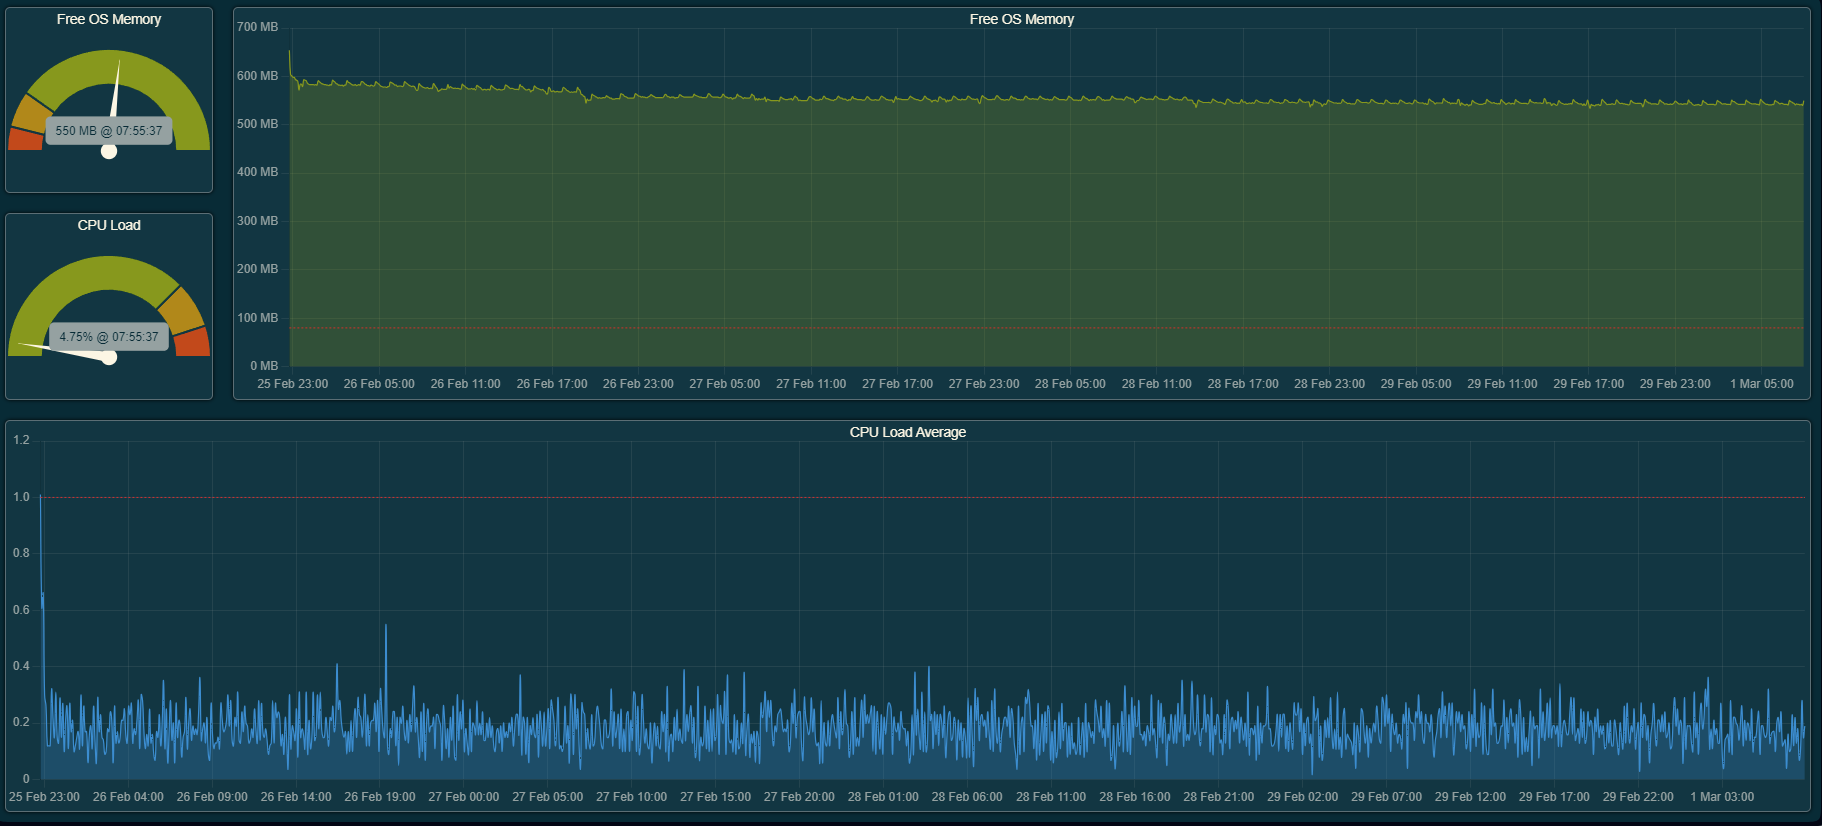
  • The dashboard adapts to the window size and orientation.
  • You can zoom in and out with the mouse wheel or the pinch gesture on mobile devices.
  • You can drag the graphs left or right to see different time periods.
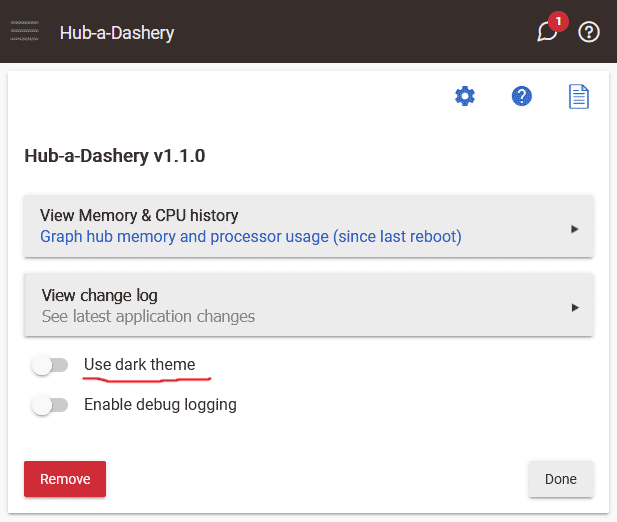
  • You can switch between light and dark modes from the app settings.

Installation

Install using Hubitat Package Manager (HPM)

To install the Hub-a-Dashery app using the Hubitat Package Manager (and receive automatic updates), follow these steps:

  1. Go to the Apps menu in the Hubitat interface.
  2. Select Hubitat Package Manager from the list of apps.
  3. Click Install and then Search by Keywords.
  4. Type Hub-a-Dashery in the search box and click Next.
  5. Choose Hub-a-Dashery by Dan Danache and click Next.
  6. Read the license agreement and click Next.
  7. Wait for the installation to complete and click Next.
  8. Go back to the Apps menu in the Hubitat interface.
  9. Click the Add user app button in the top right corner.
  10. Select Hub-a-Dashery from the list of apps.

Usage

To use the Hub-a-Dashery app, follow these steps:

  1. Go to the Apps menu in the Hubitat interface.
  2. Select Hub-a-Dashery from the list of apps.

Links

Have fun!

26 Likes

@dandanache, amazing stuff, another great app!
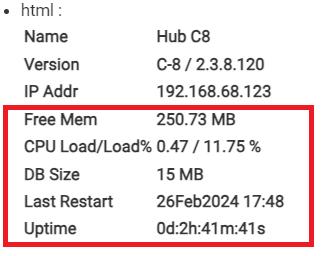
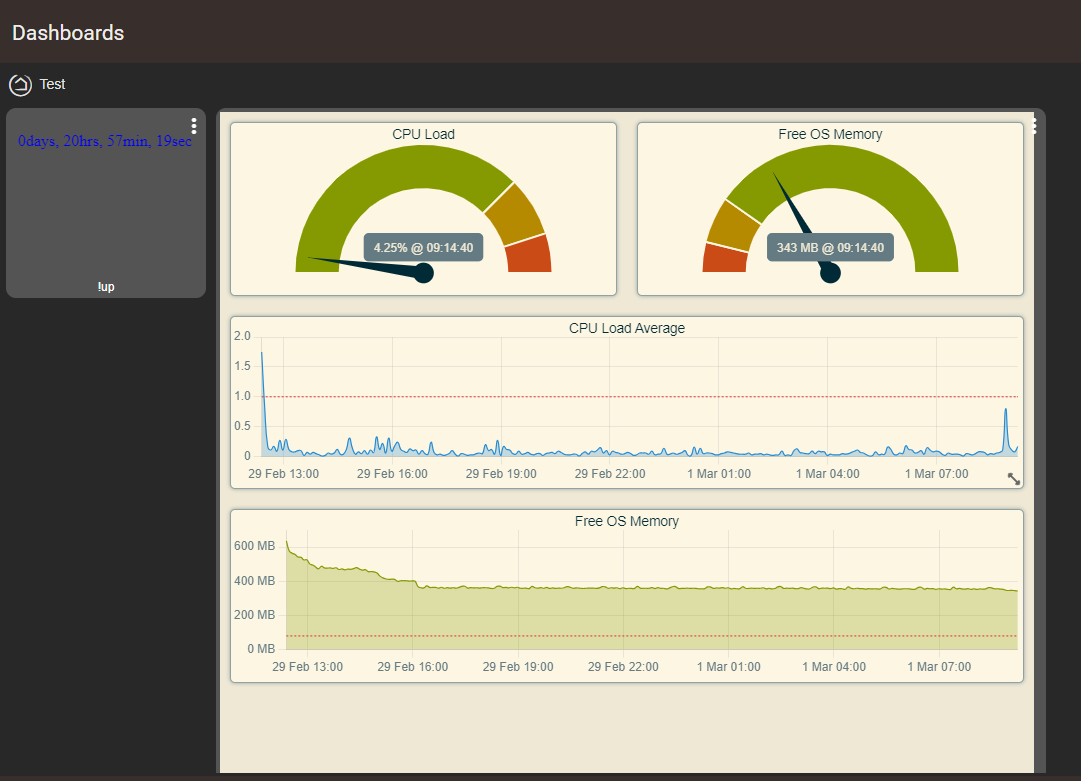
Is it possible to have a small text box showing the current data below from Hub Info, for example?
I want to be able to tell the uptime, free memory etc. at a quick glance as well, thanks.
image

3 Likes

Very Nice Thanks dandanache !
You Rock :slight_smile:

2 Likes

This is going to reduce a lot of the Hubitat graph FOMO caused by the "Grafana Geeks." :wink:

1 Like

Just a note .. this happened during install ..
It does not seem to matter as it works fine :slight_smile:

1 Like

Who else had to hack the app because their hub has been up since last year ?

:sunglasses:

3 Likes

LOL You Freaking Bragger !
I do not know how you guys keep yours up that long !
I can barely keep it up for a week ! ( Shakes Head )
What's the darn Secret to your success ???

2 Likes

Not being on beta.

2 Likes

@hubitrep is a big fat liar!!

Not really, but I haven't been able to say that since 5th Grade, and it just seemed like it was time. :wink:

2 Likes

I am not on beta .. have a super simple system with 22 devices lol
( I have to cry myself to sleep every night, thinking I suck at Hubitat Ecosystem. )

1 Like

Released version 1.1.0 with the following changes:

Add

  • Add grid system to move charts around
  • Add Free Mem and CPU Load Avg gauge charts (refresh every 1 minute)
  • Reset graph zoom on double-click

Changed

  • Enable data decimation to reduce number of rendered points

Fixed

  • Remove call to non-existing method fetchHelper() during install - @WarlockWeary
  • Fix year reset bug for history charts - @hubitrep

Have fun!

7 Likes

Is there an option to make this available for dashboards?

Unfortunately no, not that I know of.

Such a great update.

You're demonstrating very convincingly (and usefully) how one can build (almost) arbitrary UIs on top of a reasonably open platform.

5 Likes

Nice work as always ..

Mine looks different then the one you show ..
No Options for Light dark ? and No Little top Bubbles/circles on the memory chart
Also My charts always had the meters on the right
Do not see away to save the charts the way you want ?
LOL Anyway Very Cools as always !

1 Like

Click on the Title to move it, click on the lower right to resize. You might be able to get it the way you want, then save the entire url and use that to save the settings. I haven't tried it, so not sure.

1 Like

This option is available in the Hubitat app, when you start the HTML app:

Bubbles don't like to touch each-other :slight_smile:, so they only appear when you zoom enough so that the the chart shows fewer/individual data points.

See what James said to move around the charts.

You are right, I must update the docs. You can use CTRL+S key combination to save the grid layout to the Hub (in the app state).

8 Likes

Very Nice :slight_smile:
CTRL+S key combination to save the grid layout
Kinda Miss the vertical "pointer " / Line for the mouse on the chart.
Anyway get it back ? < Dam People are Needy ! Thanks !

1 Like

You can with a little work if you have an iFrame Tile device - there are several around but if you need one https://raw.githubusercontent.com/thebearmay/hubitat/main/tileIframe.groovy.

Once you create your iFrame Tile device, open the app and click on option to show the memory, etc. and then copy the URL at the top. Go to your iFrame Tile device and paste that URL in as the source. You should then be able to add the device to the dashboard and adjust the sizing.

8 Likes

Made in Romania :heart:

3 Likes