Awesome!
Although does not look very good as it is right now, I think I can fiddle with the CSS to make it nicer when embedded like this. Anyway, nice reply!
Awesome!
Although does not look very good as it is right now, I think I can fiddle with the CSS to make it nicer when embedded like this. Anyway, nice reply!
Released version 1.2.0 with the following changes:

Have fun!
Did you take away the option to save the layout using CTL+S?
Hope I am not to greedy here but I think your app has the potential to be a Must-Have app to all users.
See, my current setup is based on three hubs and I am curretly using the Quick Chart app to gather and present data from all three hubs on one of my dashboards. I know other users are using Grafana to do the same thing.
This is (part of) my current dash:
Using your app together with @thebearmay idea to use Iframe tiles I created this draft dash representing data from al 3 hubs.
Being greedy now is asking whether you could allow for data from more than one hub be presented on the same graph?
Also, would it be posssible to choose what data to present (say using @thebearmay Hub information driver) to collect the data and then sotre it and present sone of it using your app?
In any case, I am very happy even with the current app.
Thanks,
Amit
Thank you for reporting this! Fixed in 1.2.1.
Thanks dandanache You rock !
This is just getting better and better every time.!
C8-PRO has too much free RAM ![]() Assuming total RAM is larger on the C8 PRO and the graph max needs to match it.
Assuming total RAM is larger on the C8 PRO and the graph max needs to match it.
Busted! I hardcoded 1GB and 4 CPU cores in the charts. Have to lookup the specs for the Pro.
2GB still 4 chores
@dandanache,
Amazing work.... I am not too worried now if the Grafana server dies ![]()
Found this to work with thebearmay hack ..
I looked at : Grafana graphs < had no clue how to setup !
dandanache < way Easier ! LOL
16GB? do you mean 2GB?
Actually yes mind and fingers not in sync
I tried this several times before I realized that I needed to click Ctrl-S before copying the url. However, I am unable to get anything that looks right. How do you have your dashboard set up?
Released version 1.3.0 with the following changes:
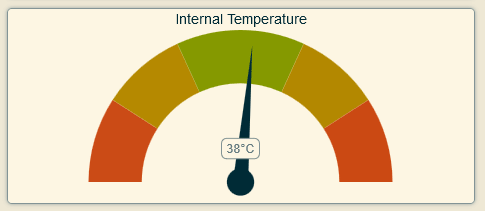
@amithalp@ady624New internal temp chart:

To hide specific charts from rendering, you have to manually add the hide parameter in the URL. This parameter contains a list of comma-separated (no spaces) chart IDs that you don't want to see in the dashboard.
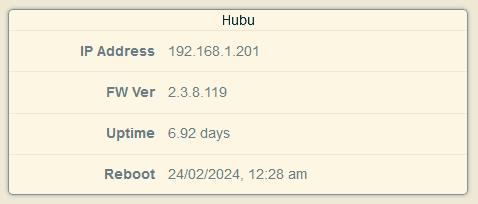
The list of IDs for current charts: mem-history, cpu-history, mem-last, cpu-last, hub-info, int-temp
Example (memory history line chart and CPU gauge chart are not rendered in the image below):
Have fun!
Very Nice as always ! Mr. dandanache
Thanks for your hard work !
Looks great! Wonder about the color coding however - lower is good.