I just checked with another hub with InfluxDB Logger and I see the same blank screen for configuring the app. I wonder if this is due to one of the recent platform upgrades.
Same problem. Did some testing, rolled back the firmware on the hub. Problem starts with 2.3.2.126 works under 2.3.1.142. Reinstalled, repair nothing seems to fix it.
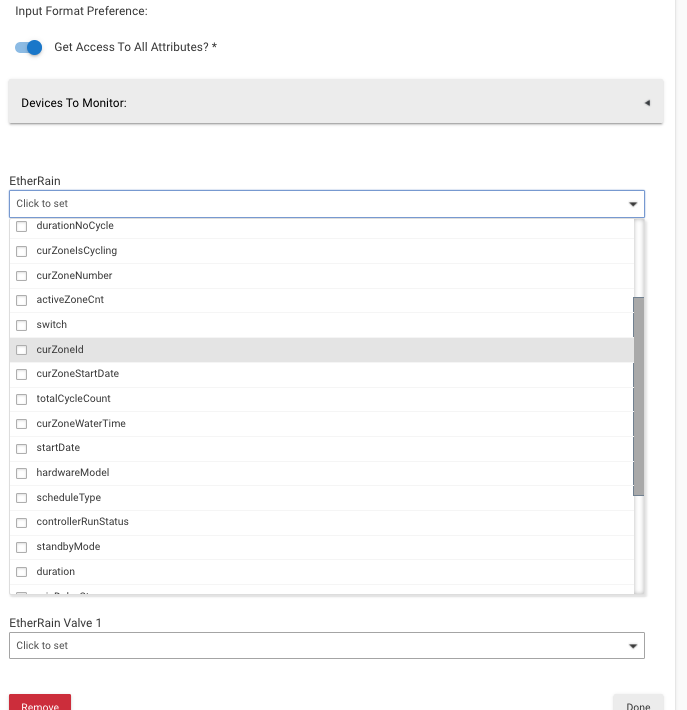
I have tried a few things to try to understand what is happening here. It looks llke a problem specific to the option to "Get access to all Attributes". Maybe @ogiewon would consider looking at.
If you don't need custom attributes to be handled just turn off that flag.
Since it is in the Hubitat Community Github repo, a PR would make sense. We need to see if someone can give you privs on that repo so you can make changes as you see fit. Perhaps @csteele can add you to the InfluxDB repo so you can make changes on you own?
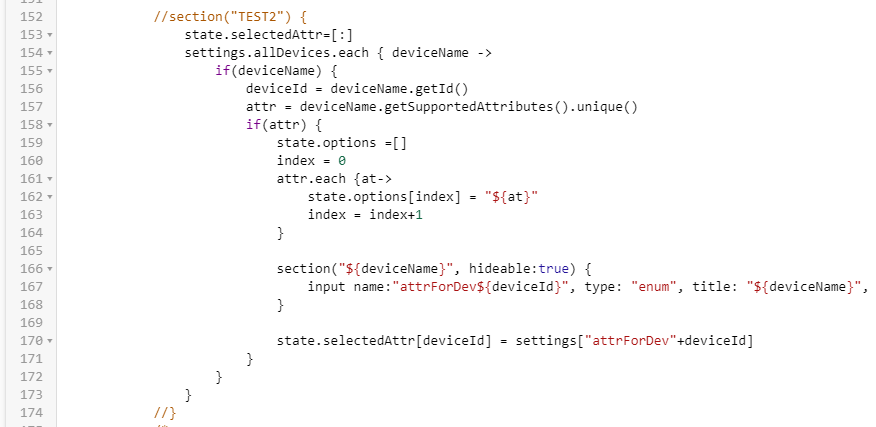
I did it first using the Line 166 method. That also works by commenting out that section, then putting it back. Second solution about Line 95 also worked. Thanks!
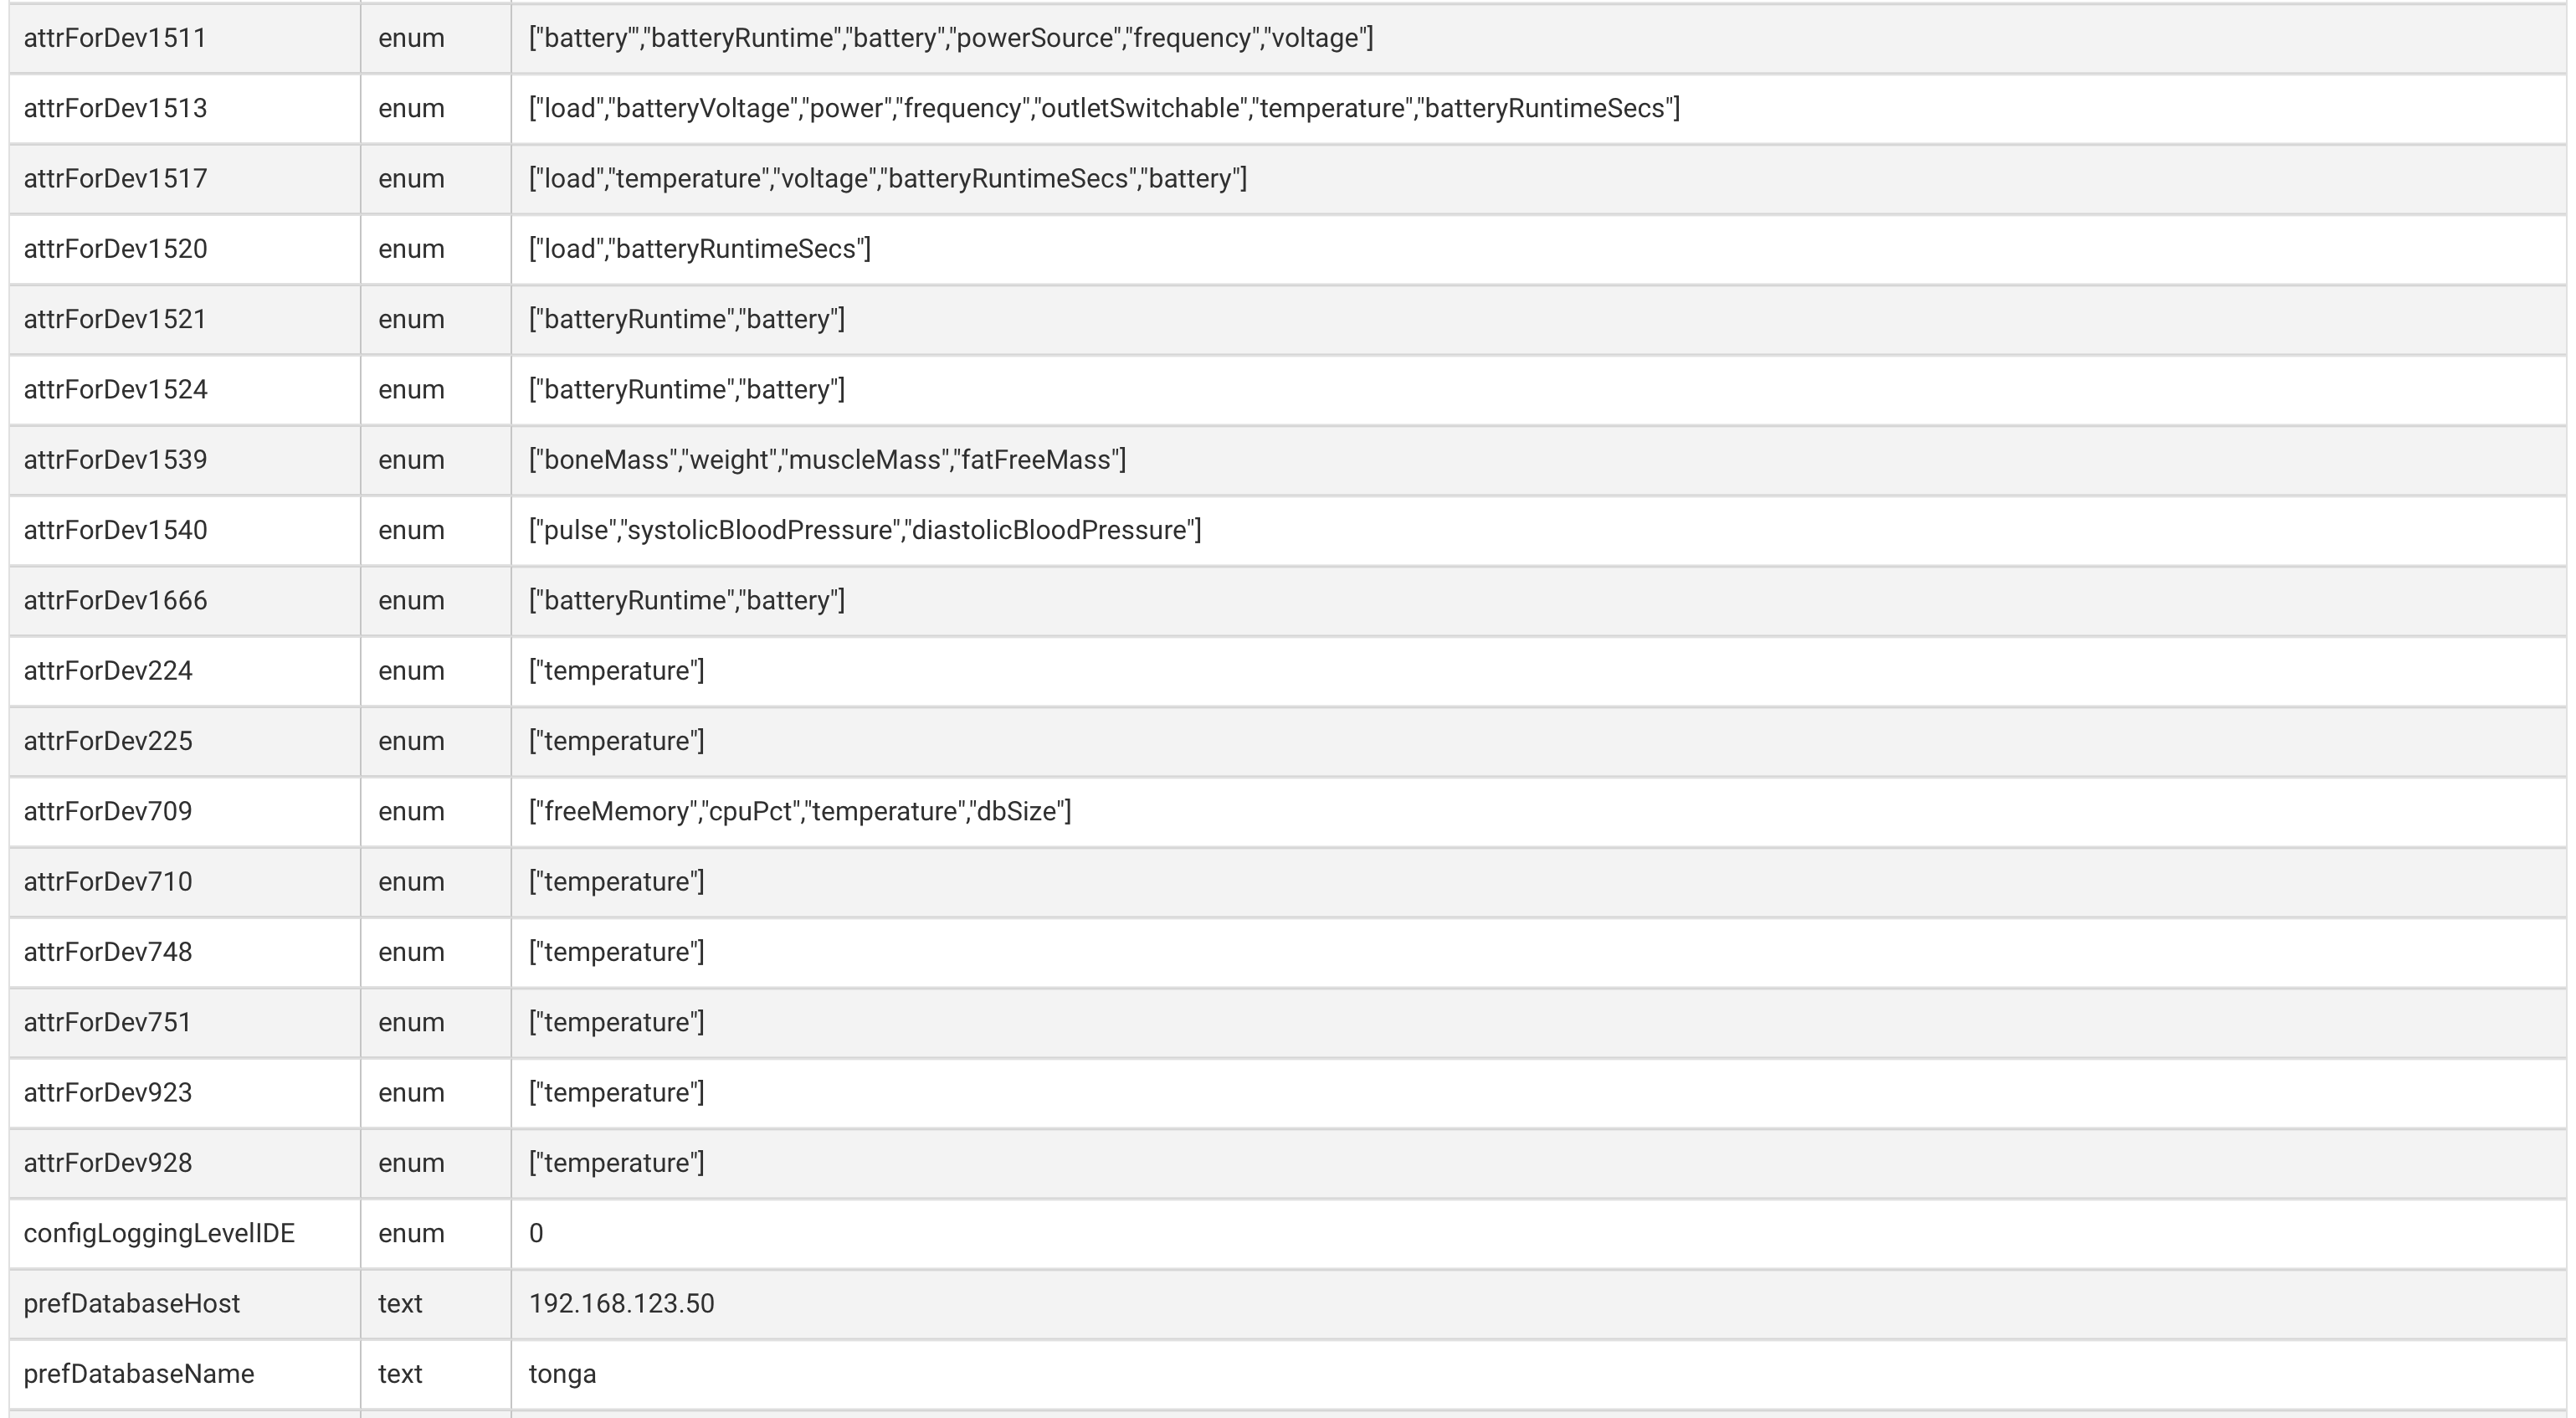
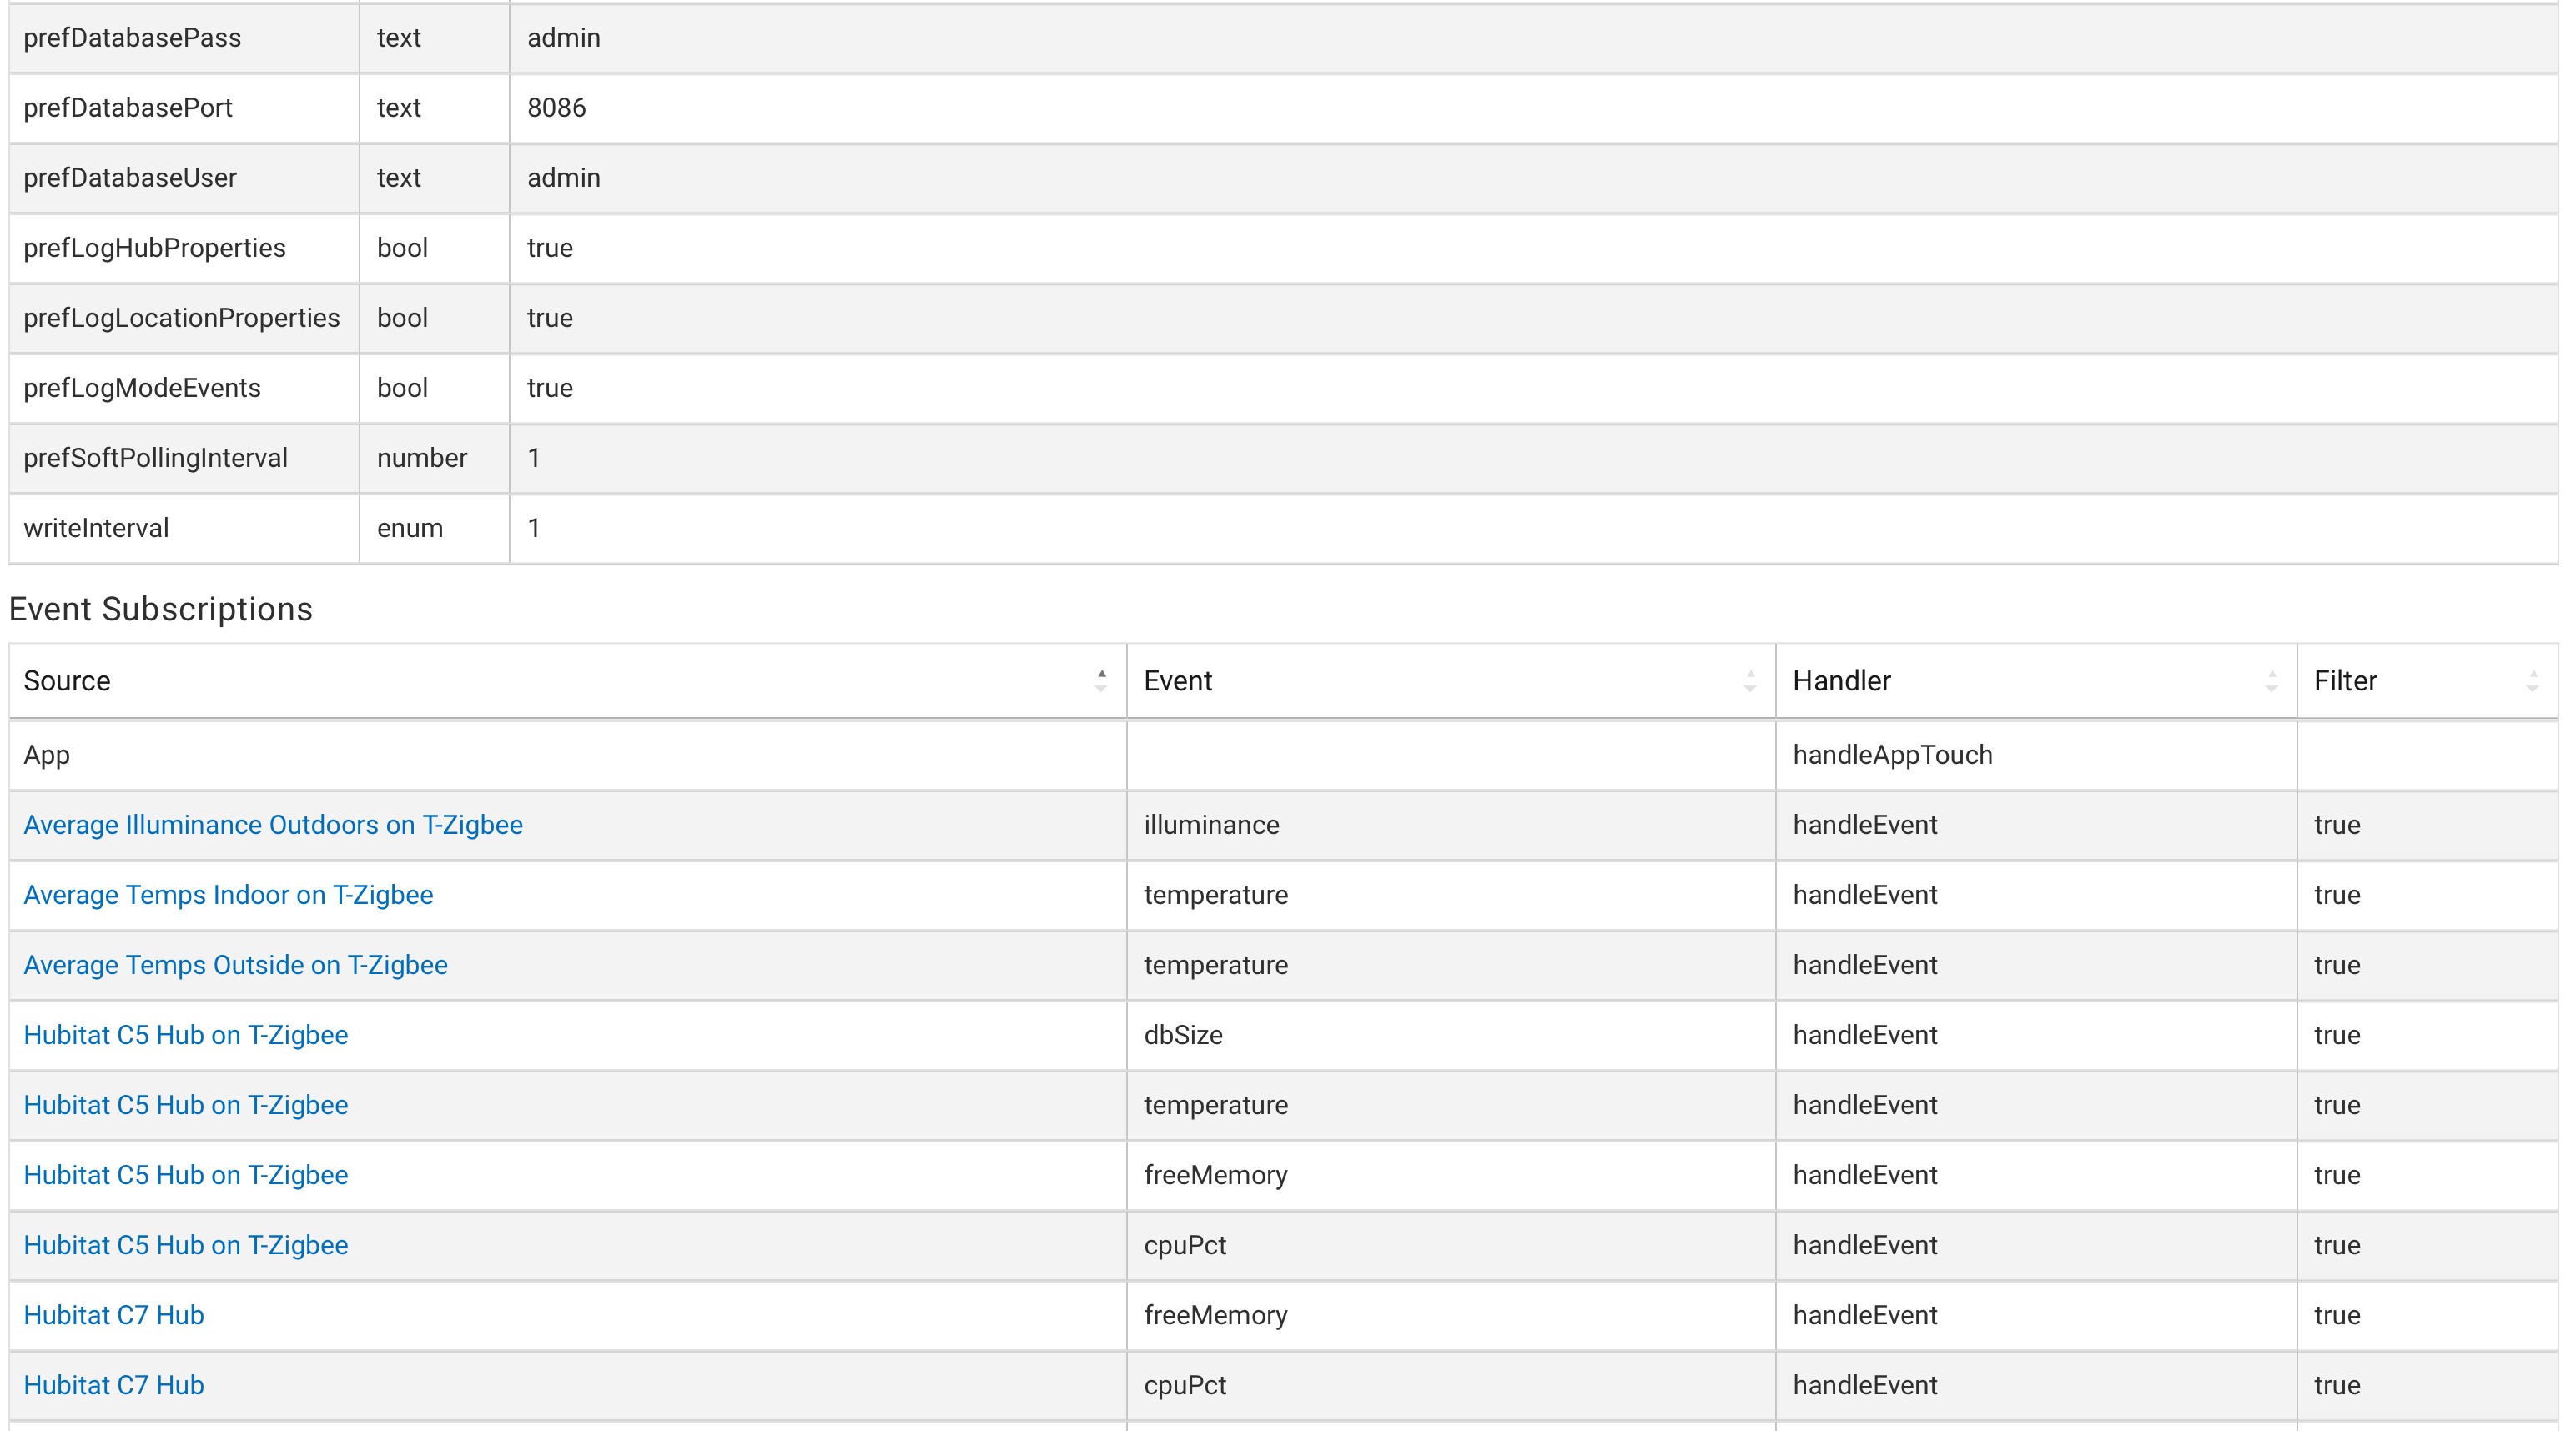
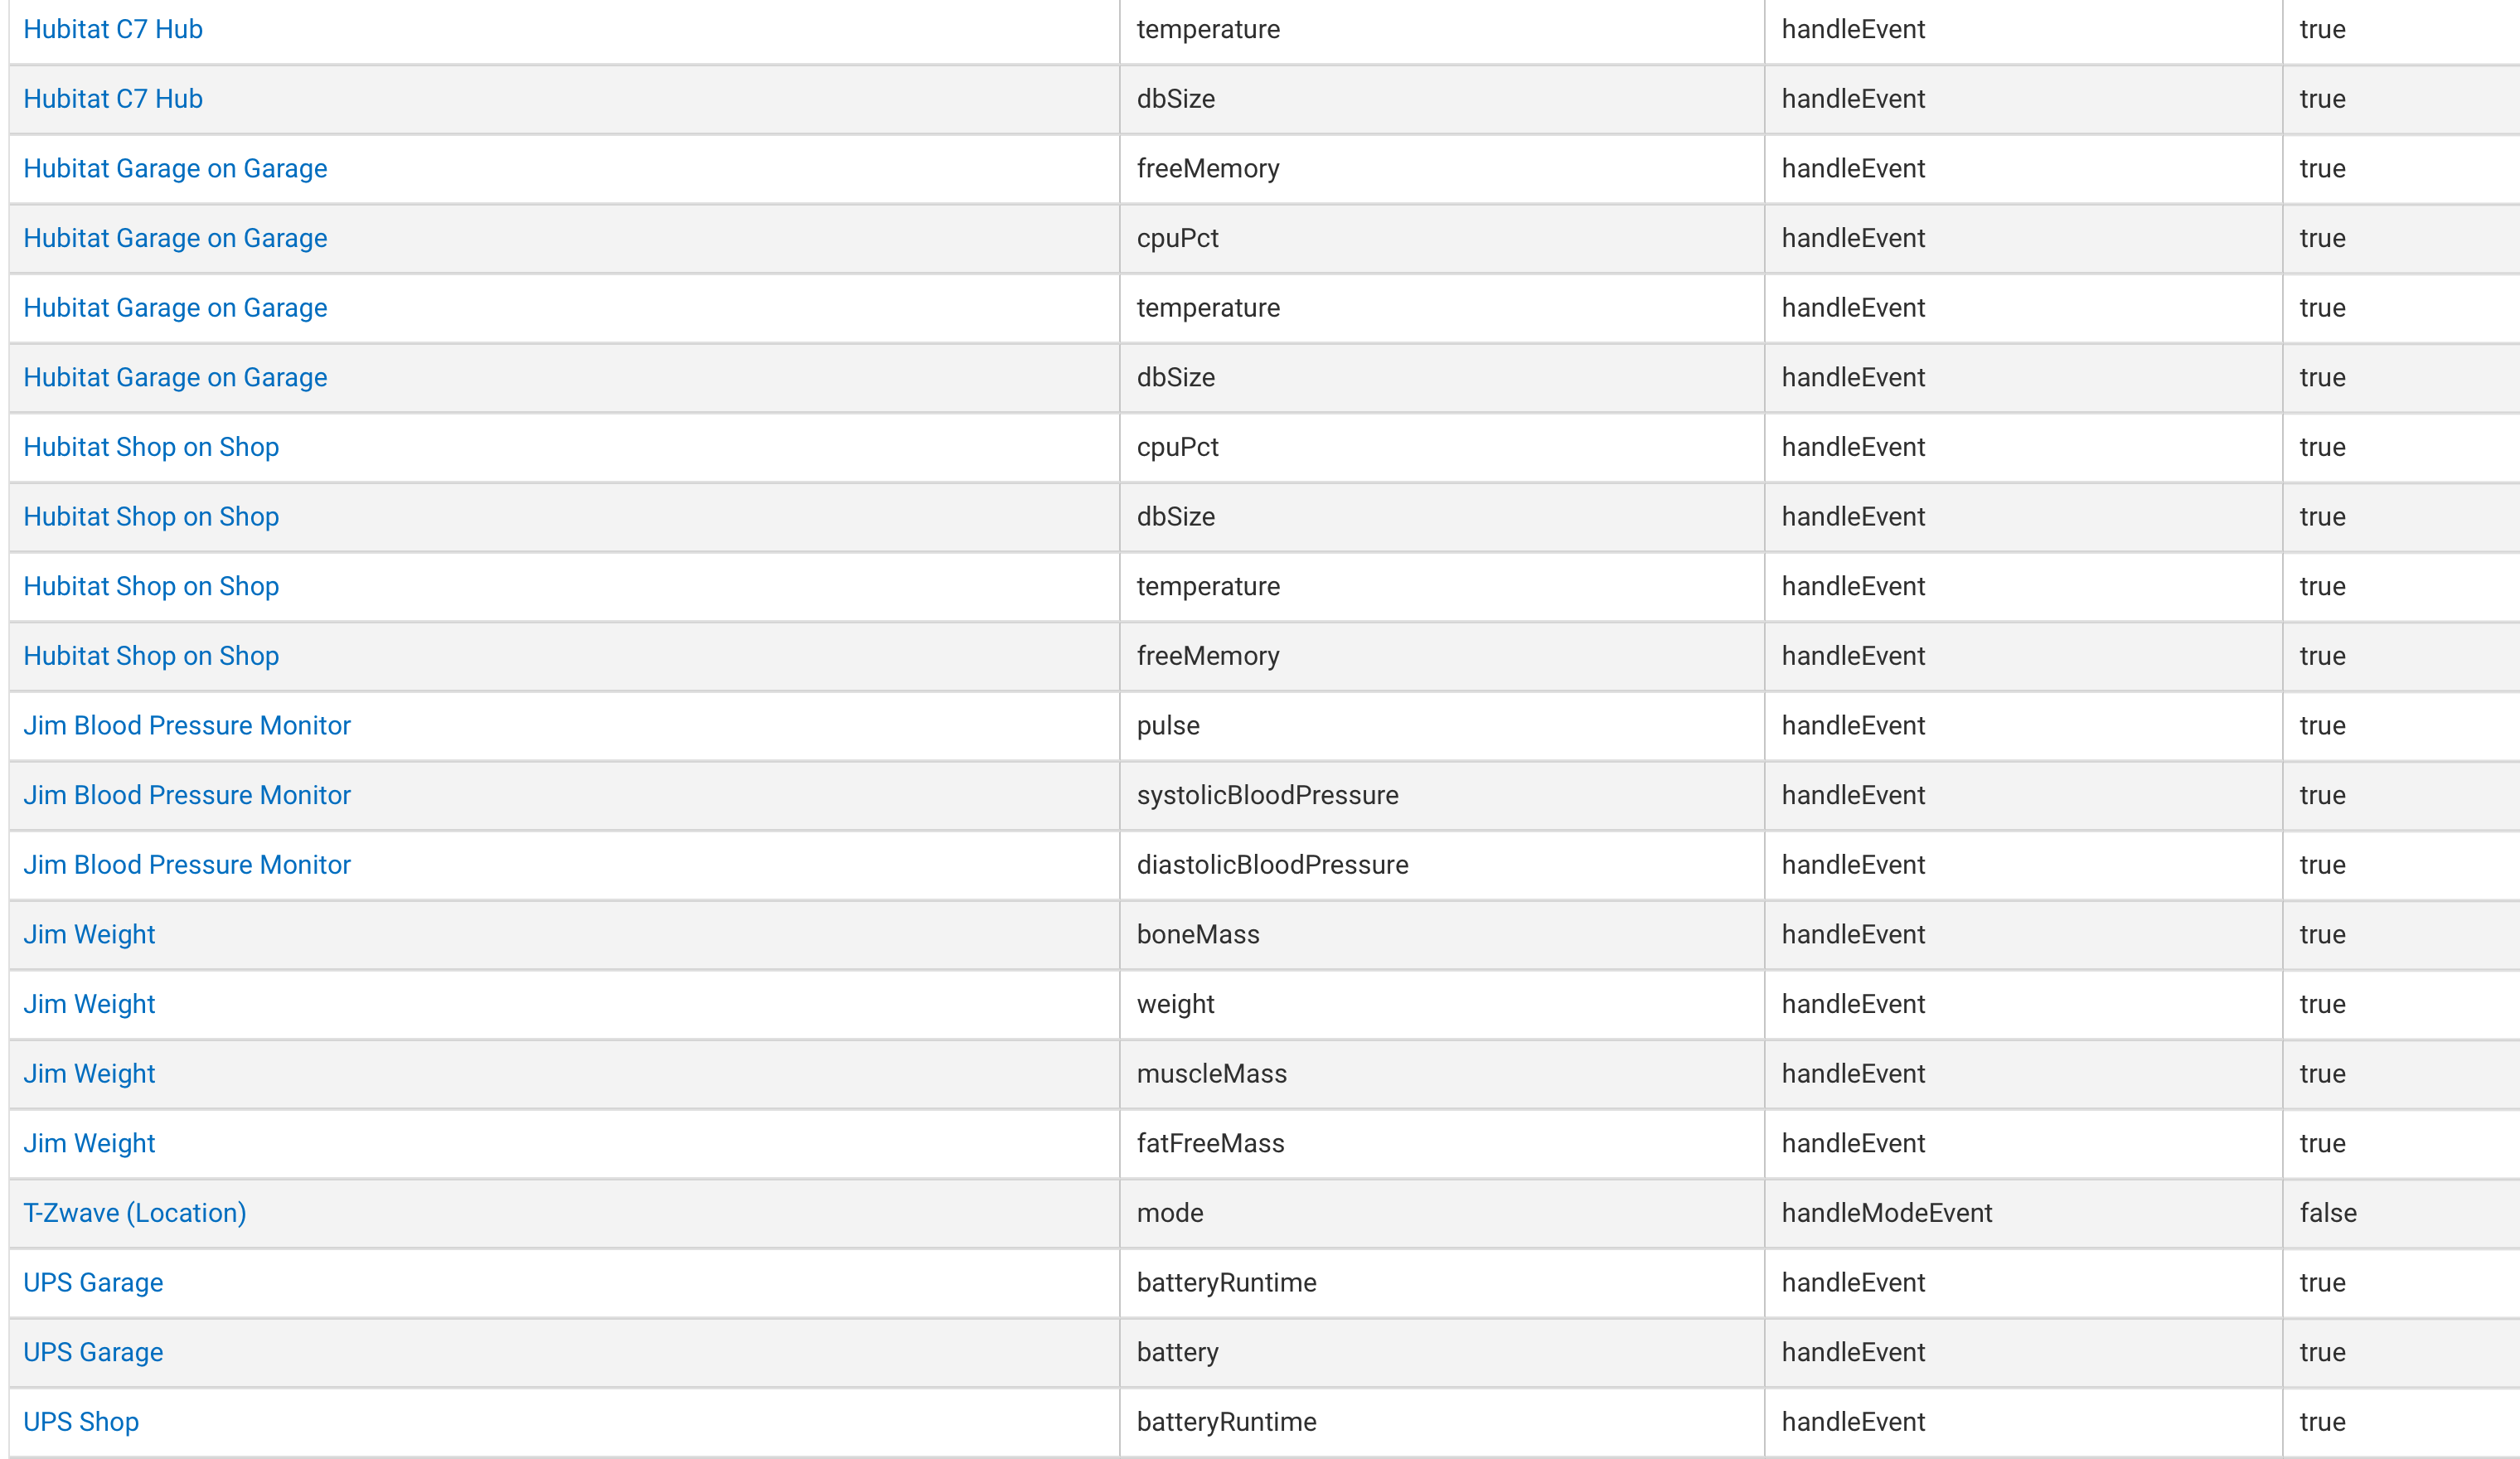
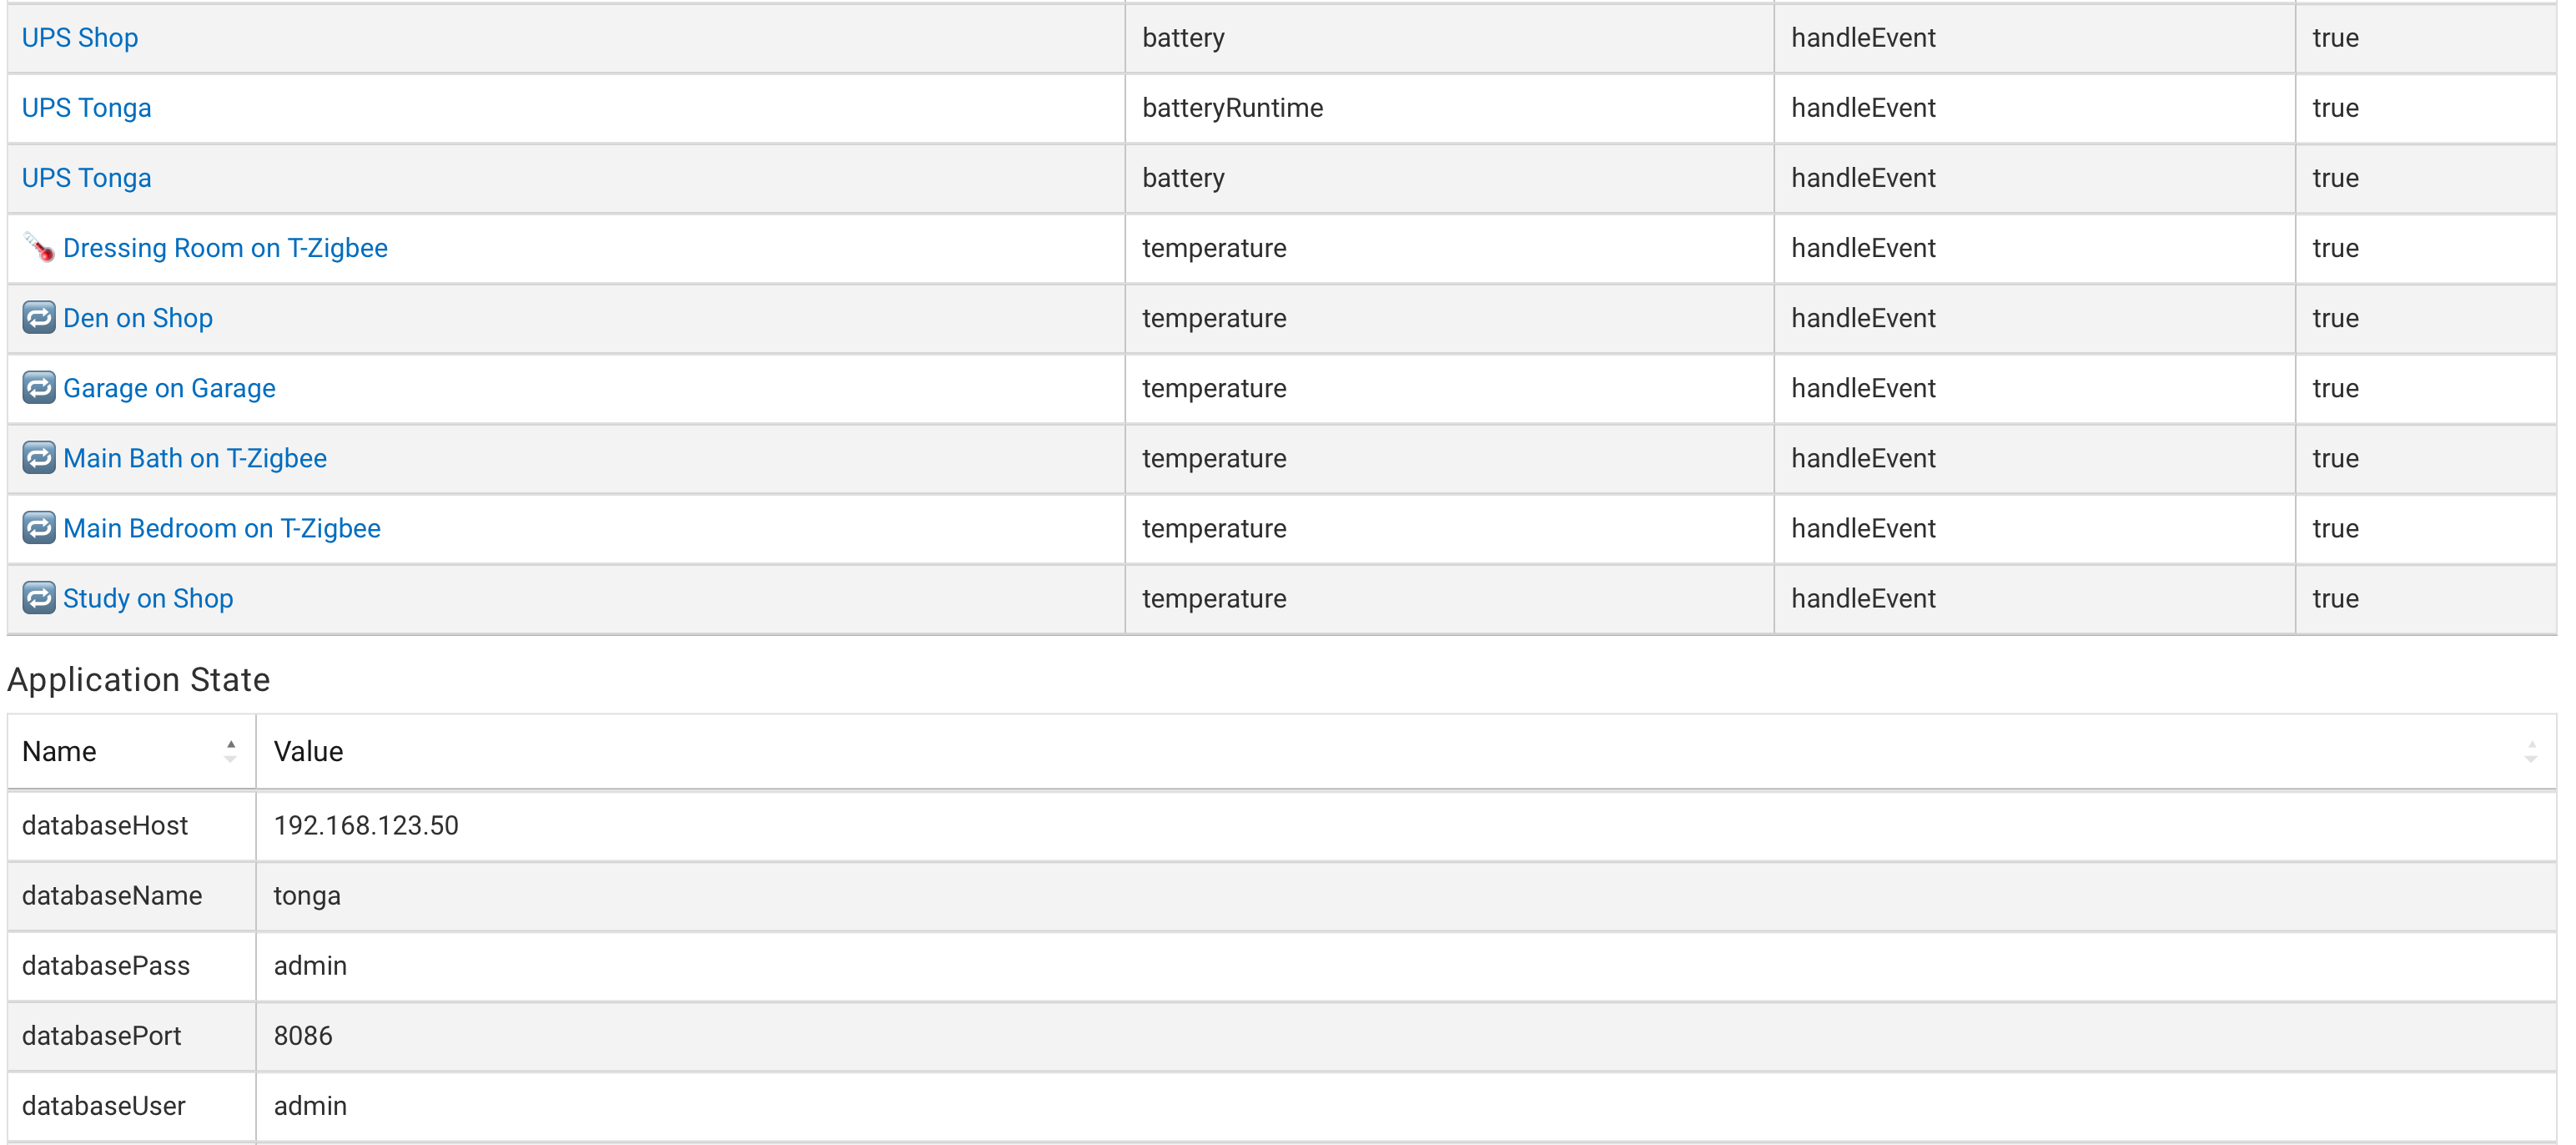
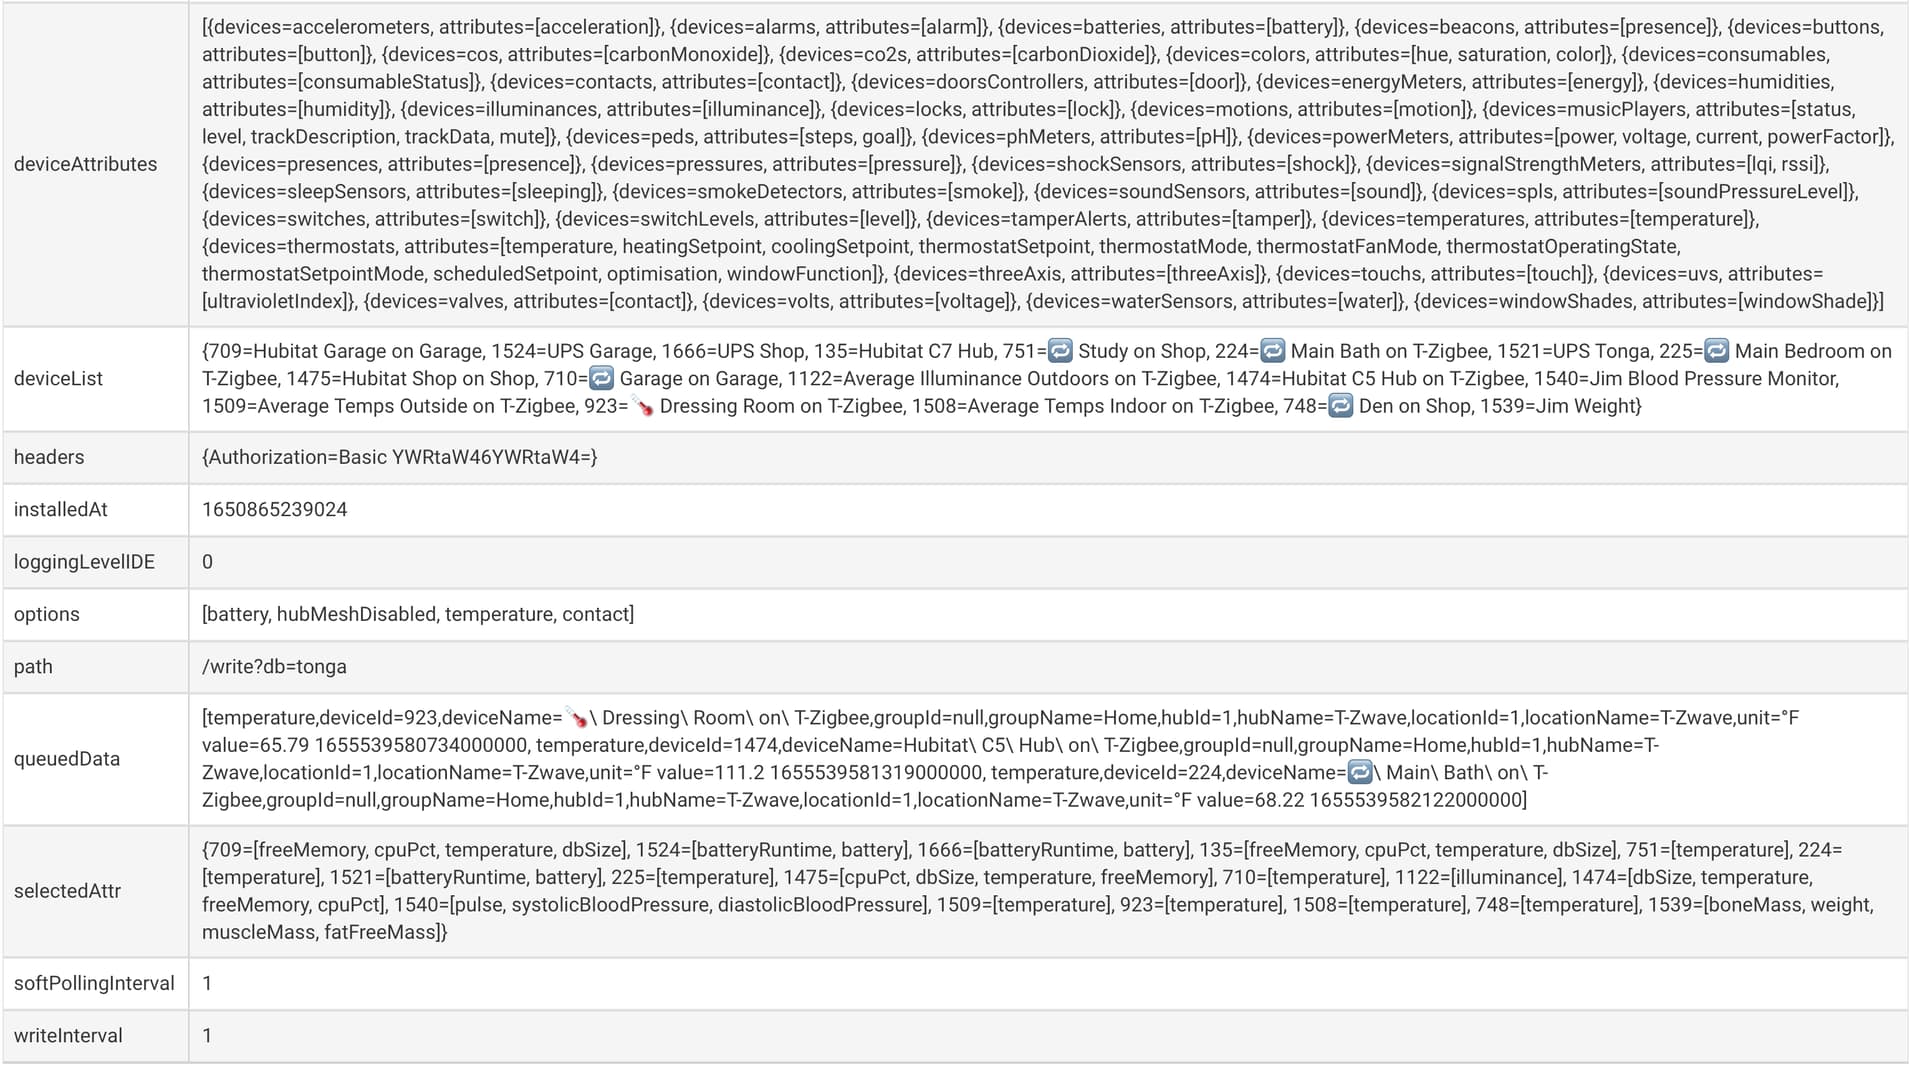
I spoke too soon. The devices are still selected in the Status Page for InfluxDB, but in the GUI, there are no devices showing selected. Also, I noticed that I am using Custom Attributes.
Is there another solution for getting information into Grafana without using Node Red?
I looks like it has issues with nested sections, if you comment out 152 and 172 then it works fine allowing the section on line 166 to work. Don't mind my other modifications in the screenshot, I was trying out various things to see what was going on.
Yes, two cases in different apps where a nested section is causing either just a white screen or an error on the page but no error in the logs. Once either the top level or nested section is removed the page will load.
Double checked it internally, nested sections are not supported and we have no plans to support them in the future. It will throw a meaningful exception starting with next hotfix.