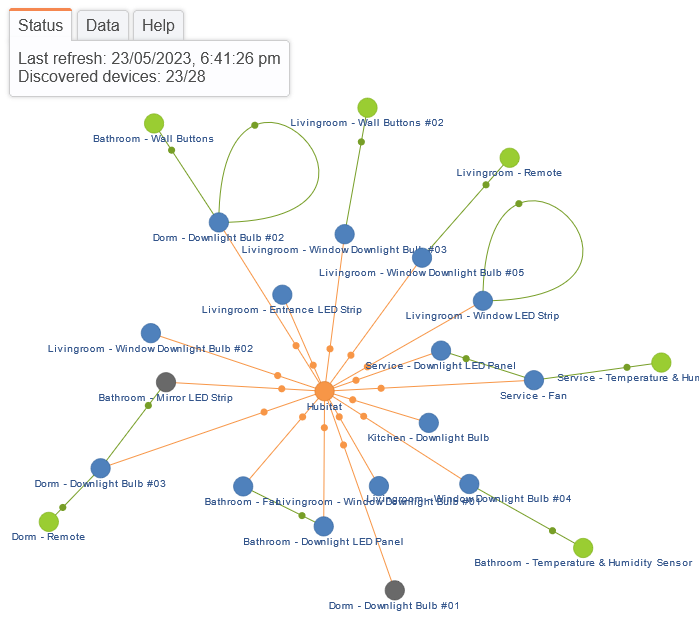
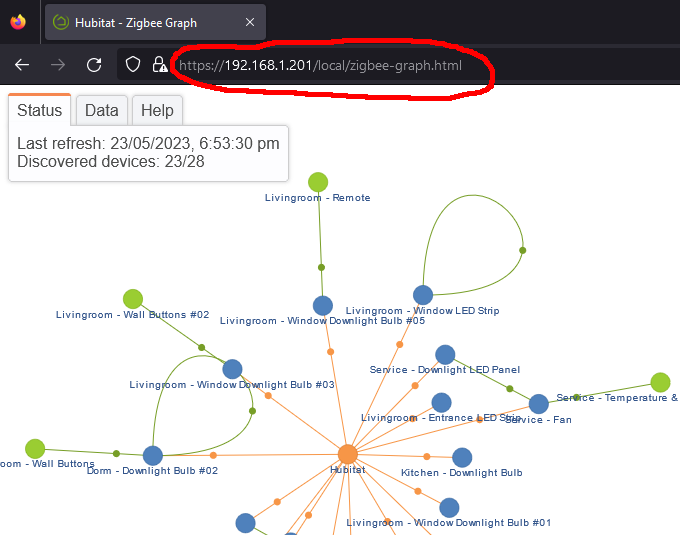
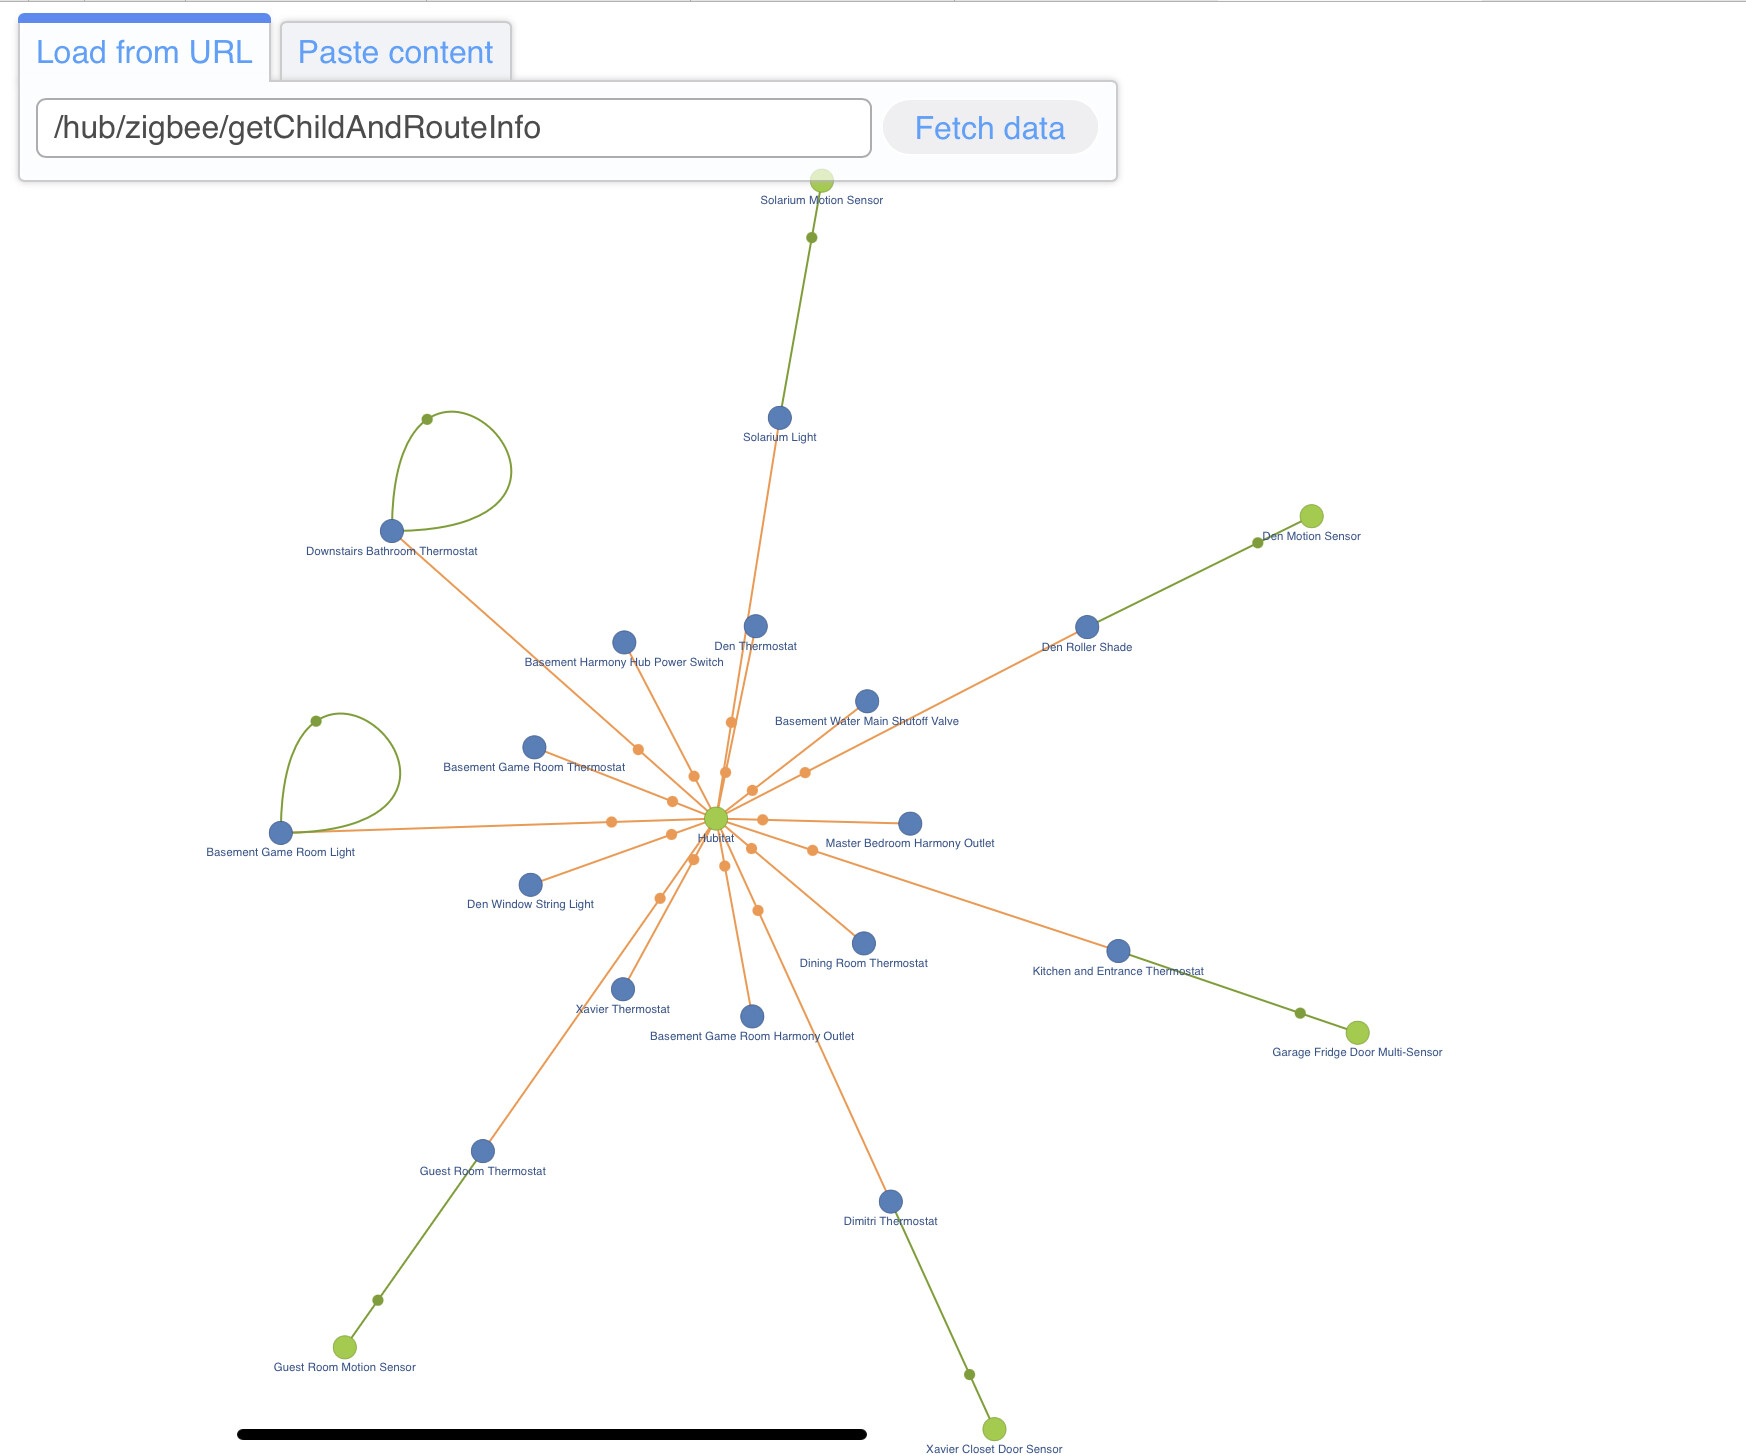
I had a little fun and played a bit with creating a visual rendering for the data we get from /hub/zigbee/getChildAndRouteInfo and I want to share the results with you good people.
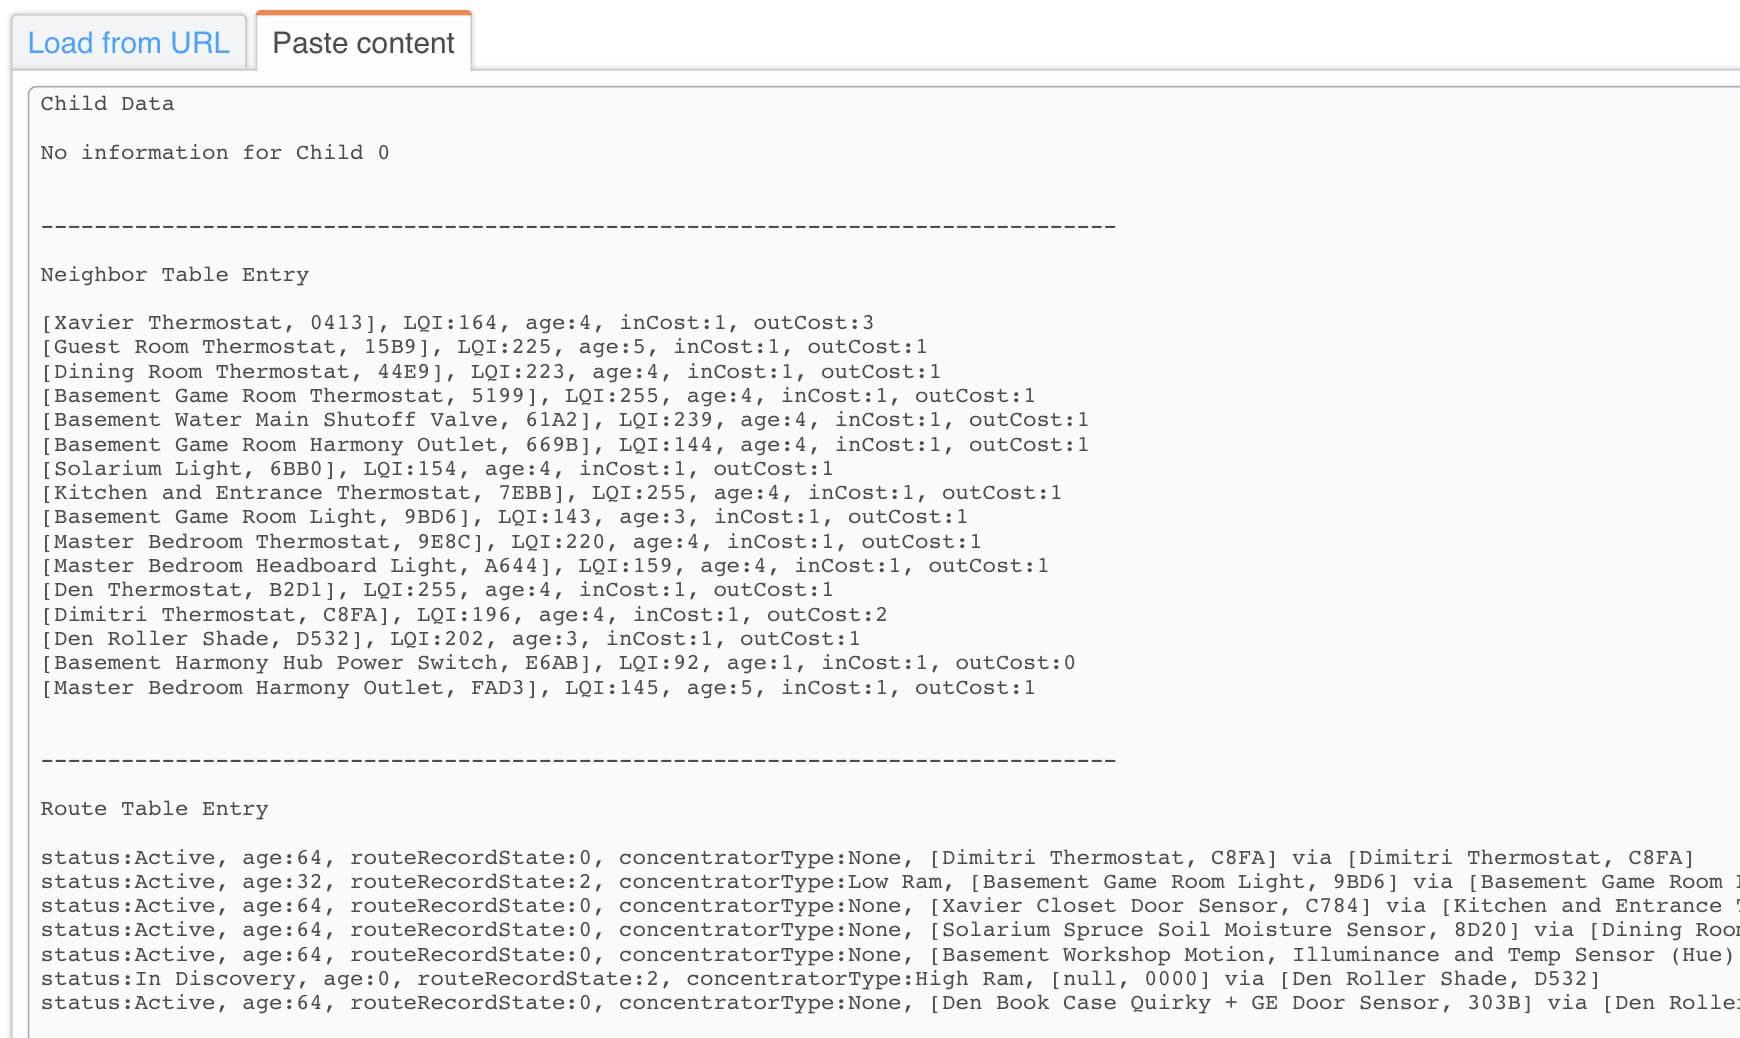
Since the text format is not properly documented anywhere, it might not work with your data without some tinkering here and there.
Install using Hubitat Package Manager (HPM)
Install the app via HPM (search for "zigbee-graph")
Go to "Apps", click "Add User App" then select "Zigbee Graph" from the user apps list
Click the "Done" button to create the app instance
Go to "Apps", select "Zigbee Graph" from the list, then click "Show zigbee graph"
Manual download
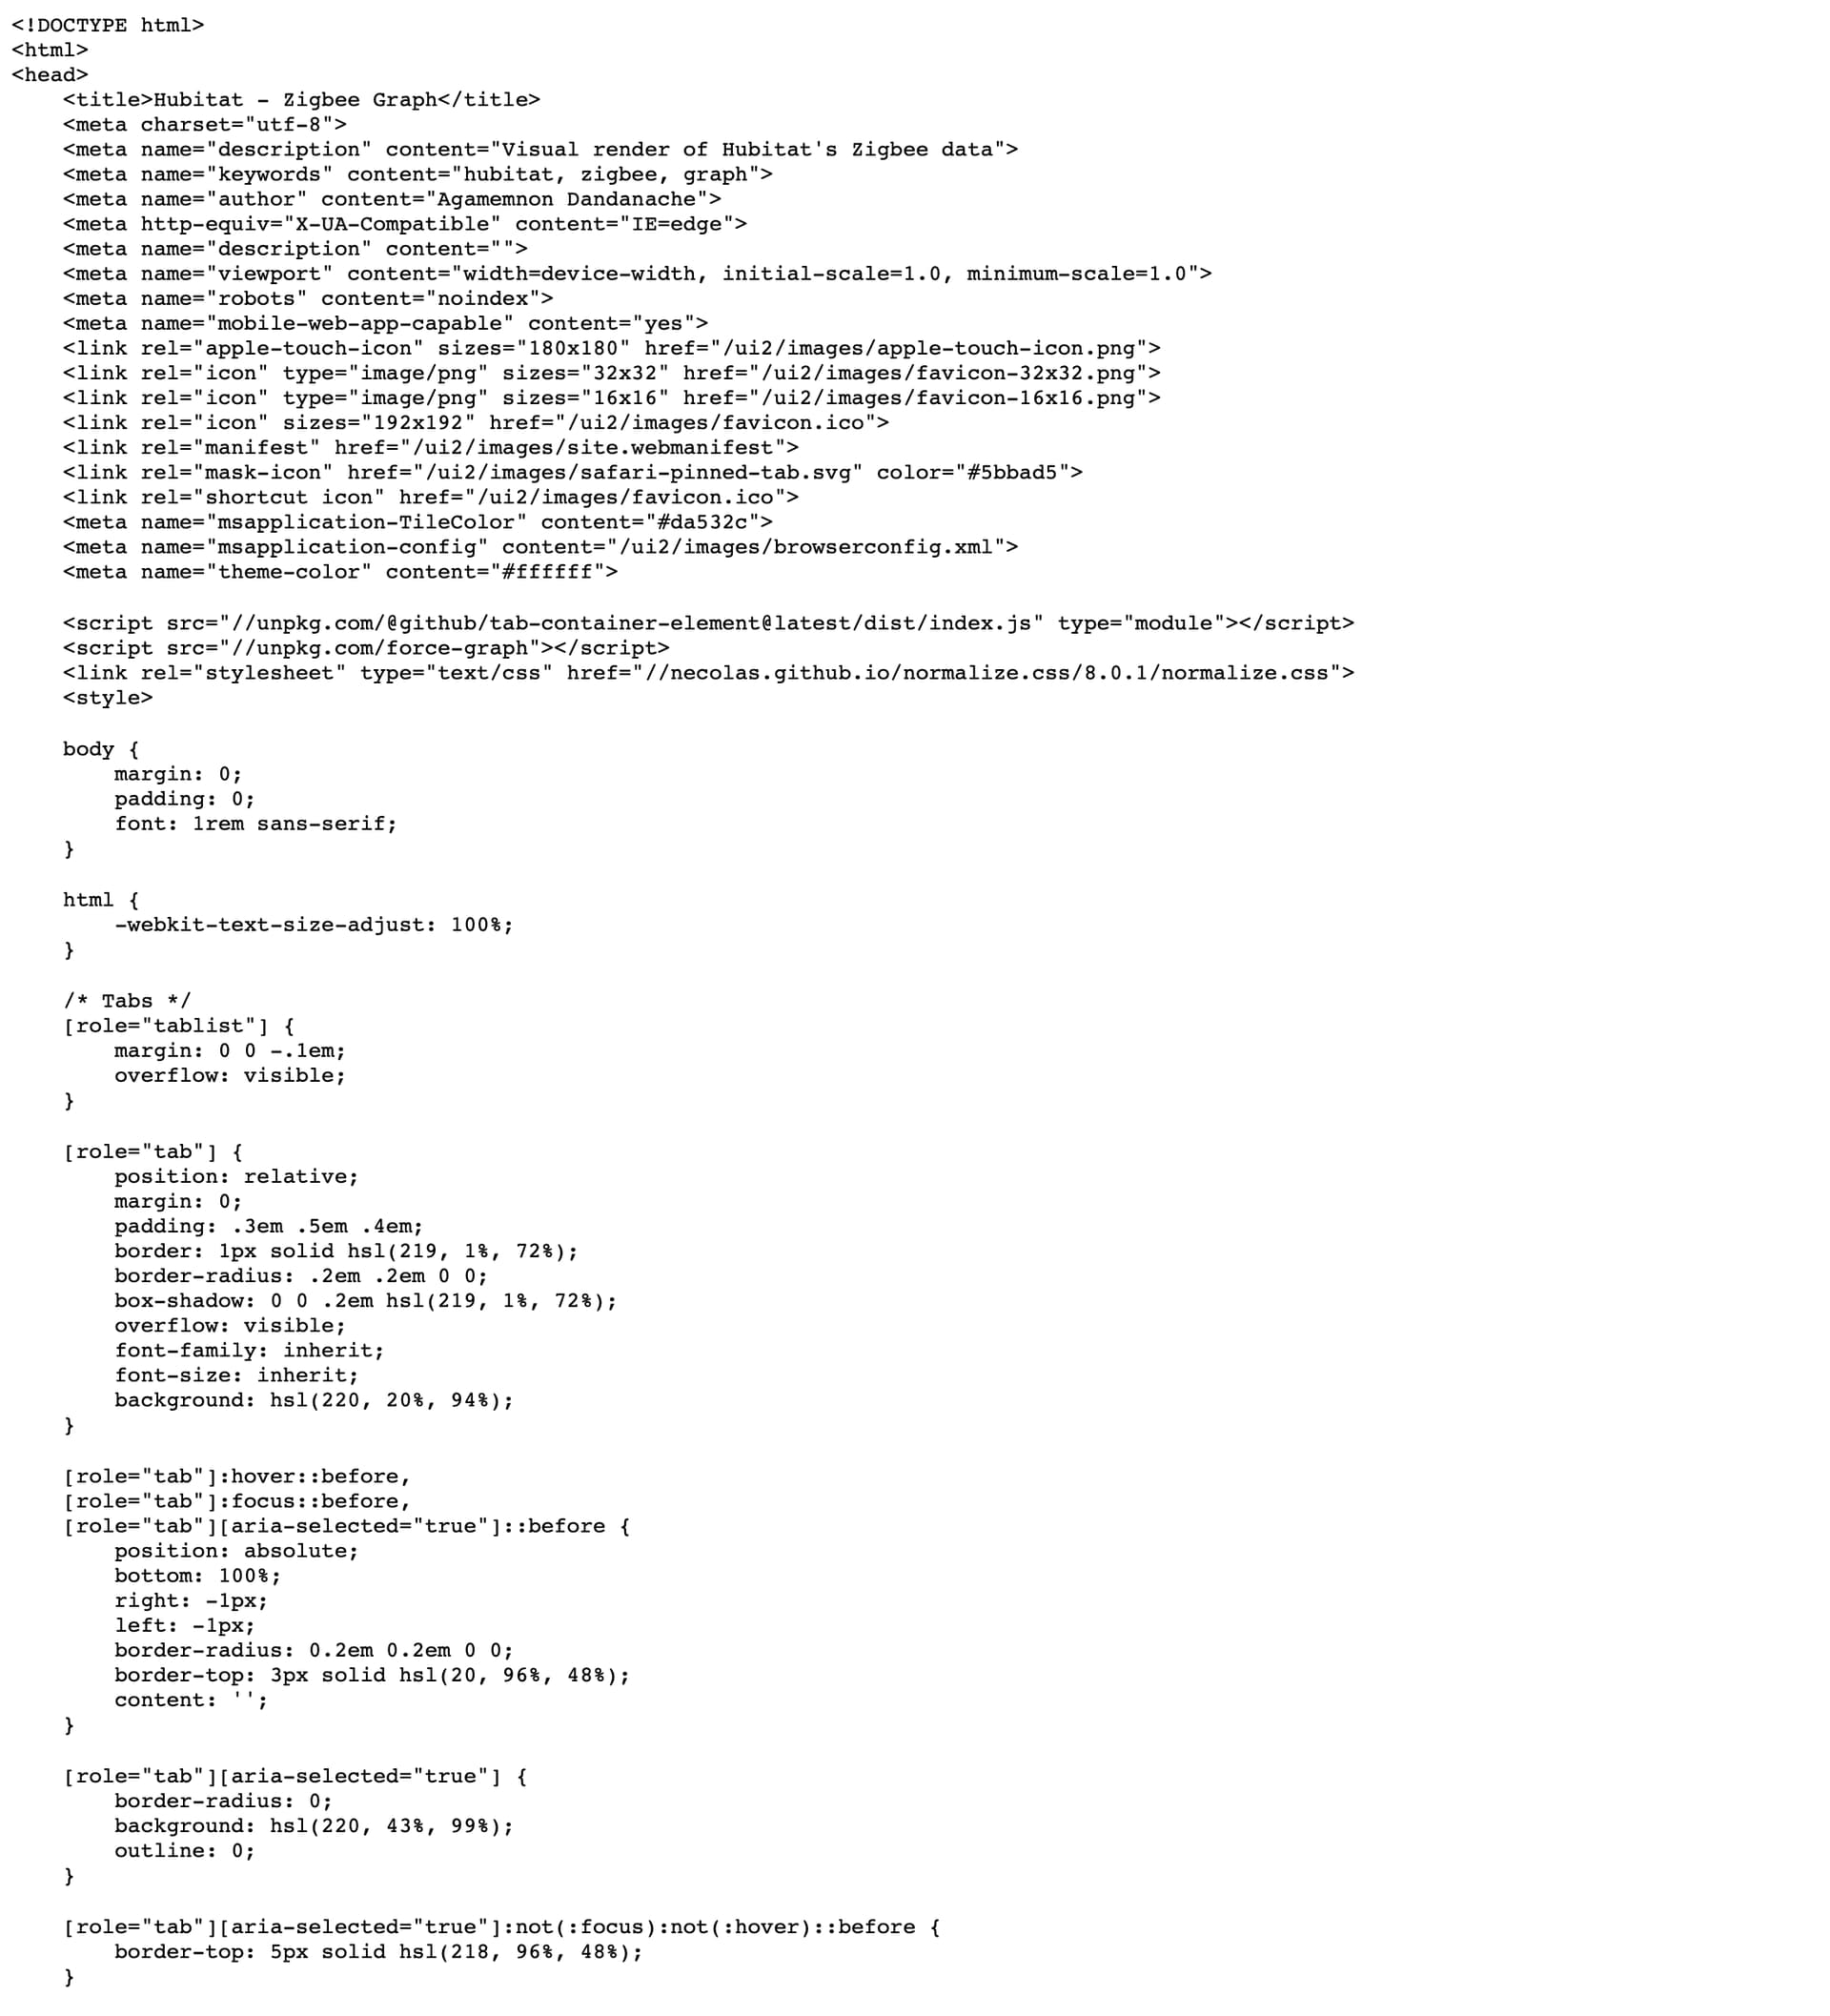
Download the "zigbee-graph.html" file from GitHub on your Desktop
Mac users: open terminal and execute: cd ~/Desktop; curl -OL https://raw.githubusercontent.com/dan-danache/hubitat/master/zigbee-graph-app/zigbee-graph.html
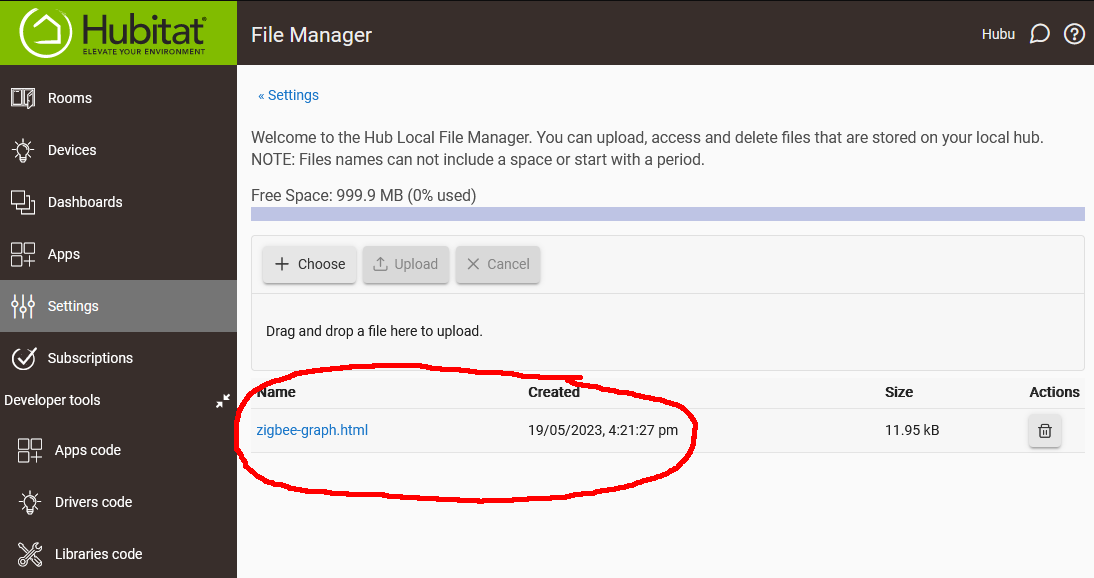
Open your Hubitat user interface in the browser and go to "Settings", then "File Manager"
Click "Choose", select the "zigbee-graph.html" file from your Desktop, then click "Upload"
I was not even aware of how to find the zigbee data until I read this post, being able to visualize it this way is amazing! Makes me wonder though, is Z-Wave network information similarly available from Hubitat in text format like the Zigbee network information is?
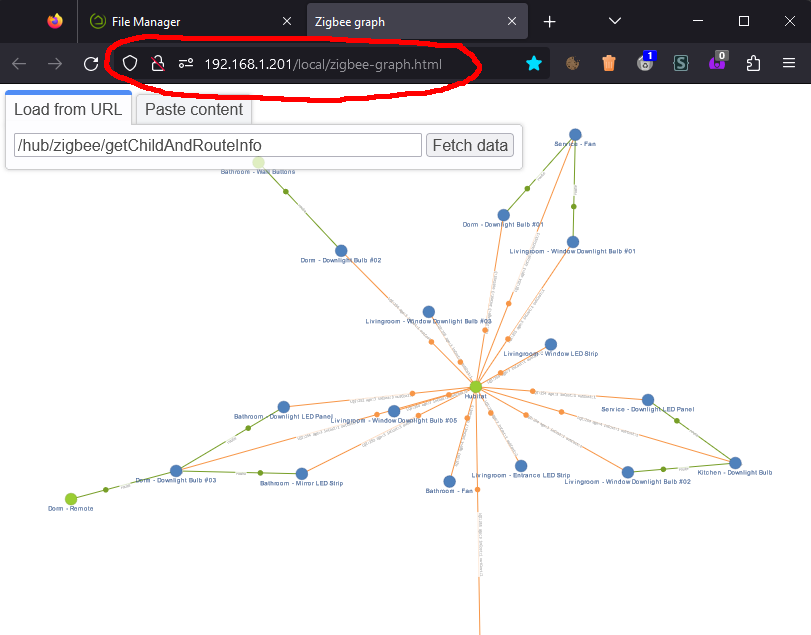
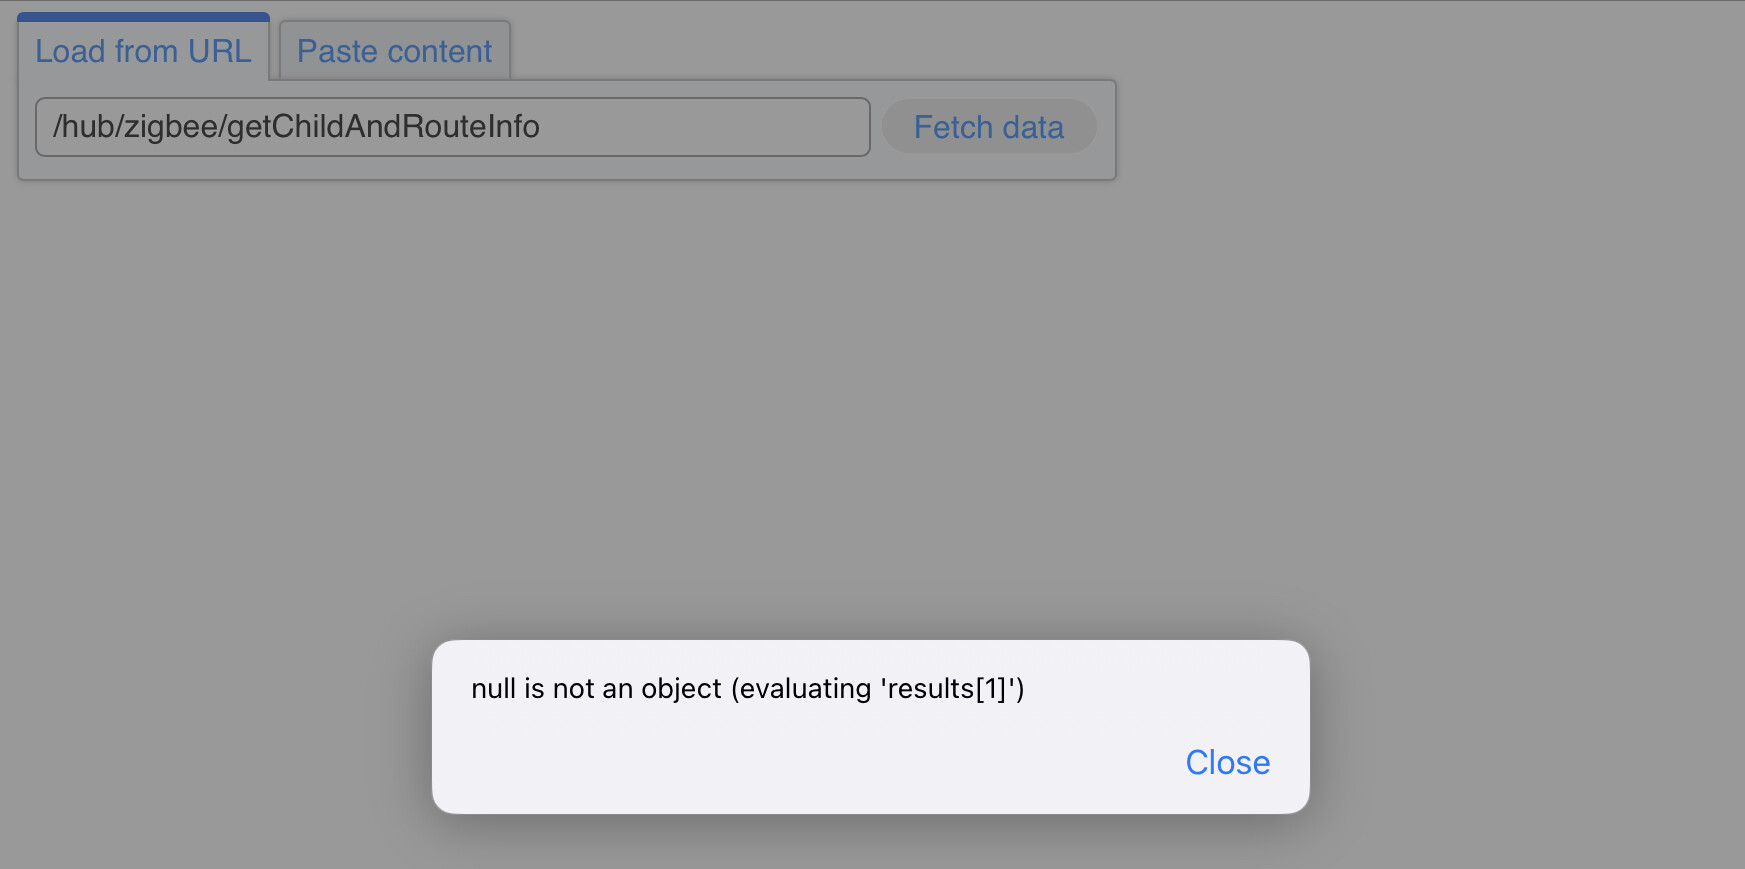
I have the graph working by pasting the output of another browser window directly into the second tab, but haven't succeeded in getting the input field of the 'fetch' tab to work... what format does it want for the URL? I tried prefixing /hub/zigbee/getChildAndRouteInfo with my hub's IP address (and also prefixing that with http://) but I get an http error 404 popup when clicking on the 'fetch' button.
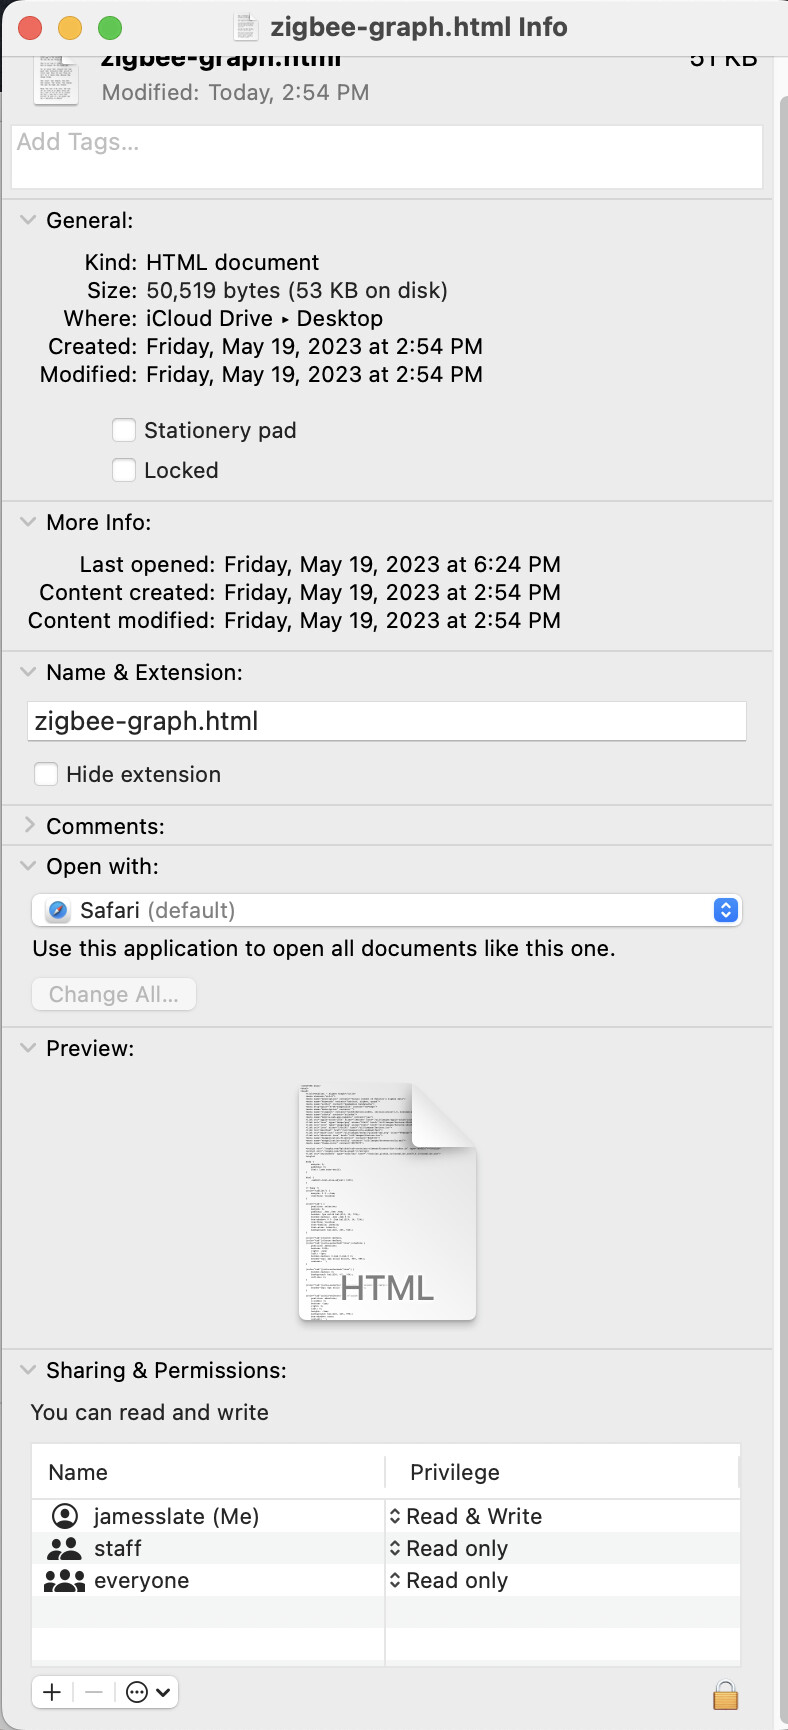
OK - what am I doing wrong? When I click on the file after saving it, it brings up the text of the file, rather than running the code. MAC M1 using Safari or Chrome.
(It also shows that Zigbee routing is at least in the neighborhood of wonkiness with Z-Wave routing. )
ETA: 2 questions:
Is it normal to have loops shown for non-hub devices that are repeating to other devices? It only shows them on the repeater at the 'end' of the line. (2 repeaters are hub>repeater>device and both of those have loops on the repeater section. A different segment is hub>repeater>repeater>device and that segment has a loop on the second repeater in the hop.
Do some/most/all battery Zigbee devices gravitate towards repeaters? My snarky comment above comes from the fact that all of my sleepy devices are all on repeaters, even if they (should) have good signal to the hub.
Tony - do you think it would be possible to feed data from XCTU to this beast? Since the info in the getChild... endpoint is not complete regarding zigbee devices and connections.
Really nice job, I've added it to the filesystem and works great. Since the Zigbee data is always updating, would be nice to have it poll that URL every 5 seconds and dynamically update the graph so you can visually see if devices keep moving (indicating an issue)
In Safari on my iPad, it saves it with the .txt extension. I have to manually go in and remove the .txt - every time. And this is hidden in the built-in file manager app (shows as .HTML). I have to change it in another app…
From your screenshot however, it looks like it is being saved correctly on the Mac.


 )
)