same behavior at staging
I suggest you try these instructions:
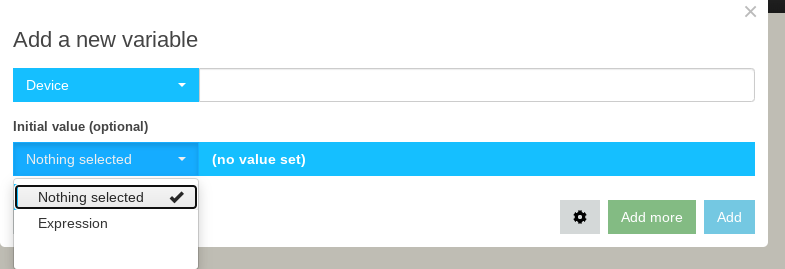
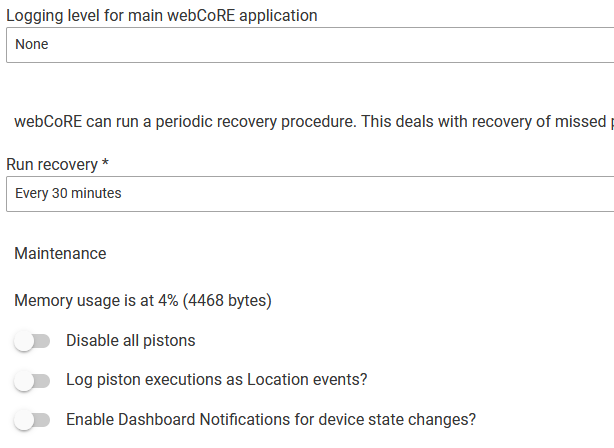
I can't figure out how to turn off logging. In the WebCore Hubitat App I have:
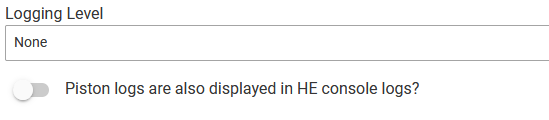
The setting on the piston in Hubitat is:
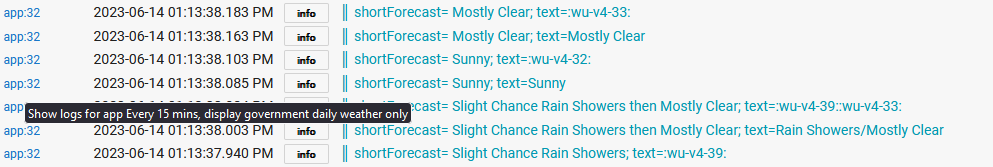
In the test page, I have the following. Note that you see informational log messages in the test page and I don't want them.
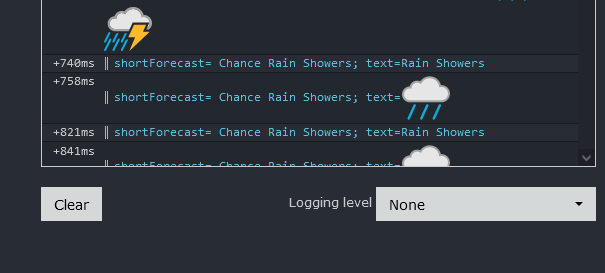
and the log messages are showing up in the hubitat logs. See:
Any ideas??
Currently didn't get it back to normal on my ChromeOS but tried on two different browers and there it looks much better. So I can confirm it's a browser issue. Tried to sign out and in again, cleared cache and cookies. So far no luck. Will get it back to work.
you would need to post your piston. Those appear to be the piston doing log to console, which is not webCoRE logging, but the piston doing its own logging.
Oh, so "Log to console" messages always end up in the Hubitat logs and on the piston testing page? I wanted to leave in my debugging statements but turn them on/off in a setting. Too bad.
Thanks for the help as always!
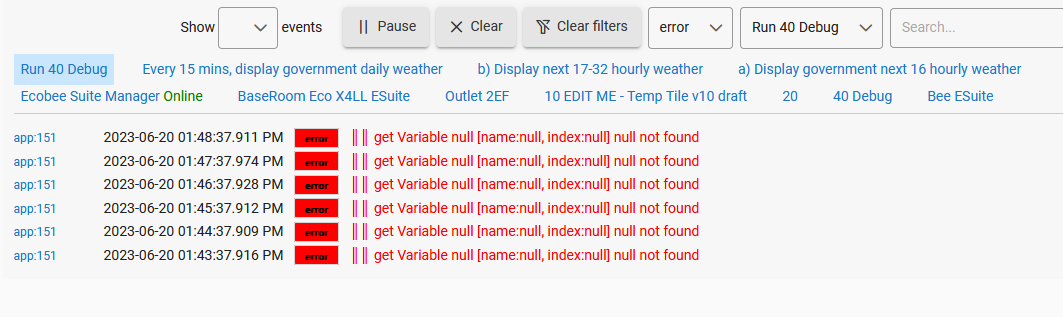
Not sure if this really matters, but in the course of debugging another issue I found the following error is put into the WebCore Log. (I turned on webcore logging Full for the piston in WebCore App in Hubitat). I'm guessing it has to do with the Execute piston statement. The execute piston has
The piston is:
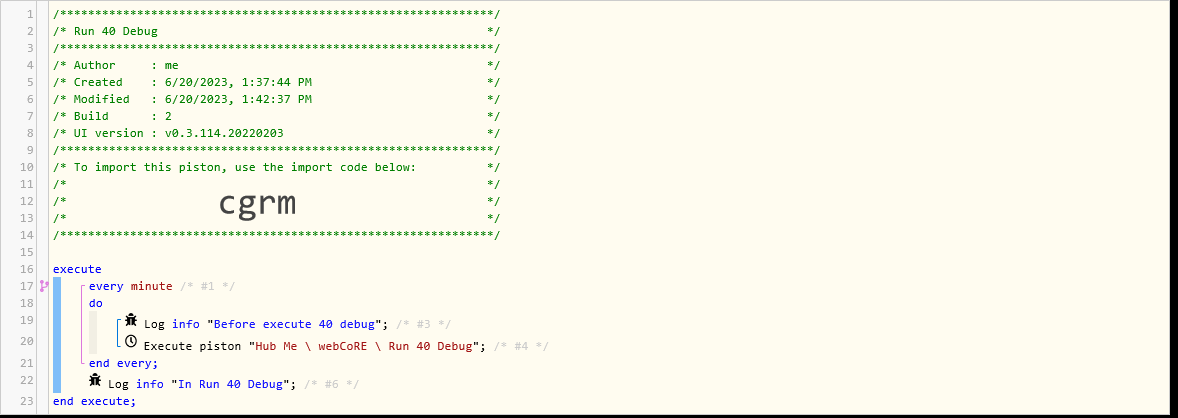
Hope this is helpful.
thx, found the issue, I will post a fix.
If you have user install you can HPM repair to get it.
If built-in, will need to wait for this to make it to firmware update.
1 Like
Device $status is showing as INACTIVE when the device is still working in Hubitat.
I've had Webcore report devices (different types) as INACTIVE a few times and I'd like to debug this issue. It happens about once a week or so. Today, my Z-Wave lock reported as INACTIVE in Webcore at about 3:30pm. I went to Hubitat and was able to remotely unlock it and relock it. The piston still reported it as INACTIVE. I rebooted Hubitat and the device shows as ACTIVE again in Webcore. The lock events were:
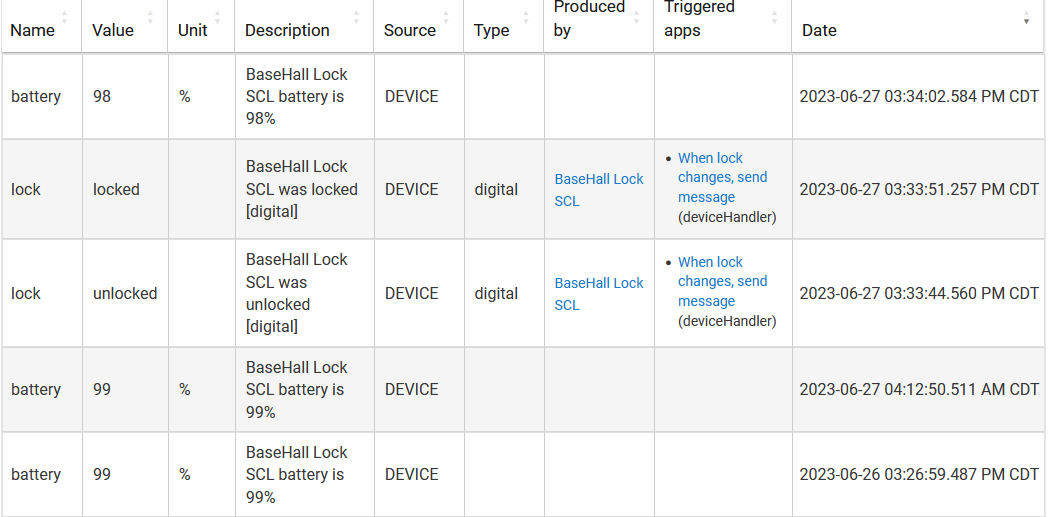
Prior to me locking and unlocking the lock, the last event was almost exactly 12 hours before the INACTIVE notice. There were no errors in the logs for the device or piston.
Thoughts?
You can turn on full logging in your piston.
webCoRE to gain $status does device.getStatus(). I don't see webCoRE doing any caching of the result
Also show a green snapshot of the piston
This is likely part of the reason this was removed from the display table on the hub's Devices list years ago (and is basically an undocumented remnant in the platform as far as I can tell) -- it's never been reliable, and I think it's always been a naïve time-based approach. This shouldn't be specific to webCoRE (unless it caches anything internally, though from the above it appears not), so the only connection is that webCoRE might be one of few ways you can actually see this data yourself.
If you're looking to monitor something resembling device health, I'd strongly suggest another approach. I wrote a custom app to do this for myself, though I'm not trying to push that here. I'm sure you could create a webCoRE piston that does something similar. A condition using the "last activity" attribute plus whatever comparison you want would get you something similar but far more customizable to account for specific device behavior. (Or some devices might respond to a "refresh" command and update either of these attributes if you do it at least a few seconds before checking them, though not all, and doing a bunch at once might not be great for your network.)
@nh.schottfam Can we get more than 3 highlight-able areas on a gauge? Trying to make an AQI gauge and since it's limited to 3 it doesn't work with 5 major tics properly. Or am I missing something?
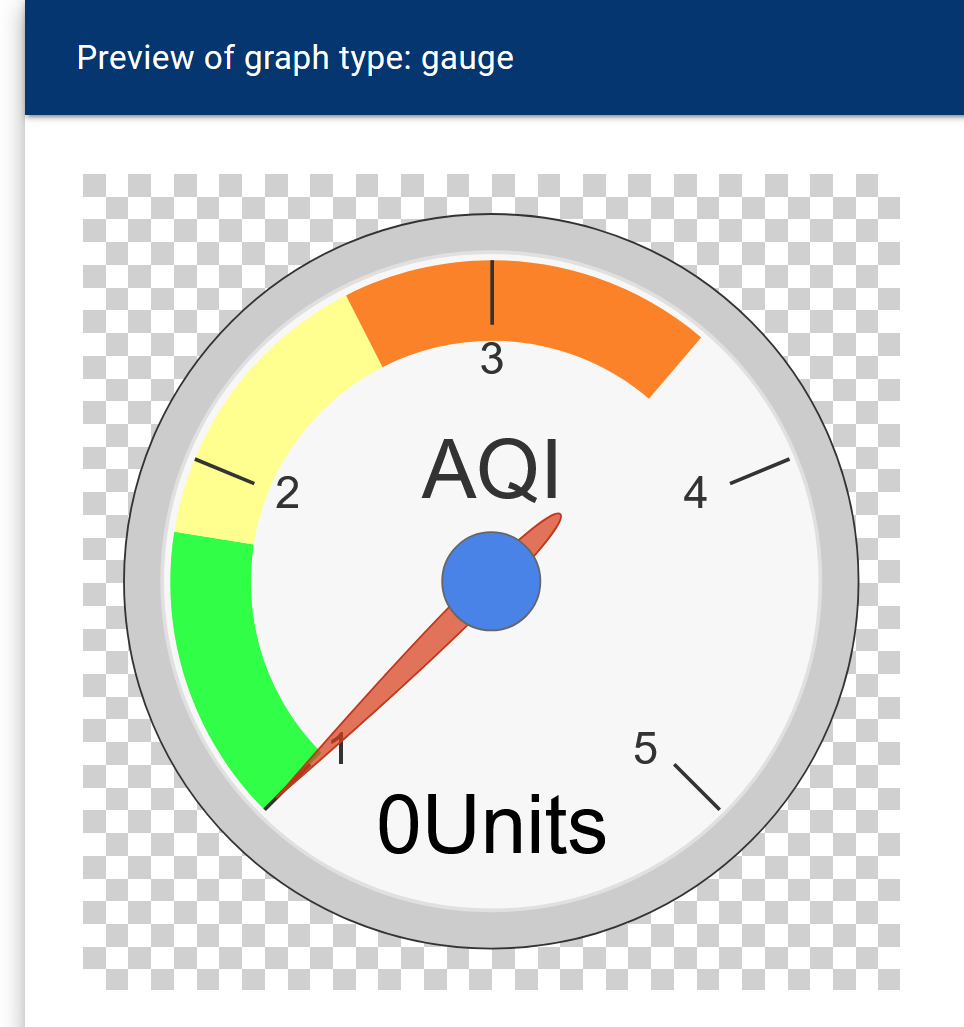
The gauge is rendered by google charts, it is a limitation on their end.
There are some older discussions in the webcore community regarding this:
I have a couple that overlay colors like this:
and a few that change color dynamically based on the value:
1 Like
Gotcha! Thank you for the info.
New release available today
hpm update to get it.
Adds rooms support and optimizations. See note 1 in this thread.
1 Like
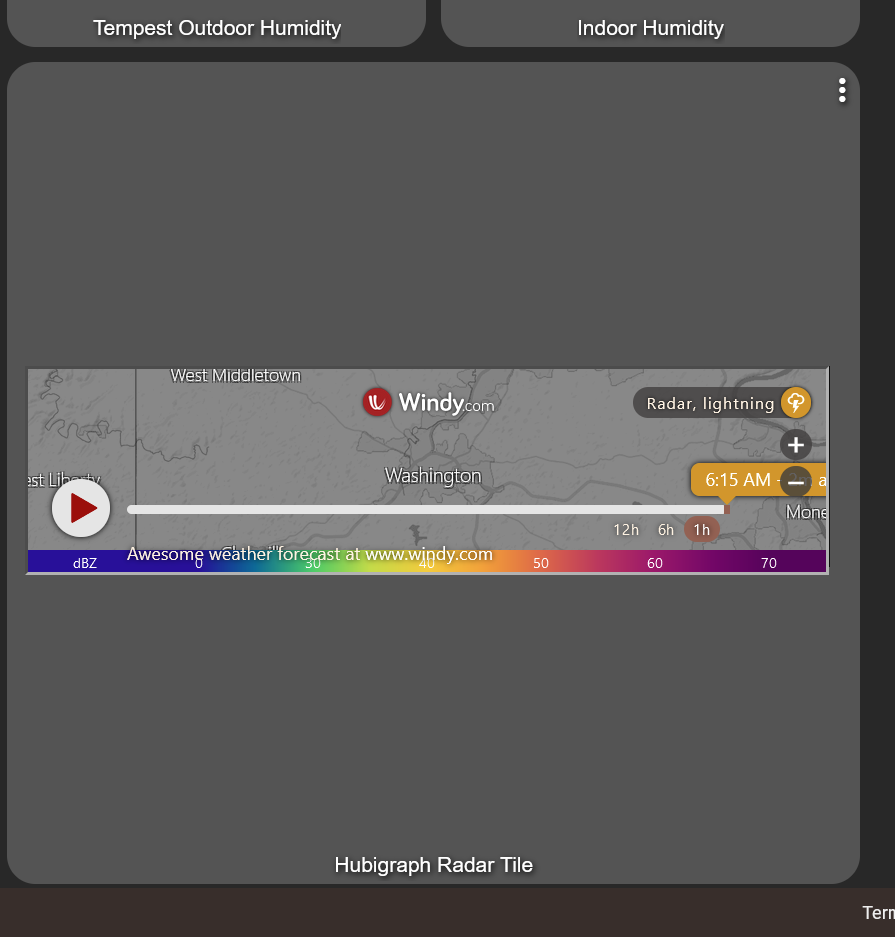
Sorry to bug but graph issue again. I noticed this in the original Hubigraphs and it looks like it's still present in webCore. The Radar tile doesn't display right in Firefox. It displays correctly in edge/google... Any chance to fix this?
Firefox
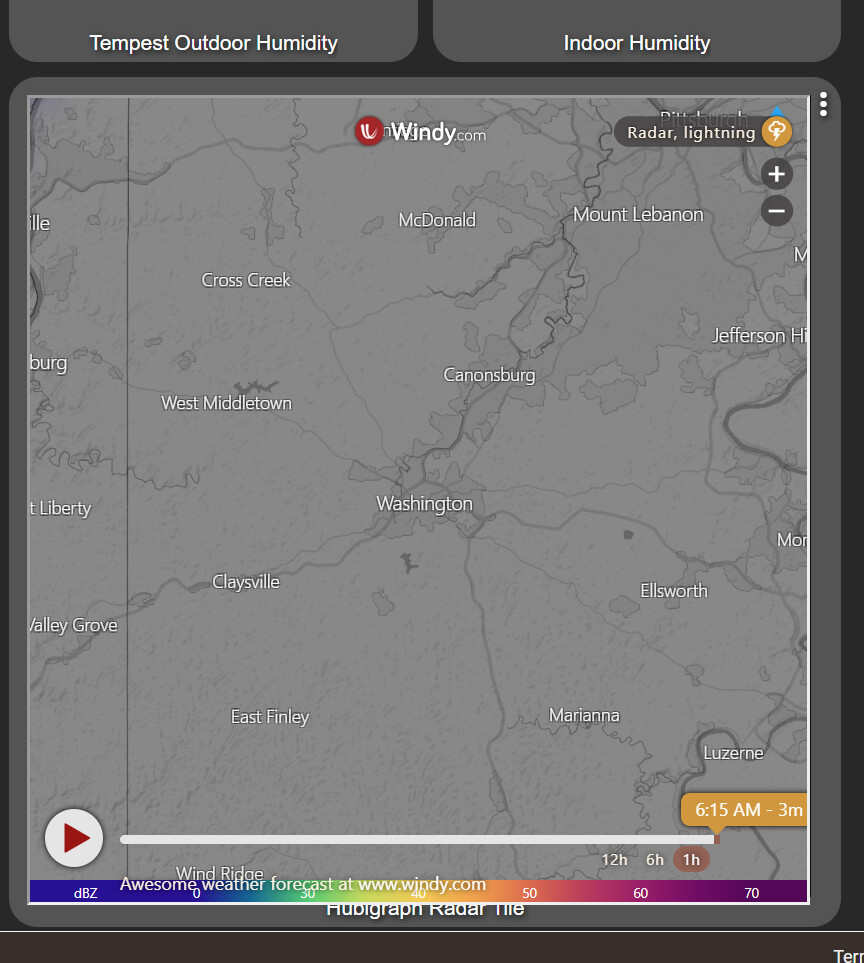
Edge/google
Major error here:
"Sorry, the registration code you provided did not Work..."
No matter what browser I use, not taking the code.
Did a repair on webcore installation, that didn't help.
So this is in regards to connecting the IDE?
See:
and the two following notes in the above thread.
How would I know if it can't contact the IDE?
Also, this is happening right at the 4-digit code, it doesn't let me go any further.
I was just editing pistons last night. This is weird.
It still works on my laptop, but not on the phone. I cleared cache on all the browser apps that I tried to log into.
It's almost as if it's hanging at the server level before it tries to find my Hubitat, it happens so fast.
Any help would be appreciated.

