@bobbyD@support_team
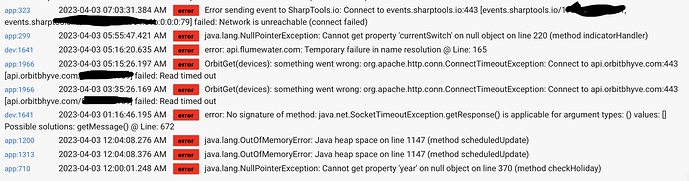
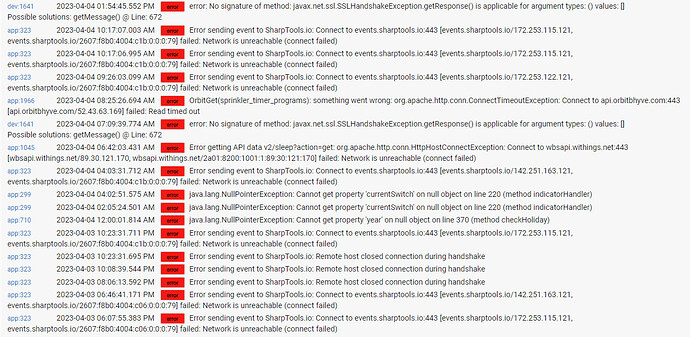
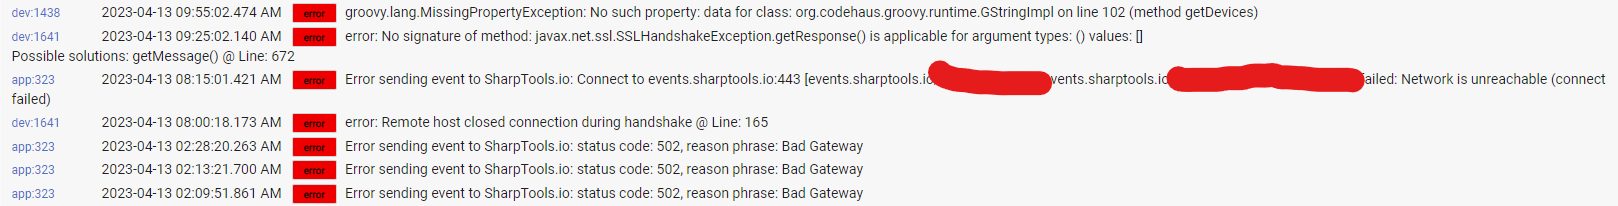
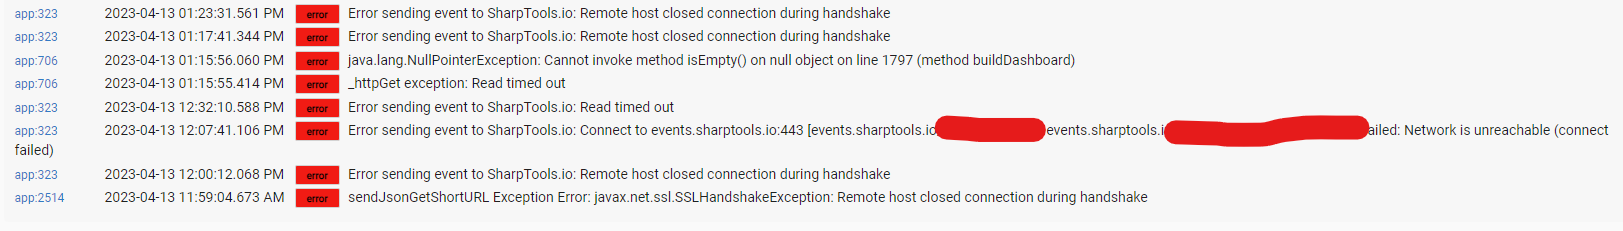
I have a C5 running 2.3.5.121. I'm all of a sudden having trouble with my hub and cloud-based apps. Multiple apps can't seem to connect online so I don't think it's an issue with any apps:
The hub Network Test all passes though without trouble.
All of my non-smart home devices seem able to connect to the internet just fine, so I don;'t think it's a problem with my actual network. I have overridden DNS settings on the hub using the recommended DNS servers, as well as overriden DNS settings on my router (Orbi RBR50) with the same DNS servers. Problem persists.
A hub reboot seems to fix the issue, but only temporarily - it keeps resurfacing. Any suggestions?
My hub is connected via Ethernet, with DHCP and auto reconnect every 60s. I set a static IP for the hub with my router.
I have disabled the 1200 and 1313 apps but the problem persists.
I have a C8 on the way, but really want to get this resolved before migration, as I would rather not propagate the issue to the new hub.
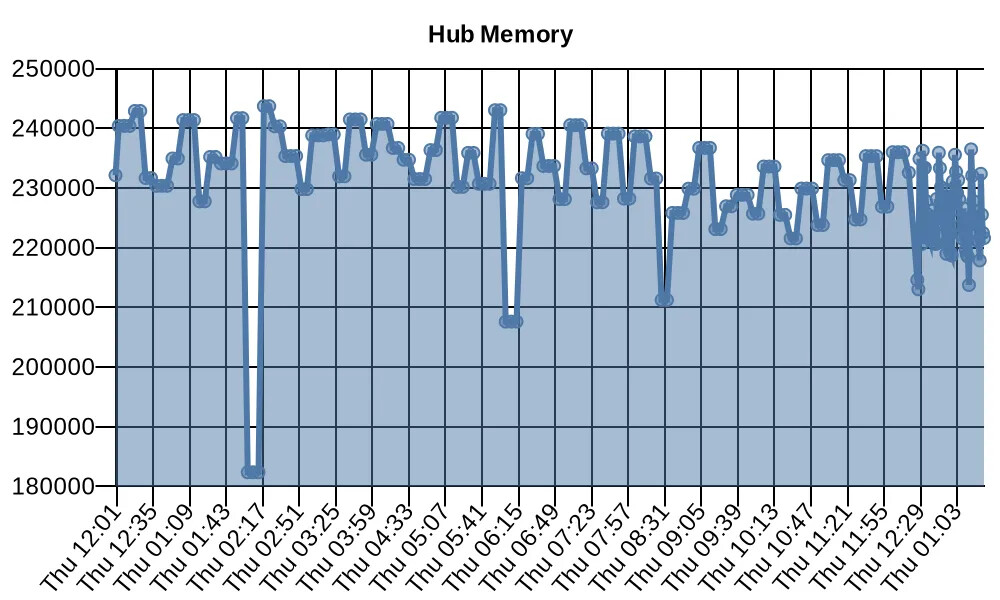
By chance do you have the hub info driver? If you do what is the memory like on the hub when these errors start to happen. If not can you load it and check the status of the hub when these errors start to happen.
Those two out of memory errors are very concerning. How long did you leave it in this state. It looks like the majority of those are Sharptools. Can you try disabling sharptools to see if that will help as well.
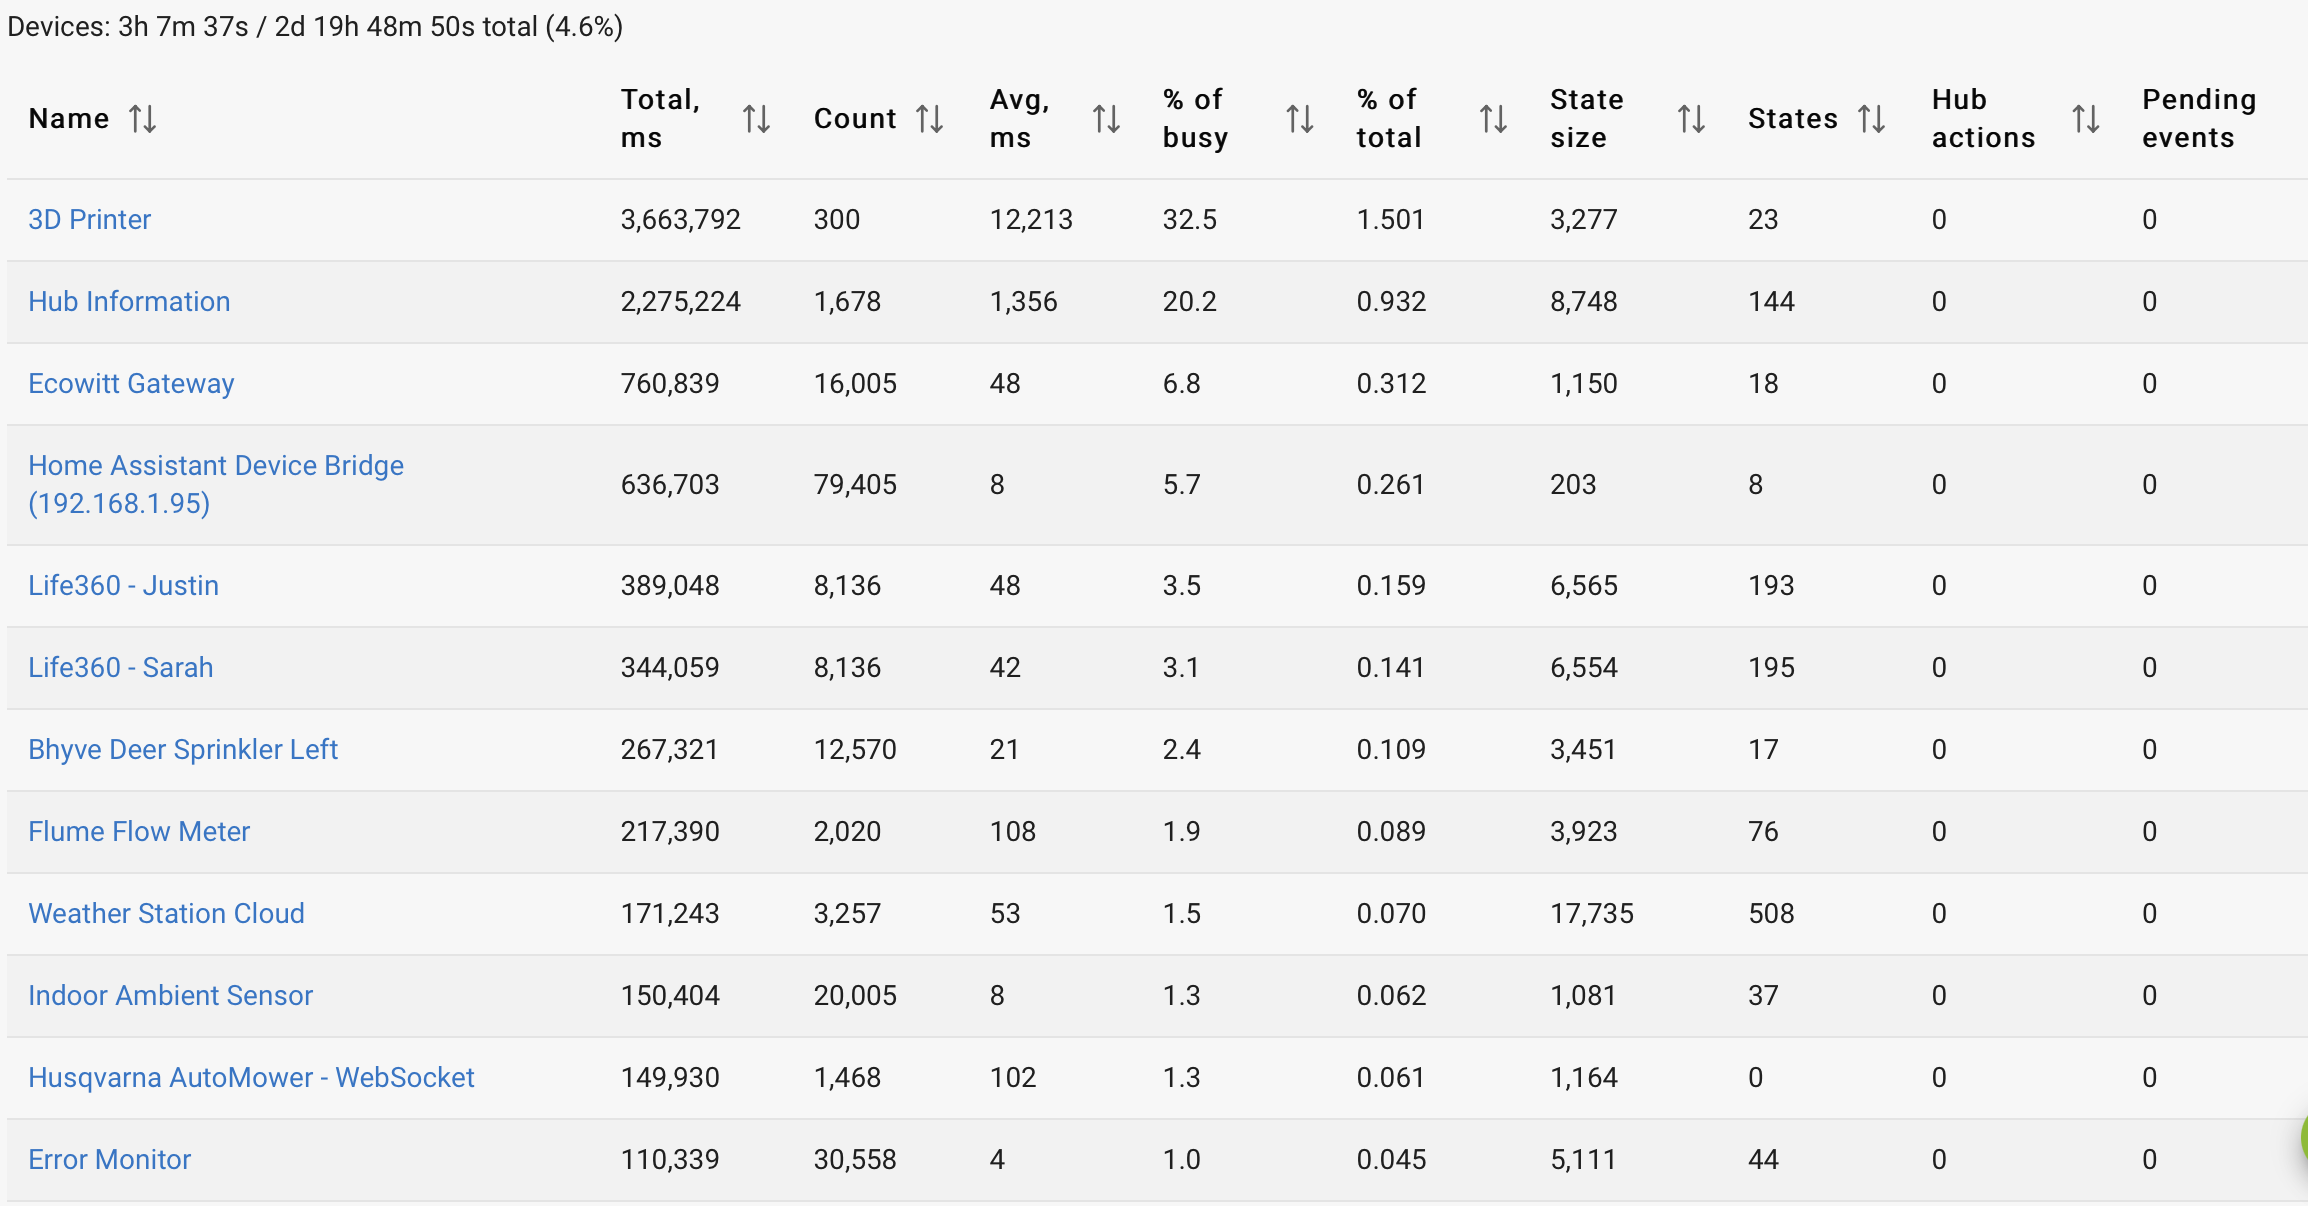
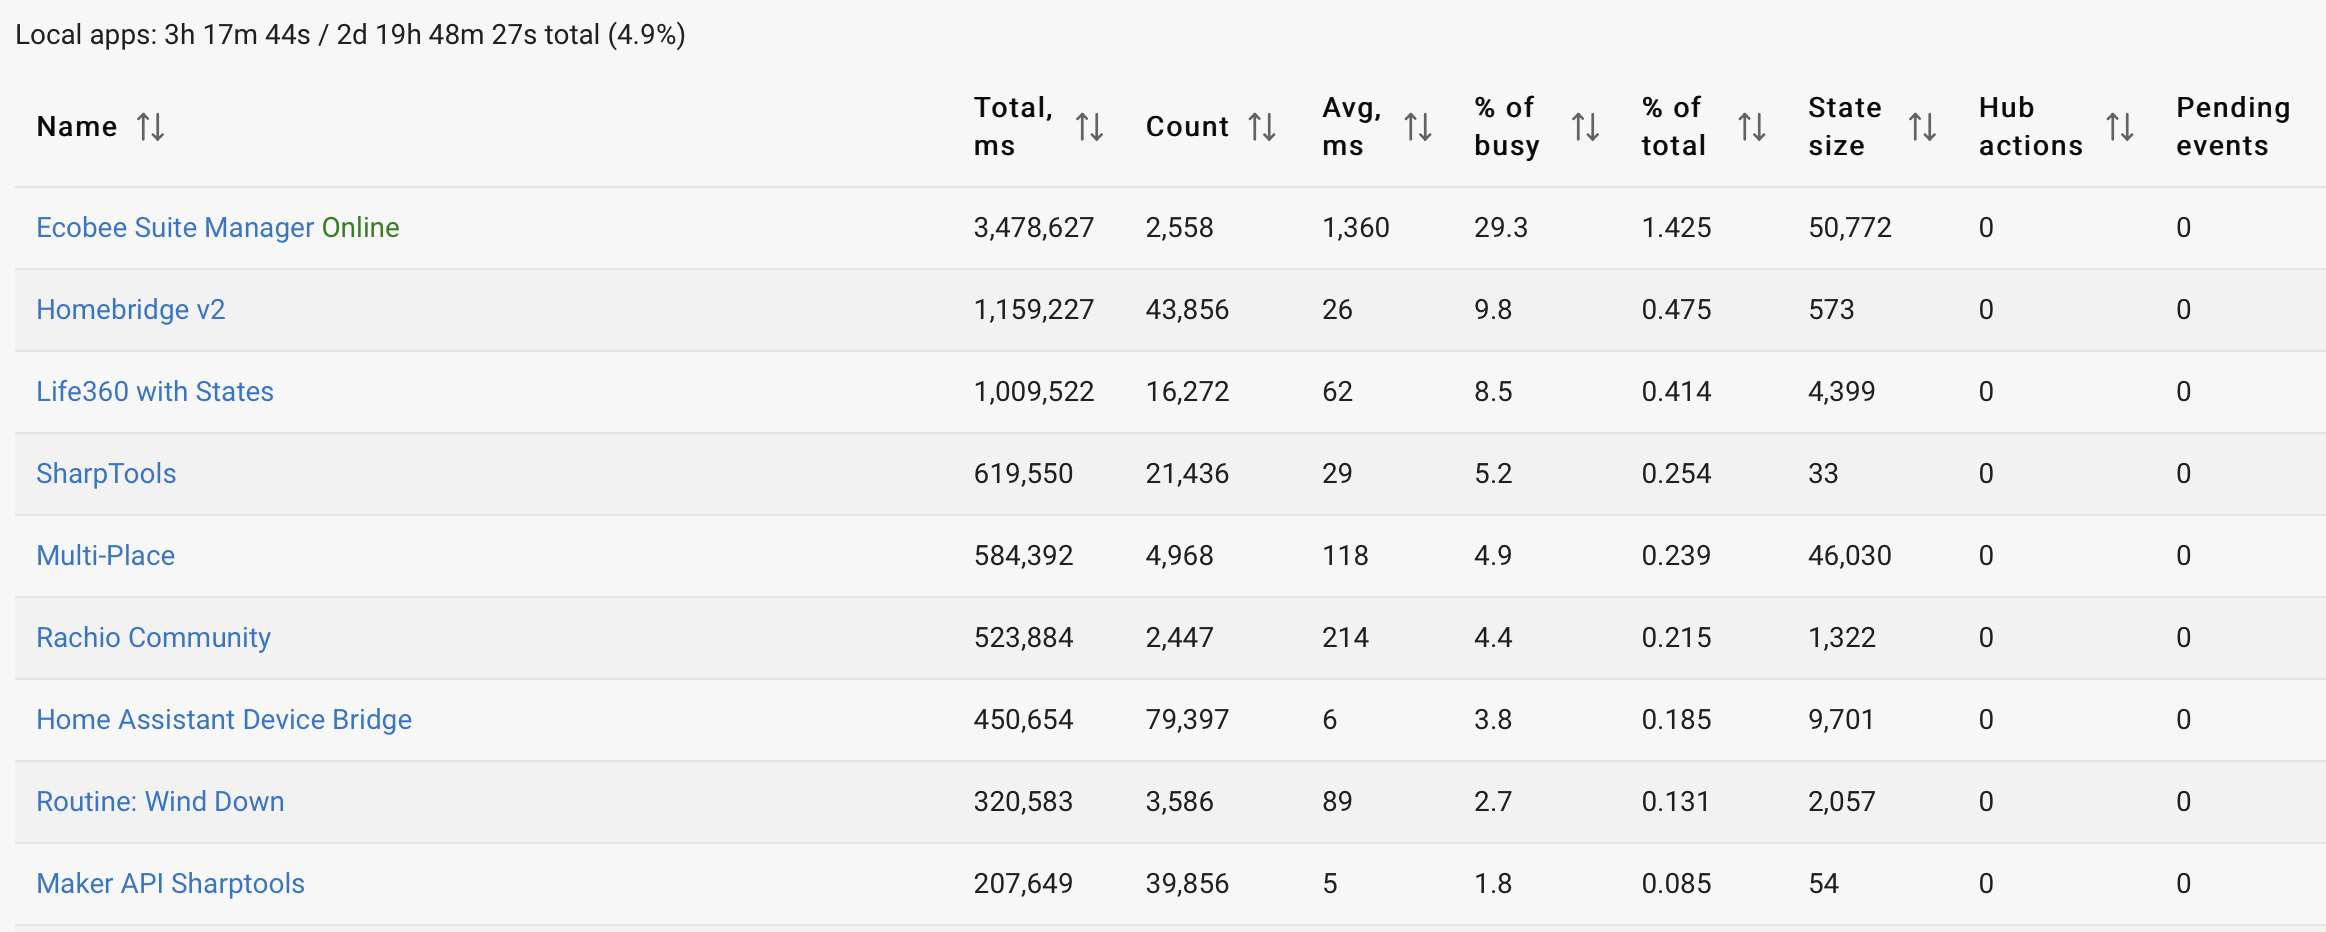
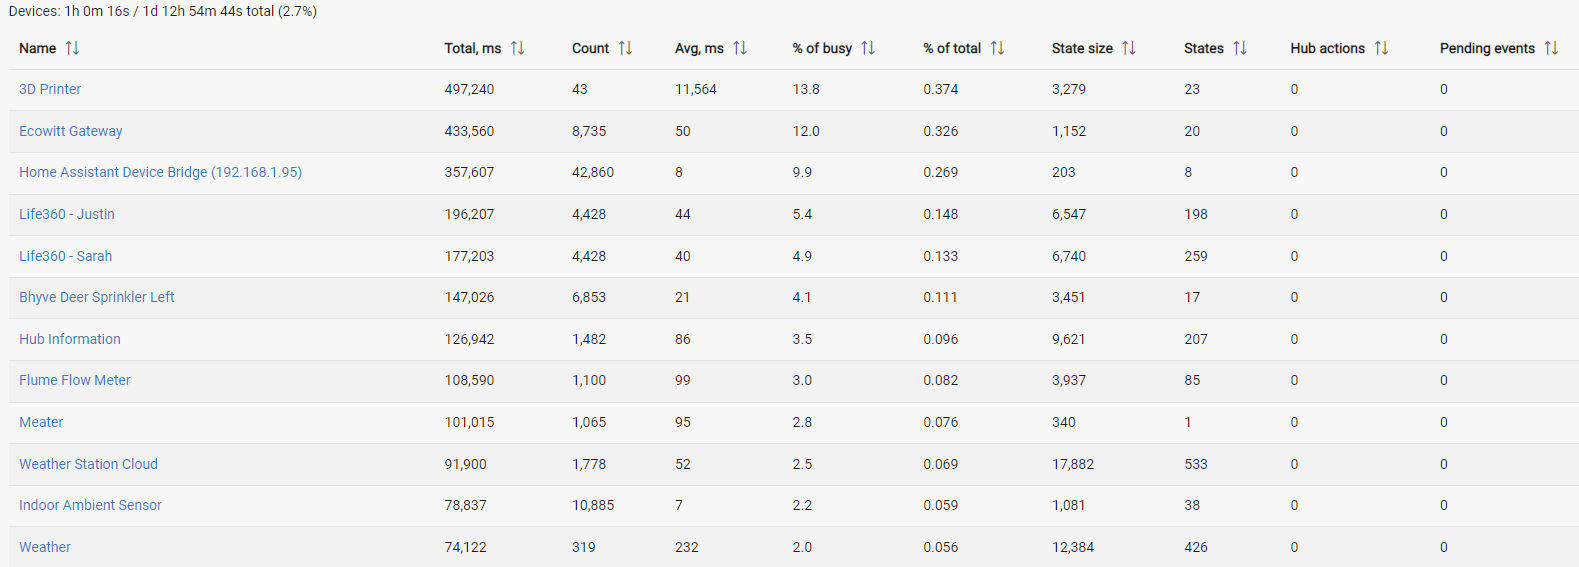
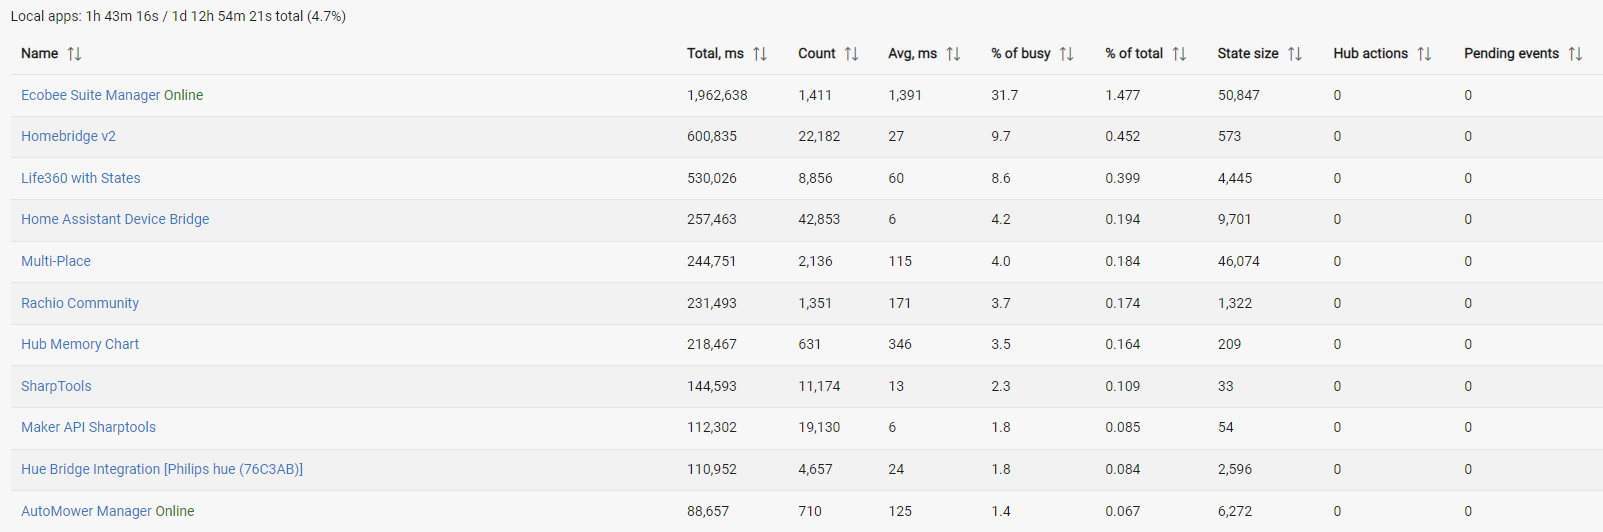
Check the App and Device stats tabs on the logs page after the hub has been running for a little bit. Anything consuming a lot of resources should stand out pretty good in there. Could be one custom app or driver that is taking to hub into a downward spiral.
Cross-linking to the original post from a few days ago from the other more generic Get Help category in case there's any clues from there that might help others.
SharpTools by it's nature is likely processing a lot more events than other apps, though with very little processing as the app is a lightweight event forwarder. Since most people who use SharpTools have several dashboards with many (most?) of their devices displayed in some fashion, the app ends up touching a lot of events.
That being said, it's a perfectly reasonable approach to disable apps one-by-one and see if anything causes the errors to stop.
Right, but something is consuming resources. The fact there is a out of memory error in that screen shot int he first post means something is causing a serious problem. I have only seen that error message pop up when there is a major problem somewhere in the hub with resources.
I use Action tiles myself and that app is similar, it doesn't do anyting but forward the events to their outside service. That said that application is consistently one of the busiest apps on my hub.
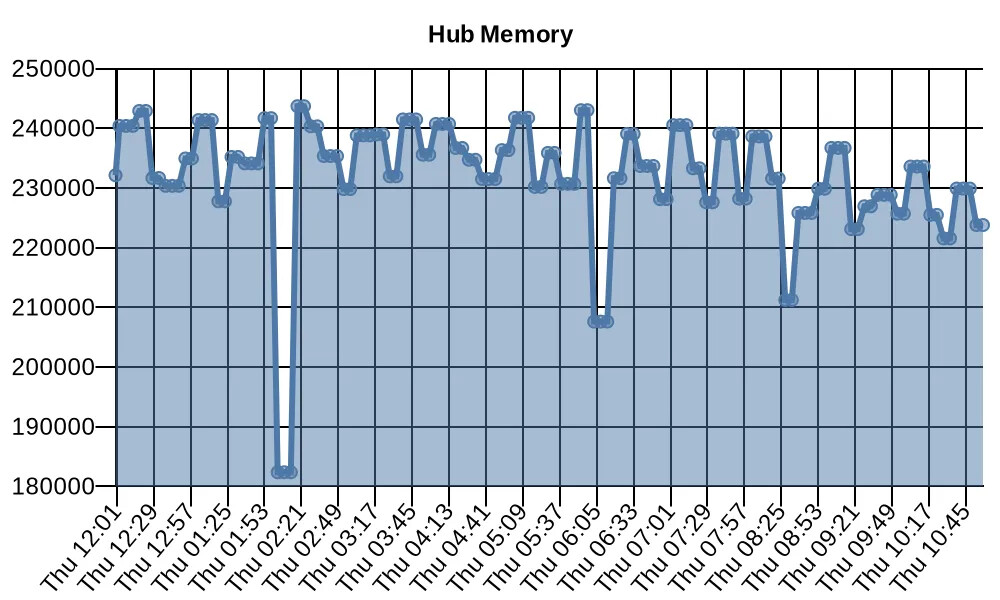
I would still like to know what the free memory is from the Hubinfo driver. My guess is we will find that memory is being consumed by something.
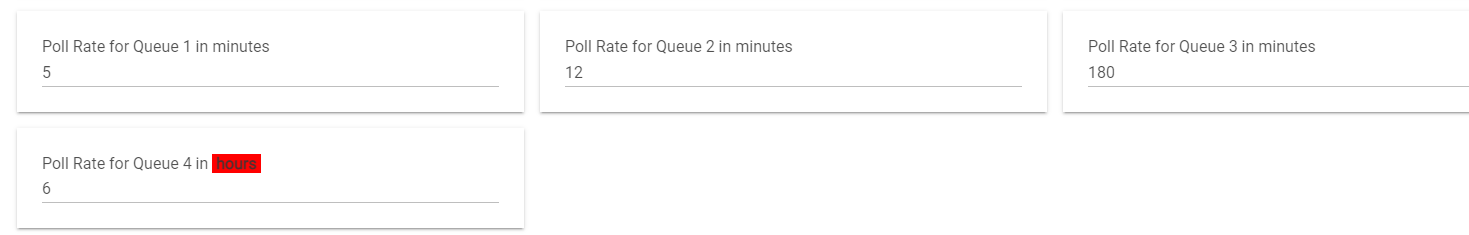
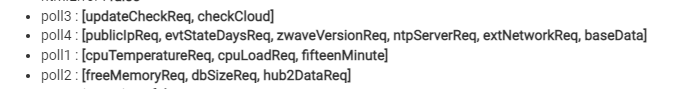
You should update to v3, it has 4 separate polling schedules so you can get the metrics you want regularly and the stuff that rarely changes you push out to update less often. [RELEASE] Hub Information Driver v3
May also want to reboot now, since memory is already very low. Start fresh with the changes and see how quick it drops.
Here is how mine are setup, I am doing free mem every 12 minutes. I tried to make it so the two most frequent polls would not typically land on top of each other. Also there is no point in going below 5 mins for CPU since the hub only updates the metric every 5 minutes. Some people are doing shorter for mem but I personally don't see a reason for that.
The reason for a shorter interval for free mem is to get visability to shorter interval fluctuations. I have seen occasions were my mem drops dramatically and then recovers within a few min. A 5 min or 10 min interval wouldn't show if that was the cause for a system wvent. I do one min interval, but use node red to collect it.
Can you set it to a shorter variable like 5 or 2 or even 1 min. That value is gathered as a instant value and can be gathered much more frequently. Once we get to the bottom of this then i would change it back to 5 or something larger, but having it set lower we could potentially get detail as to how long the memory is low or if it even goes lower.
It may also be good the next time this happens to collect and post the App and devices Stats page from the live logging info page. It may help atleast point us in a direction. All of those errors you are posting point to a networking issues like you are calling out. Are most of your devices wifi devices that use polling to obtain device status and such?
It may also help to see what functions where happening right before those events in your logs occured. Can you can the logs to see what activity was occuring just before those actions maybe that can show a precoursour event
What polling interval is your ecobee suite integration running at?
Also what time do you have the hub backup job running.
Can you adjust the Ecobee suite to 1 min instead of 5. The developer has indicated setting it lower is actually better with how it works.
On your hub memory graphic can you zoom in to only show the data that is by 1 min intervals.
Those Sharptools errors look like they are being triggered by the remote side. Do you have a firewall. What is your network setup like devices and how they are connected.