Hi!
I'm new on all of this smart home thing. I was looking for a solid device to integrate some sensors to automate a few tasks in my humidor room without using a dedicate solution that will cost thousand euros.
I did a superficial search a few moths ago and find something called mixtile, a multiplataform hub and i bought the thing but it's buggy as hell, not dependable and unfunctional.
I allready have a lot of generic zigbee reles, some valves and a few samsung/xiaomi sensors for water leak and temperature/humidity.
Recently I did a more deep search and find more multiplaform not cloud dependant (very important for me) hubs and every one says hubitat is the best. Stable and reliable. (And a very active community!)
Before buying another hub and discover it is not what i was looking for, I like to ask you people a couple of questions.
1 . Does this device have the ability to show some graphics with temperature/humidity and time on the axis? Something very basic, but no multiplataform cloud independant hub has this hability and I think for anyone interested in air conditioner and climate devices is an essential feature (horizontal table logs with time an value are ok too)
If an element goes off (sensor, rele....) Does hubitat senses it and could respond with some action?
And more important, once re-established, does hubitat reincorporate it automatically to the mesh?
I don't really care about how to interact with the device (via web interface, android app, computer based software...) So any issue related is not important to me, what I'm looking for is reliability and a complete/functional data log show.
I haven't seen anything on mine that allows me to visualize graphs of data over time. However, it does have built in MQTT support. I haven't messed with it yet, but I'd like to use it to log sensor data to AWS IOT Core (which costs pennies), and then leverage tools to graph/visualize the data.
But that requires cloud services, samsung smartthings app already does that pretty nice. What i'm looking for is offline data log.
I can't believe there is no multiplataform hub with this functionality.
Recently another user posted some questions about integrating the following device with Hubitat. It may meet some of your requirements. I believe it is mostly a standalone device. I don’t have any experience with it, so not sure if it fits the bill.
For graphs: if you feel like setting up Home Assistant, it has previous-day graphs/charts built-in for most devices ("entities," in Home Assistant speak--and you might be able to customize the history length). That's pretty much the only reason I kept it around (I used it before Hubitat was released).
It's a bit of work, though. Home Assistant itself takes some work to get set up, but it's better than it used to be, and Hass.io makes most of it pretty easy. Right now, the "easiest" way to get everything working together is probably to use Hass.io installed on top of a Linux distro of your choice, then run the Hubitat MQTT Bridge nodejs service on the same server/computer, paired with the Hubitat driver and app from the same repository. You'll also need an MQTT broker, which you can install inside Hass.io (Mosquitto, I think, is the one they offer). All have a few configuration steps you'll need to take, but ultimately, you'll be able to add devices to Home Assistant from Hubitat via MQTT.
Some of this will probably be able to be skipped at some point. Hubitat has MQTT methods available for drivers now in testing, which would eliminate the "bridge" service you'd need above. In the future, you'll probably be able to find or make a driver or driver/app combination that can speak directly to an MQTT broker (which you'll still need, but again, Hass.io can do that for you). Someone could also write a "Hubitat" component for Home Assistant (dev docs here).
That being said, Home Assistant isn't intended to be some sort of graphing platform; it's a full-fledged home automation platform, like Hubitat, that, unlike Hubitat, happens to have some native graph/charts available. Others have used InfluxDB/Grafana to do graphs as well, but the amount of work it takes to set either up is probably similar.
Wow.
I've been reading some home assistant documentation and i found the entire process very time consuming (i have basic programming skills and i'm not familiarized with raspberry).
Well, I know now why actual solutions for complete offline management for my particular goals are so expensive, they have no competitors at all!
I think it's crazy, store some logs and showing historical data was one of the easiest things when I studied java back in the day years ago. The thing is that there are cheap and stable devices with nice apps to do temperature/humidity logging but no one can interact with anything at all. (Inkbird for example)
Anyway, thanks a lot for the ideas and your time!!!!, One thing was true for sure, this is a nice comunity. Maybe in a year or two hubitat will incorporate graphics, i will be keeping an eye!!!
@signal15
NodeRed procedure seems very functional but unstable, lets ask jrau272 if there is a way to use just influxdb for capturing logs. @jrau272
That is awesome!!! Is exactly what i was looking for. But i would need another device working. This extra computer could be something like raspberry? I need the thing to be portable, like a tablet or a small laptop. The amount of money i would save could perfectly justify buying a 2nd hand 13" laptop for sure.
Noob question 1:
Running influxdb and grafana could be done on a android tablet?
Noob question 2:
Will this capture process involve more tools than influxdb and will affect hubitat stability in any way?
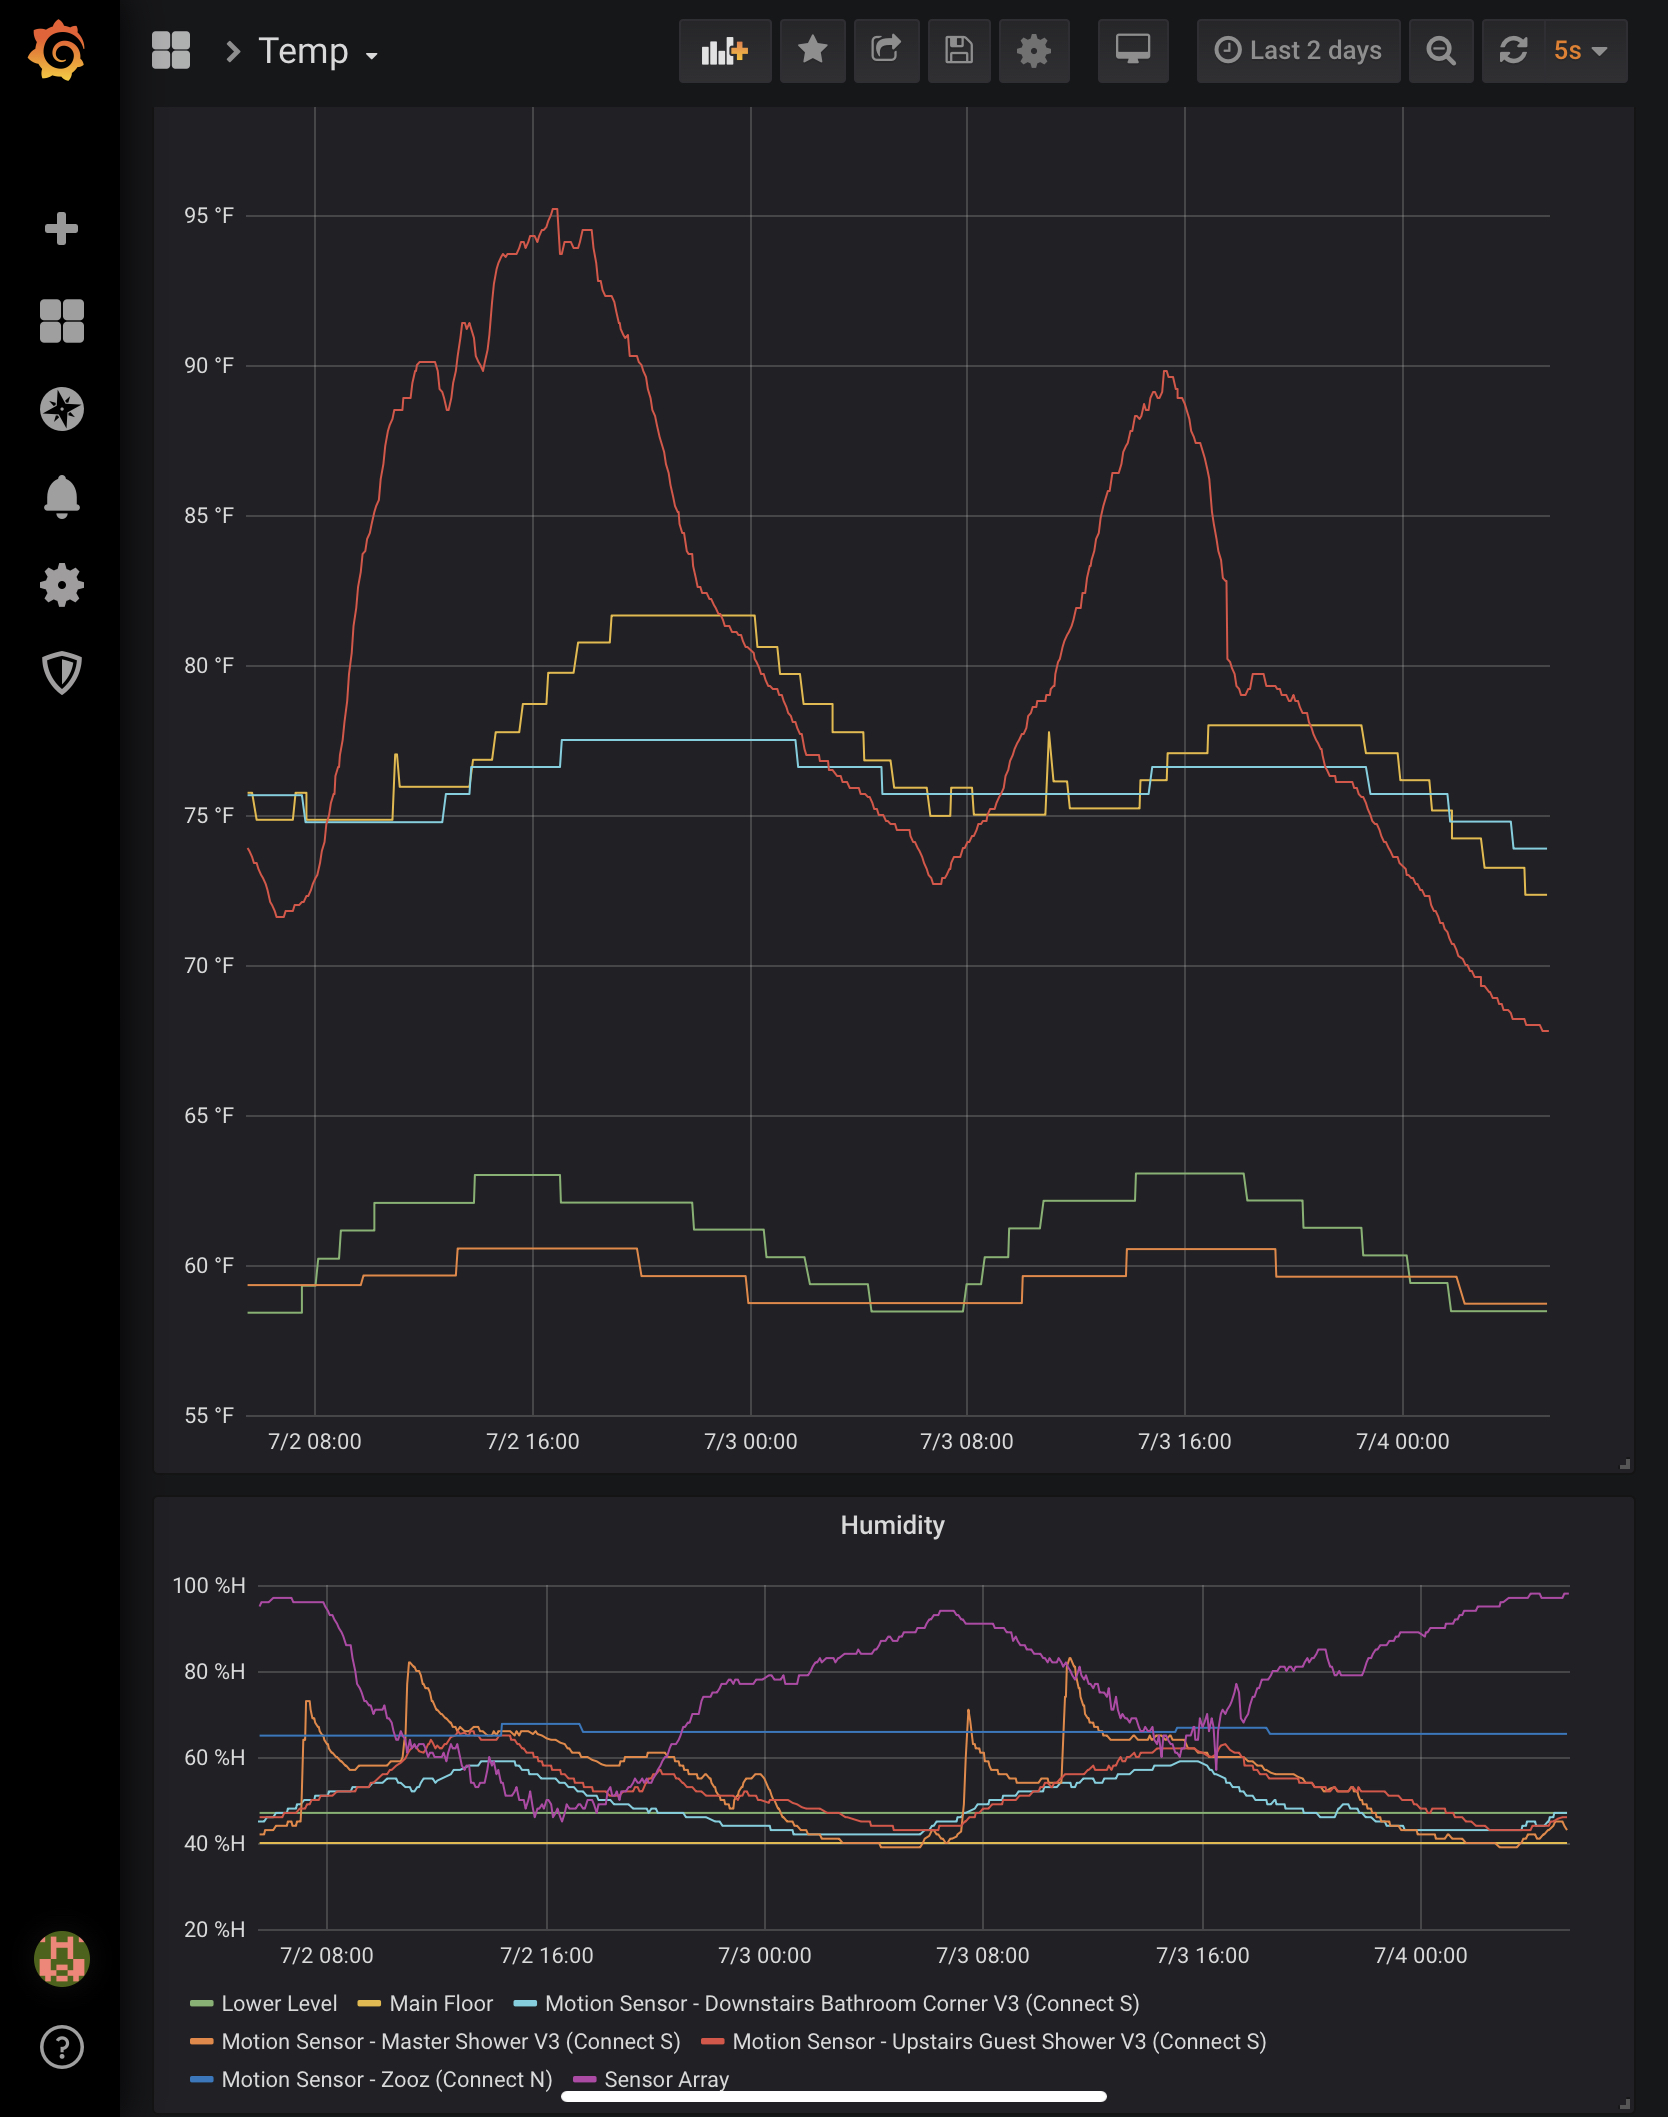
I run NodeRed, InfluxDB, and Grafana on my always-on Windows 10 home server computer. It also runs Channels DVR and Plex Server. I switched from using the InfluxDB Logger App on my HE hub to using NodeRed (WebSockets from Hubitat to InfluxDB) as I was having some stability concerns with my Hubitat hub. This has been a stable configuration for my needs.
Like @ogiewon, I also have the 3 tools required running on a Win10 box. I have had this setup for months with absolutely no issues. It allows me to capture all hub events for graphing, all log outputs for archiving (I keep ~1 months worth but I could store as much as I would like). I also use the the same setup to monitor my raspberry pi devices and a custom tank level sensor. It's VERY flexible and I'm very happy I invested the time to set it up.
Actually set up time was minimal but it took a little while to properly understand Grafana as I've never worked with graphing utilities and only had a basic understanding of databases. Even with this limitation I had my first few graphs configured in a couple of hours.
I've tried for more than a couple of hours in my windows 7 Pc to connect influxdb with grafana unsuccesfully. That seems very complicated for my inexistents database skills. Grafana use by the way seems pretty intuitive.
I read something about installing a virtual box and then a linux distribution.... But I keep thinking it's like killing flys with nuclear weapons.
They each have the instructions in their documentation. I'll try to send you the links when I get a chance to sit at my desk. Yard work calls unfortunately.
@stephack
Thank youuuuuuuuu!
I have the influxdb/grafana combo working right now under windows 7, i made some manual inputs to influxdb and i was working a little with grafana. This night I will install node-red. If I can connect to influxdb, I will buy hubitat at the same time!
By the way, i sold mixtile hub to a good friend of mine... Hope its functionality will be ok for him.