Isn't HE like $80 right now? Just buy the thing. You know you want to. 
2 Likes
I rather have a Pi on 24/7 than my home pc, have anyone done this on a Pi and have a brief walkthru?
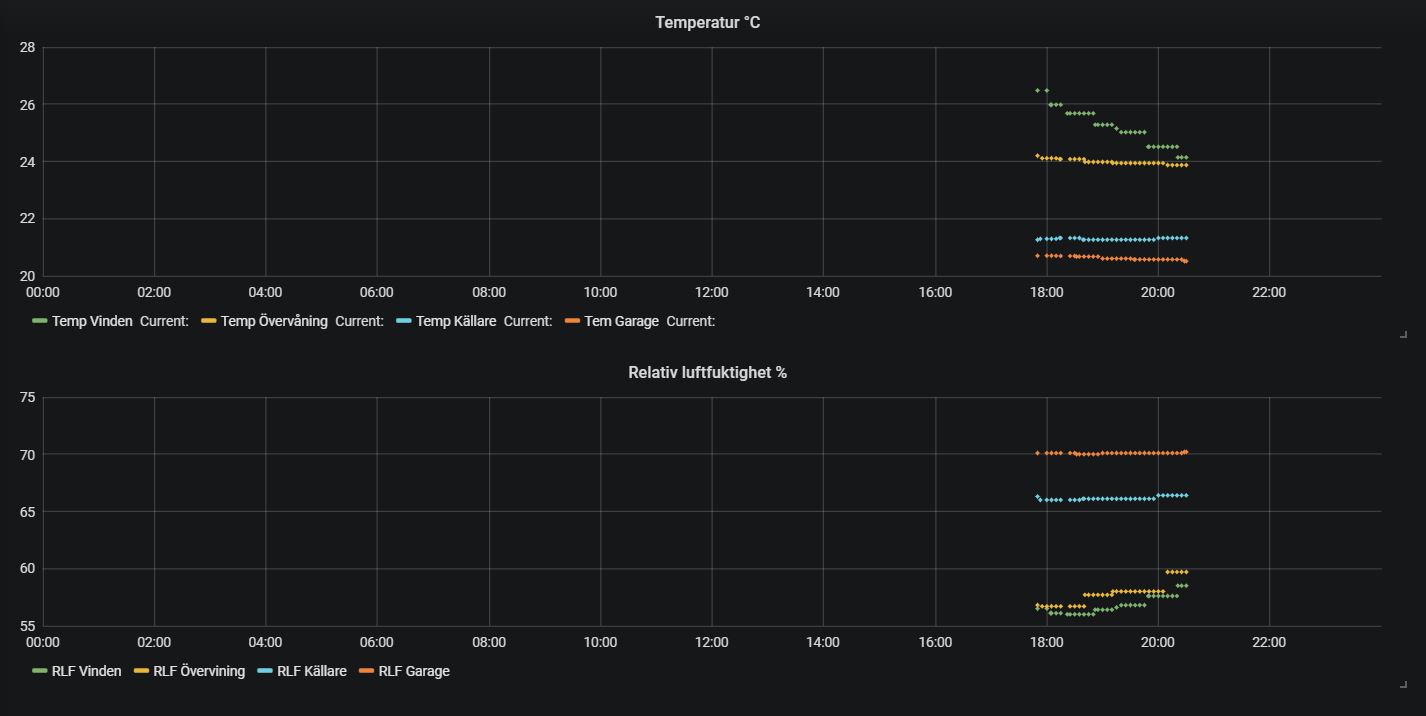
I would realy line this to monitor my hous wellbeing since I put temp/humidity sensors around the house.
1 Like
It could probably be done on a PI - with some serious throughput and events/sec limits. No compiled guide that I know of for that, but I would bet there are guides out there for each individual piece...
Doing it in Docker containers on something that is already on, like a NAS, is even better.
Hi, my programing skills are wery mundane but I managed to installed Influxdb and Grafan on my Rasberry Pi.
How do I get my values from the HE to Influxdb on the rasberry?
Tried to sweep the forums but could not find any useful info I could understand anyway...
This is the simplest method. The came from @codersaur's SmartApp on SmartThings. He is now a Hubitat user, so perhaps he might have something to add???
But be forewarned, some users believe this app leads to Hubitat Hub instability over time. YMMV! ![]()
An alternative is to use Node-Red to monitor the HE hub's Events webSocket, and then store data into InfluxDB. There a thread in this forum that outlines how users are accomplishing this.
Aah, ok, thanks for the headsup!
Maybe I will go the Node-red way, I don´t want to break the HE the first week 
Ok, I´m weak... @ogiewon
I installed the InfluxDB-Logger, typed im my crendentials in the Grafana program on my raspberry, like IP adress, name and password.
Is there something else I have to do? Because I got a "Network Error: Bad Gateway(502)" in Grafana.
Well, it sounds like you're missing InfluxDB, which is what the data gets written to... You've got some reading to do to figure out how to get everything set up. You may want to review the old ST instructions as a guideline for the steps involved.
1 Like
Glad you got it working so quickly! Enjoy the data!
So I find myself in exactly the same error
Network Error: Bad Gateway(502)
I am using Windows to run Influx and Grafana,
I have defined a database called Hubitat.
It looks like I am receiving data but I get the error above when trying to add a datastore.
When I issue 'show series' I get loads of data back.
Show stats shows this
name: database
tags: database=Hubitat
numMeasurements numSeries
6 31
But of course I can't create any graphs. I bet I am missing something obvious here!
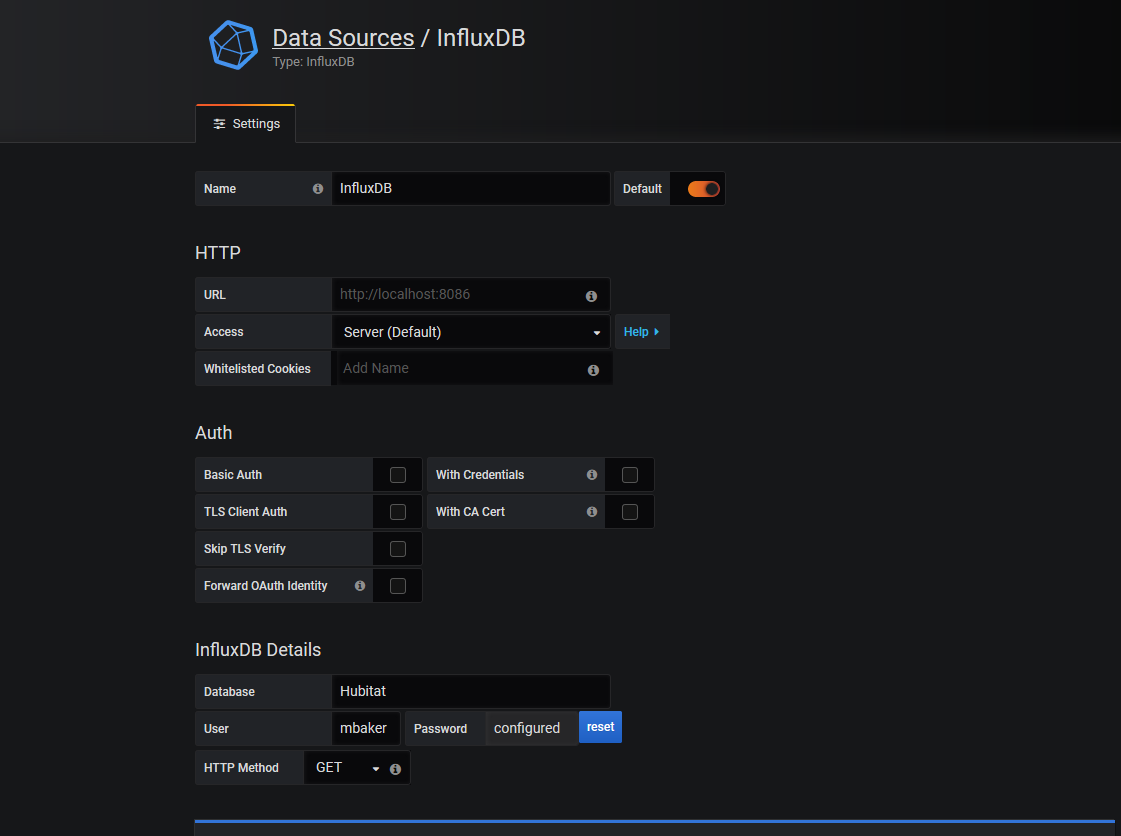
Try removing the username near the bottom of the Grafana Data Source config shown above. I just checked mine and it’s empty.
Also, fill in the URL field. I think yours may be empty.
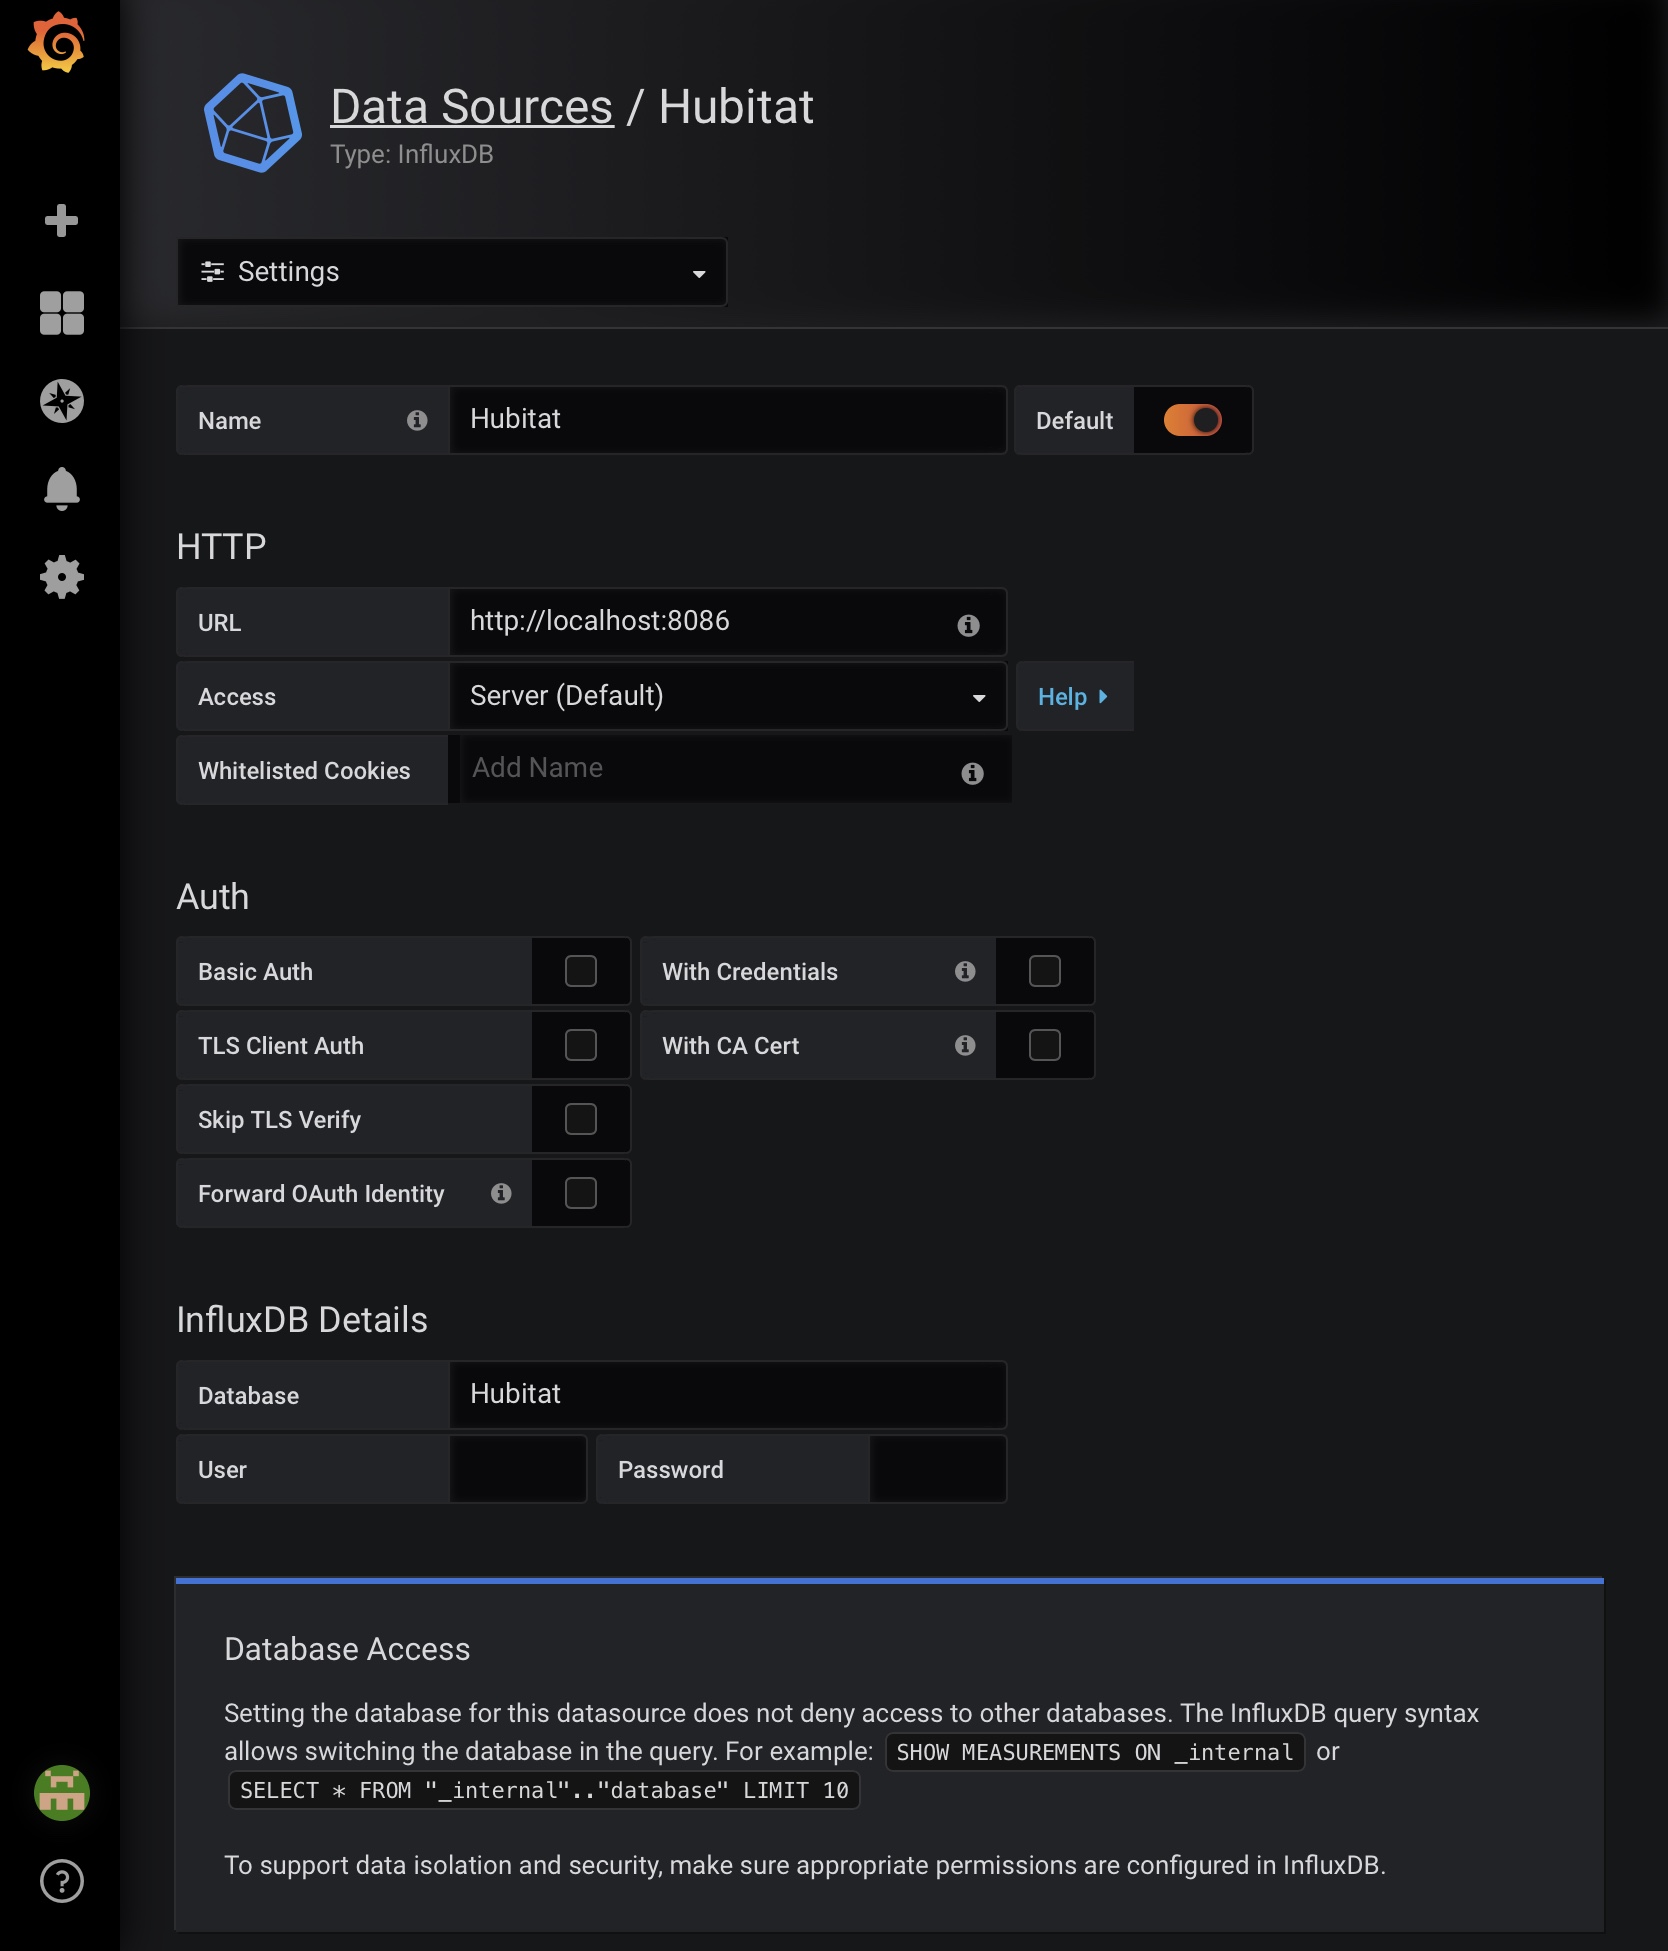
I popped in my url but it's really no different to localhost url(the original!) & this fixed it. Thanks. I work in networking and I would never have thought there was a difference!
I believe the original was just a sample, which is why it was faint.
I thought it was a default!
1 Like
All working now... this is so much better than what I was used to in Vera. Thanks!
1 Like

