Yeah, things look relatively boring...the two devices that are switching routes more frequently aren't going crazy or anything, but there is some route jumping around going on.
I have found Z-Wave locks will route change almost every time you use them. I have one of the Alfred locks and it does this along with my Yale. Seems to be mostly harmless, typically locks do not get tons of actions on them.
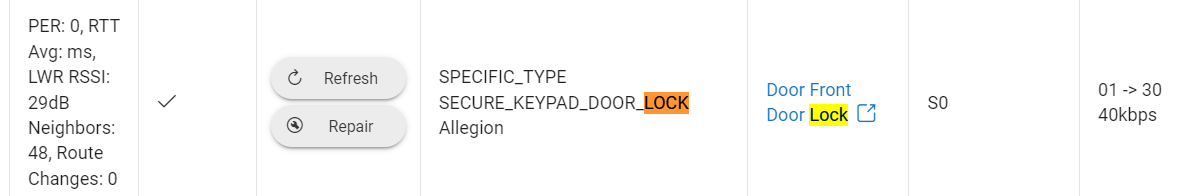
I don't have that issue, w/my Schlage Z-Wave (S0) lock...use it several times a day and it sits there happily w/no route changes. So its quieter for some reason...
Yours has no RTT value which is odd, if it has been used since reboot the RTT should be populated.
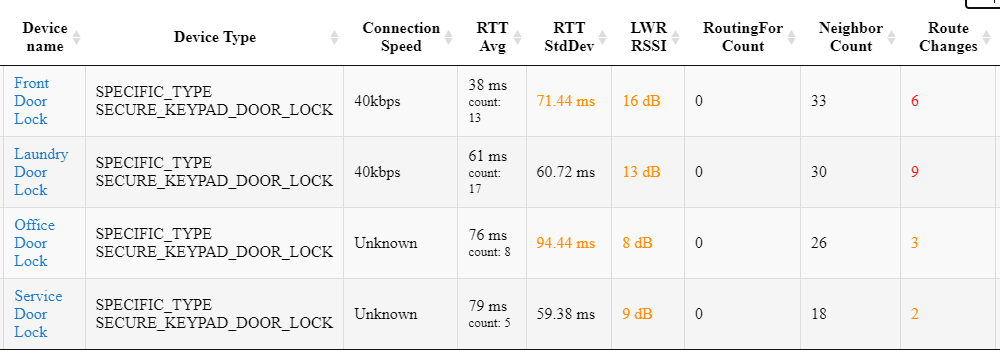
Below is what mine look like after rebooting this morning.
Office and Service doors rarely get used so the route changes are probably from sending battery reports.
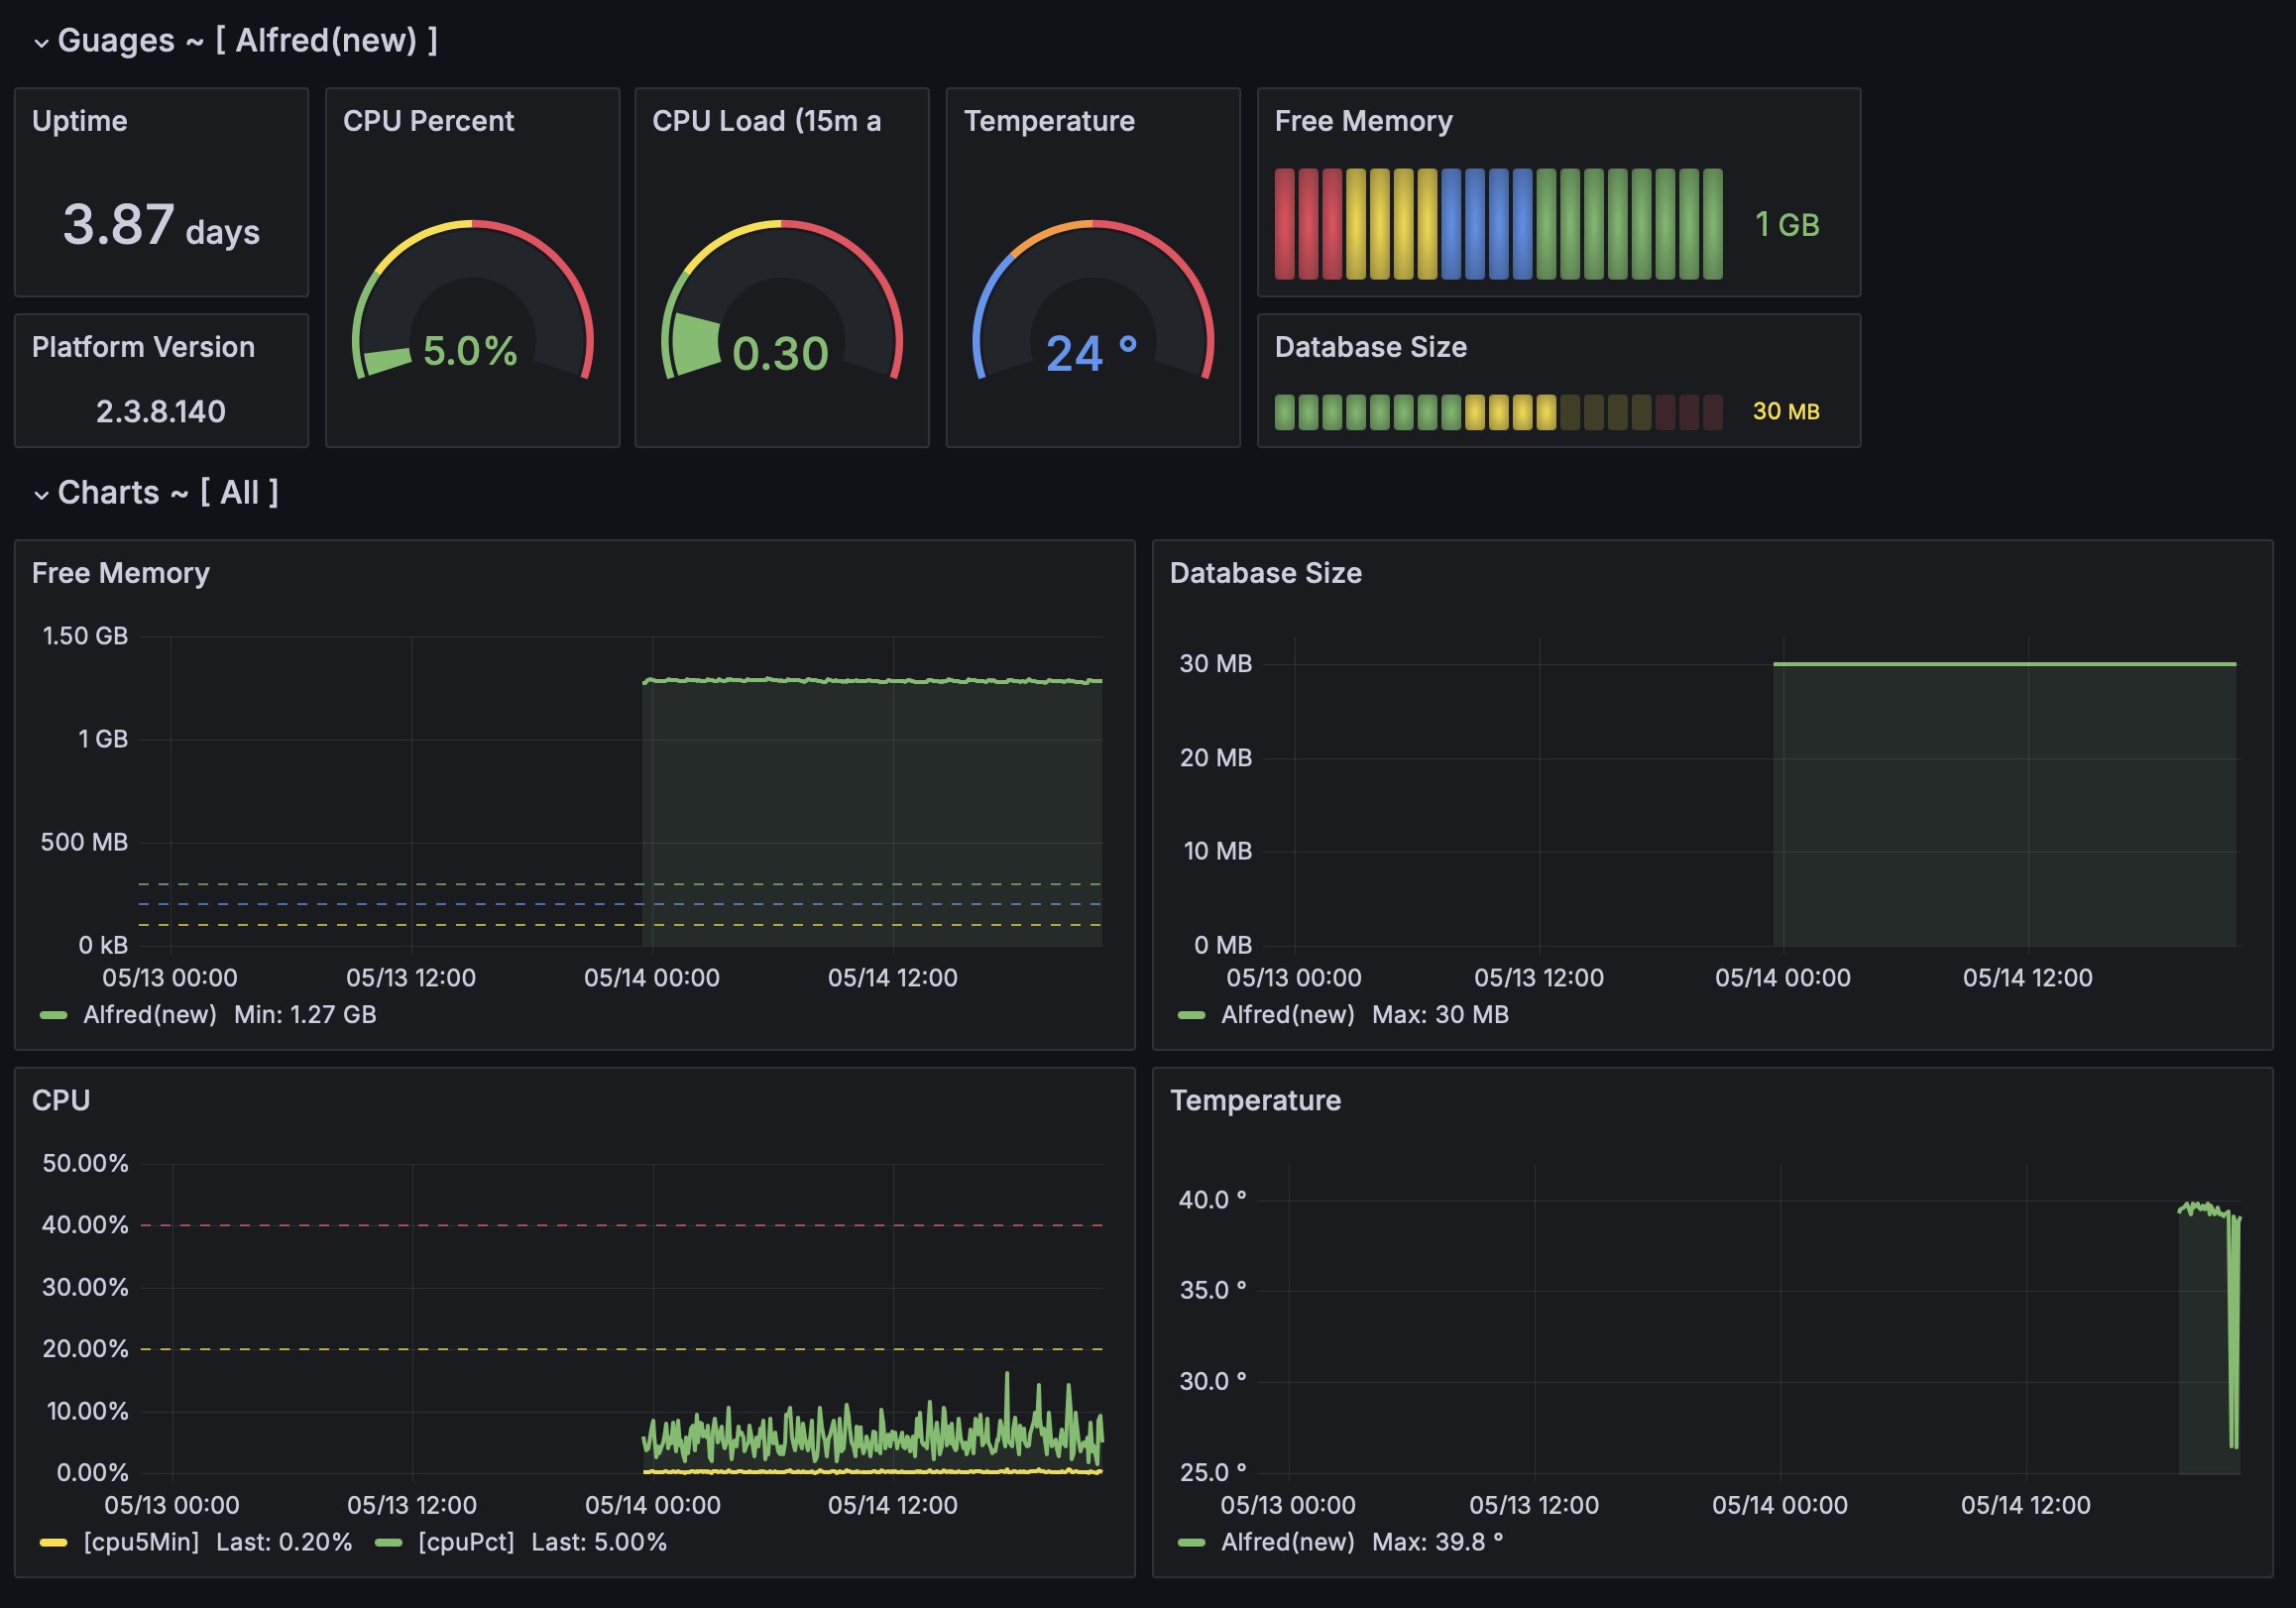
It was done with docker-compose. If it becomes repeatable this weekend, a new post will be created with it. Steps were basically docker-compose up, do initial Influxdb setup (uid/pwd/create bucket/optional app token), initial grafana setup (uid/pwd/influxdb connection), hub info v3 driver (was already installed), install InfluxLogger, and import dash board.
Yeah I started working on a compose file that would bring up both Influx and Grafana together already configured to talk to each other, but never finished it. There are ways to do it, was just getting to be a pain. That would be the ultimate easy setup.
Put the docker-compose.yml and other files right in the post
create a GitHub respoitory and point to it
Or attach the files to the post
Effectively there are four files, three empty directories, and only one file needs to be edited for the specifics: uid, pwd, token...
The docker-compose environment can come up with InfluxDB and Grafana is already connected, as well as HubInfo dashboard deployed.
This can mean once docker-compose is up, a user points HE's InfluxdbLogger to docker-compose's InfluxDB, goes to grafana and "instant" dashboard(s)... or at least that is the promise as tested on macOS and sinology NAS.
Please let me know your preferences.
PS. Telegraf for influxDB is also added in the case other data collection is desired