Wow, that's a lot of lines of code! How do I even start learning how to create a driver for a brand new unsupported product? How did you discover what all api etc are supported by this device?
This driver looks complicated, because there is a lot of code that is common between all my different new drivers and most of it is actually not used with the VINDSTYRKA.
To experiment with your own code, a good starting point are the sample drivers published by Hubitat in GitHub.
If you have a particular Zigbee device in mind, let me know and I can surely guide you.
My wish is to eventually try and create a driver for GeoDrops by Homedigy - How it Works, if and when they launch a public API. Nothing immediate though.
@ramset I have updated the third post with some links related to air quality topic. It will be an interesting project to find and implement an air quality index (AQI) in this driver, based on the raw data received from the Sensirion sensor data:
Technical Assistance Document for the Reporting of Daily Air Quality – the Air Quality Index (AQI) - (link)
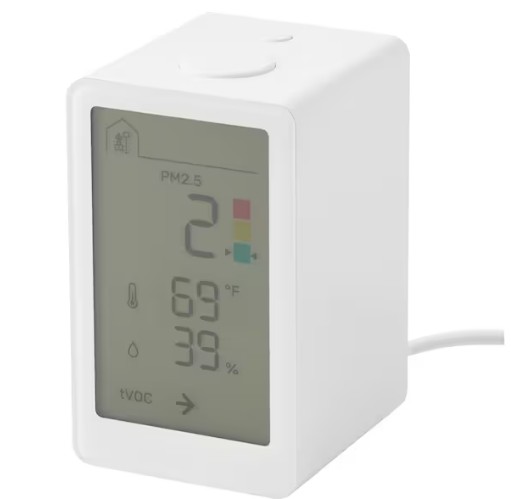
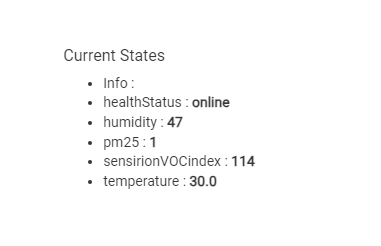
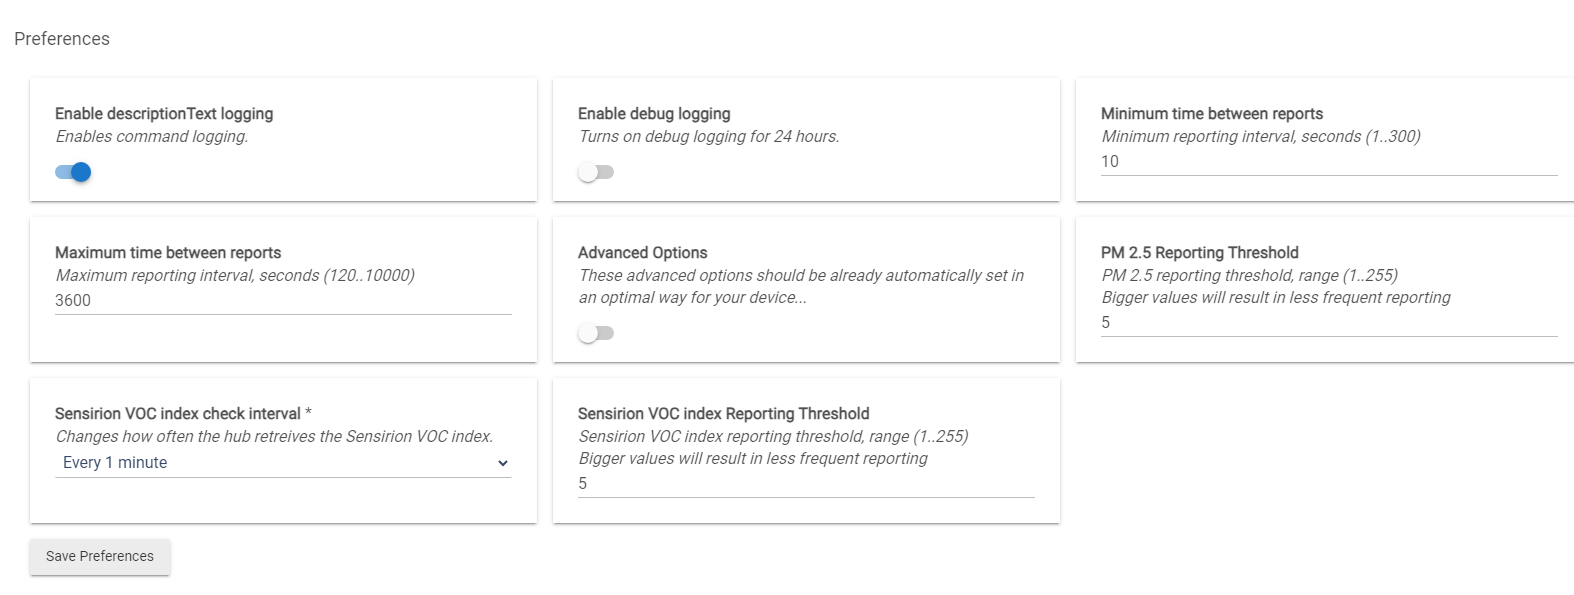
What we have at the moment as data is the PM 2.5, the temperature and humidity and the Sensirion index raw value.
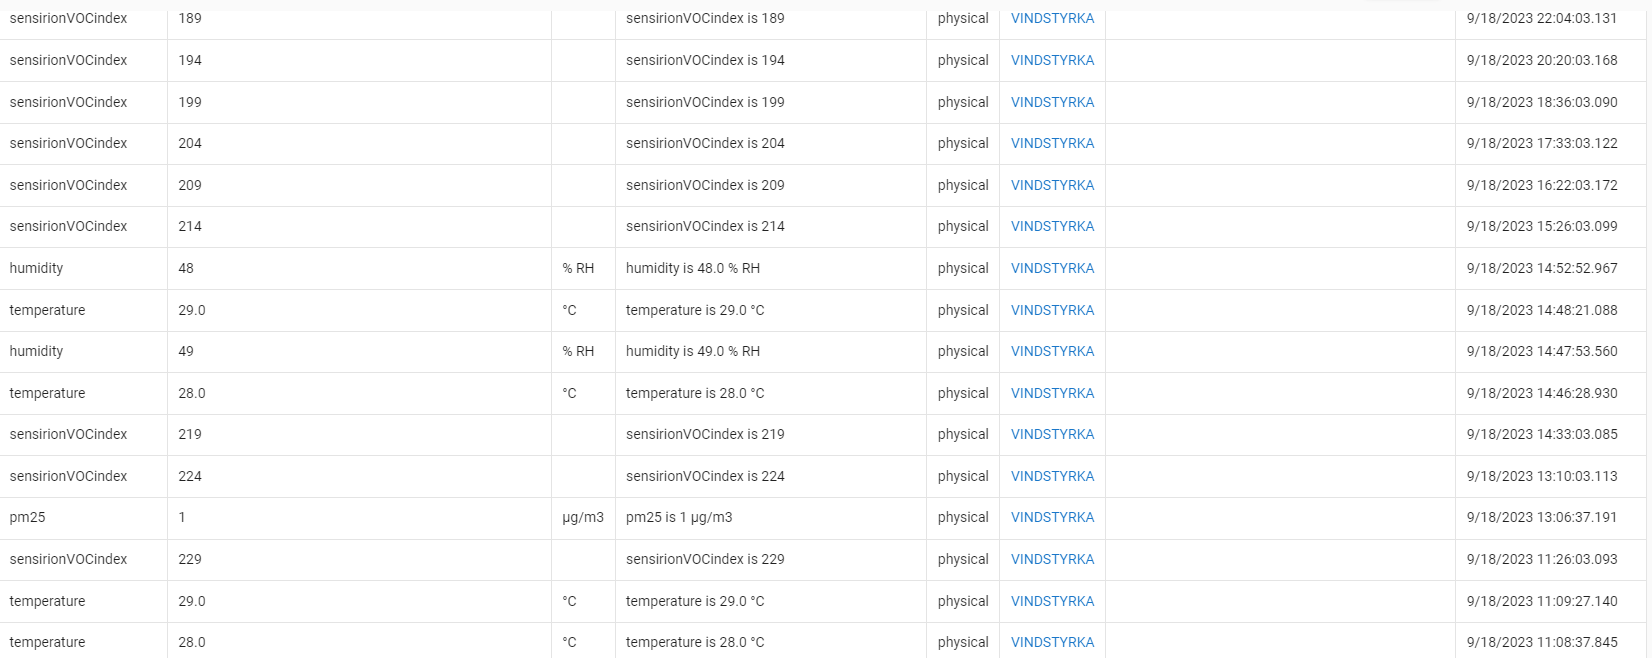
Looking at the irregular intervals that some of the parameters are reported, I think that it will be worth complicating the code a bit more ... There is a parameter 'Maximum Time Between Reports' which is honored by some Zigbee devices but ignored by others, this one included.
So the 'force reporting' logic could be : for each attribute , if there was no change in the value above the configured threshold in the last NNN minutes/hours - send the last known value in a new event, so that the events history is easier to read ... and this makes much better graphs, of course.
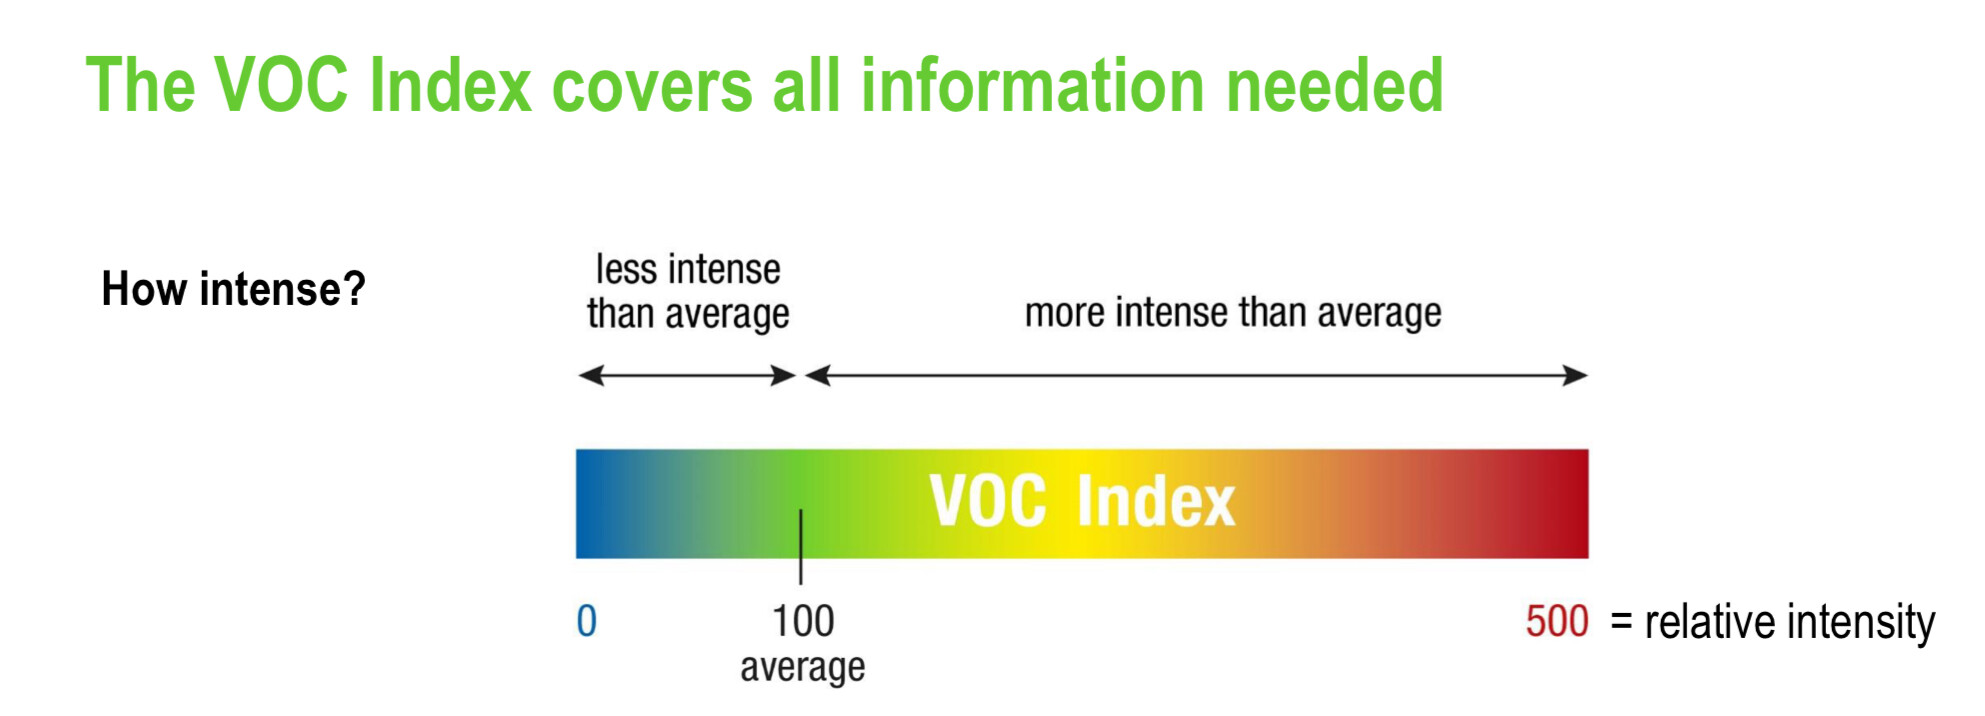
So, considering the sensirionVOCindex is from 1 to 500 as based per their manuals, one can implement a 5 level breakdown by “severity” with max threshold per level at a round hundred.
Converting PM 25 to AQI is a pretty straightforward linear mapping. I have an implementation of the mapping code used by the EPA's AirNow site in my Purple Air AQI driver if you want to take a look.
Low quality detectors tend to overcount the particles though, I just added a conversion to my driver over the weekend that the EPA uses to get a more accurate reading from the Purple Air devices.
@pfmiller thank you for the hints. However, I still struggle to understand how to account both the pm2.5 and the senserionVOCindex data into a common airQualityIndex value.
The sensirion sensor raw data in the range 0..500 seems to provide a relative value, averaging last 24 hours measurements centered around 100.
This sensor provides what it provides and trying to turn the proprietary value into a standard value probably won't ever truly be correct. I think you did the right thing changing the name and just leave it at that.
Good point, didn't notice that you were trying to combine both data points into a single AQI. What I would do is definitely provide the individual data AQI and VOC Index attributes, and then maybe a combined one which is something like (AQI+(VOC/2))/2 just an average of the two. It seems like 100 on the VOC scale is about equivalent to 50 on the AQI scale.
Anyway, thanks for this driver! I'm definitely going to pick up some of these IKEA sensors at some point.
You need to read the sensor PDF where it explains how the voc sensor works. The numbers it reports are not absolute in any way. They explain it's like a human nose where you can get used to a smell, but if it's worse or better, you notice. It has a baseline that it calculates from the previous 24hrs and that is 100. If it get's better, the number is lower, if it gets worse, the number goes higher (up to 500). But 100 in my house isn't the same as 100 in your house. If you had a perfectly sealed box and put one of these in it, according to their docs, it should report 100 constantly. You could put it in super clean air and after a day it would 100, you could put it in with swamp gas and all sorts of awful ■■■■ and after a day it would report 100 (again, according to how their docs describe how it functions). So it's really only useful for determining if things are better or worse than usual, with usual being the previous day.