[RELEASE] Hub Watchdog - Simple way to monitor if your hub is slowing down or not

Oh. That's a shame. I did get the odd 1024 warning very occasionally but just ignored it as I was well aware of the cause and the fact that it has no impact.

Would it be at all possible to make this somehow configurable?
I would like more data points if possible but fully understand if you wish to leave as is.
Maybe give us an idea if there are lines in the code we could tweak and on our heads so be it.

I fully understand if you tell me to put this request where the sun doesn't shine. :slight_smile:

This app is a fantastic tool. However now I'm really pissed off that the hub is slowing down so often. Before I knew it was slow when the light didn't come on and I fell down the stairs, now I have the data, before I only had bruises.
The 2 test devices are physically line of sight, in the same room as the hub. They should never have released the C7, before fixing the slowdown issues with existing hubs.
09-03 11:50 - 0.722 Zwav
09-03 11:49 - 0.665 Zwav
09-03 11:48 - 0.754 Zwav
09-03 11:46 - 2.38 Zwav
09-02 23:27 - 0.957 - Zwav
09-02 23:26 - 0.718 - Zwav
09-02 23:25 - 0.758 - Zwav
09-02 23:24 - 0.755 - Zwav
09-02 22:39 - 10.295 - Zwav
09-02 22:28 - 12.387 - Zwav
09-02 22:26 - 0.717 - Zwav
09-02 22:25 - 0.782 - Zwav
09-02 22:24 - 1.532 - Zwav
09-02 21:39 - 0.807 - Zwav
09-02 21:25 - 0.862 - Zwav
09-02 21:24 - 1.075 - Zwav

So how to diagnose slow downs:

  • odds are these are running out of memory. In another thread there is a discussion on how to see the hub's memory status (if running current version of FW)
    [Wiki] Hidden Features

  • so what can you do about it?

    • assuming you are running current firmware (that has the most fixes for any memory leaks):
    • you can try to reduce apps and their use of memory
    • this might be reduce how frequently they run (and therefore how much they try to store in state / settings variables
    • weather apps have been notorious memory, events, and DB hogs
    • this might be uninstalling apps things, (which I know may be painful)

In general

  • the Hub has a fixed amount of memory (today's total is 1GB for OS, JVMs, etc)
    • I'm sure HE will offer us a hub with more memory one day
  • anyone can run it out by just keep installing more and more things
  • the database can be a big consumer of resources, so reducing the number of events it stores reduces the amount of memory it needs - this has been my first go-to to get more available memory.
  • app writers can try to be more memory and db friendly, but this another whole discussion on tricks for this
  • you can see 'some' of the memory an app uses by looking at settings, state, events for an app or driver. This is in the 'gear' icon next to the app or device (HE console -> apps, HE console -> devices)
3 Likes

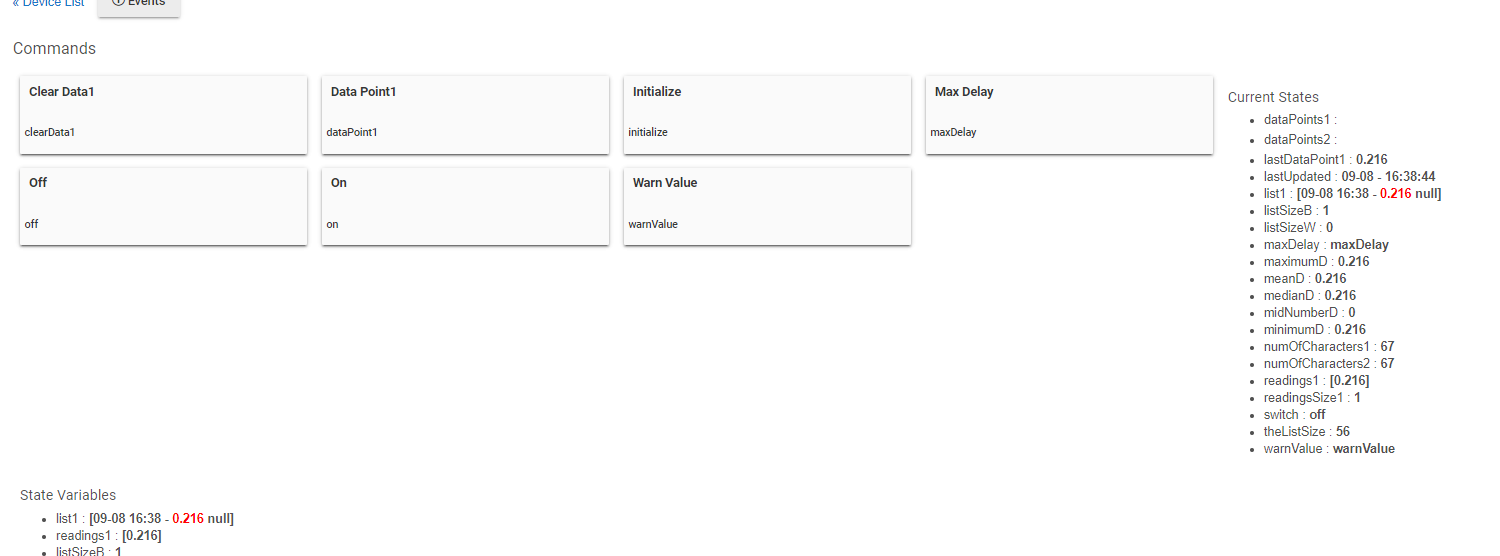
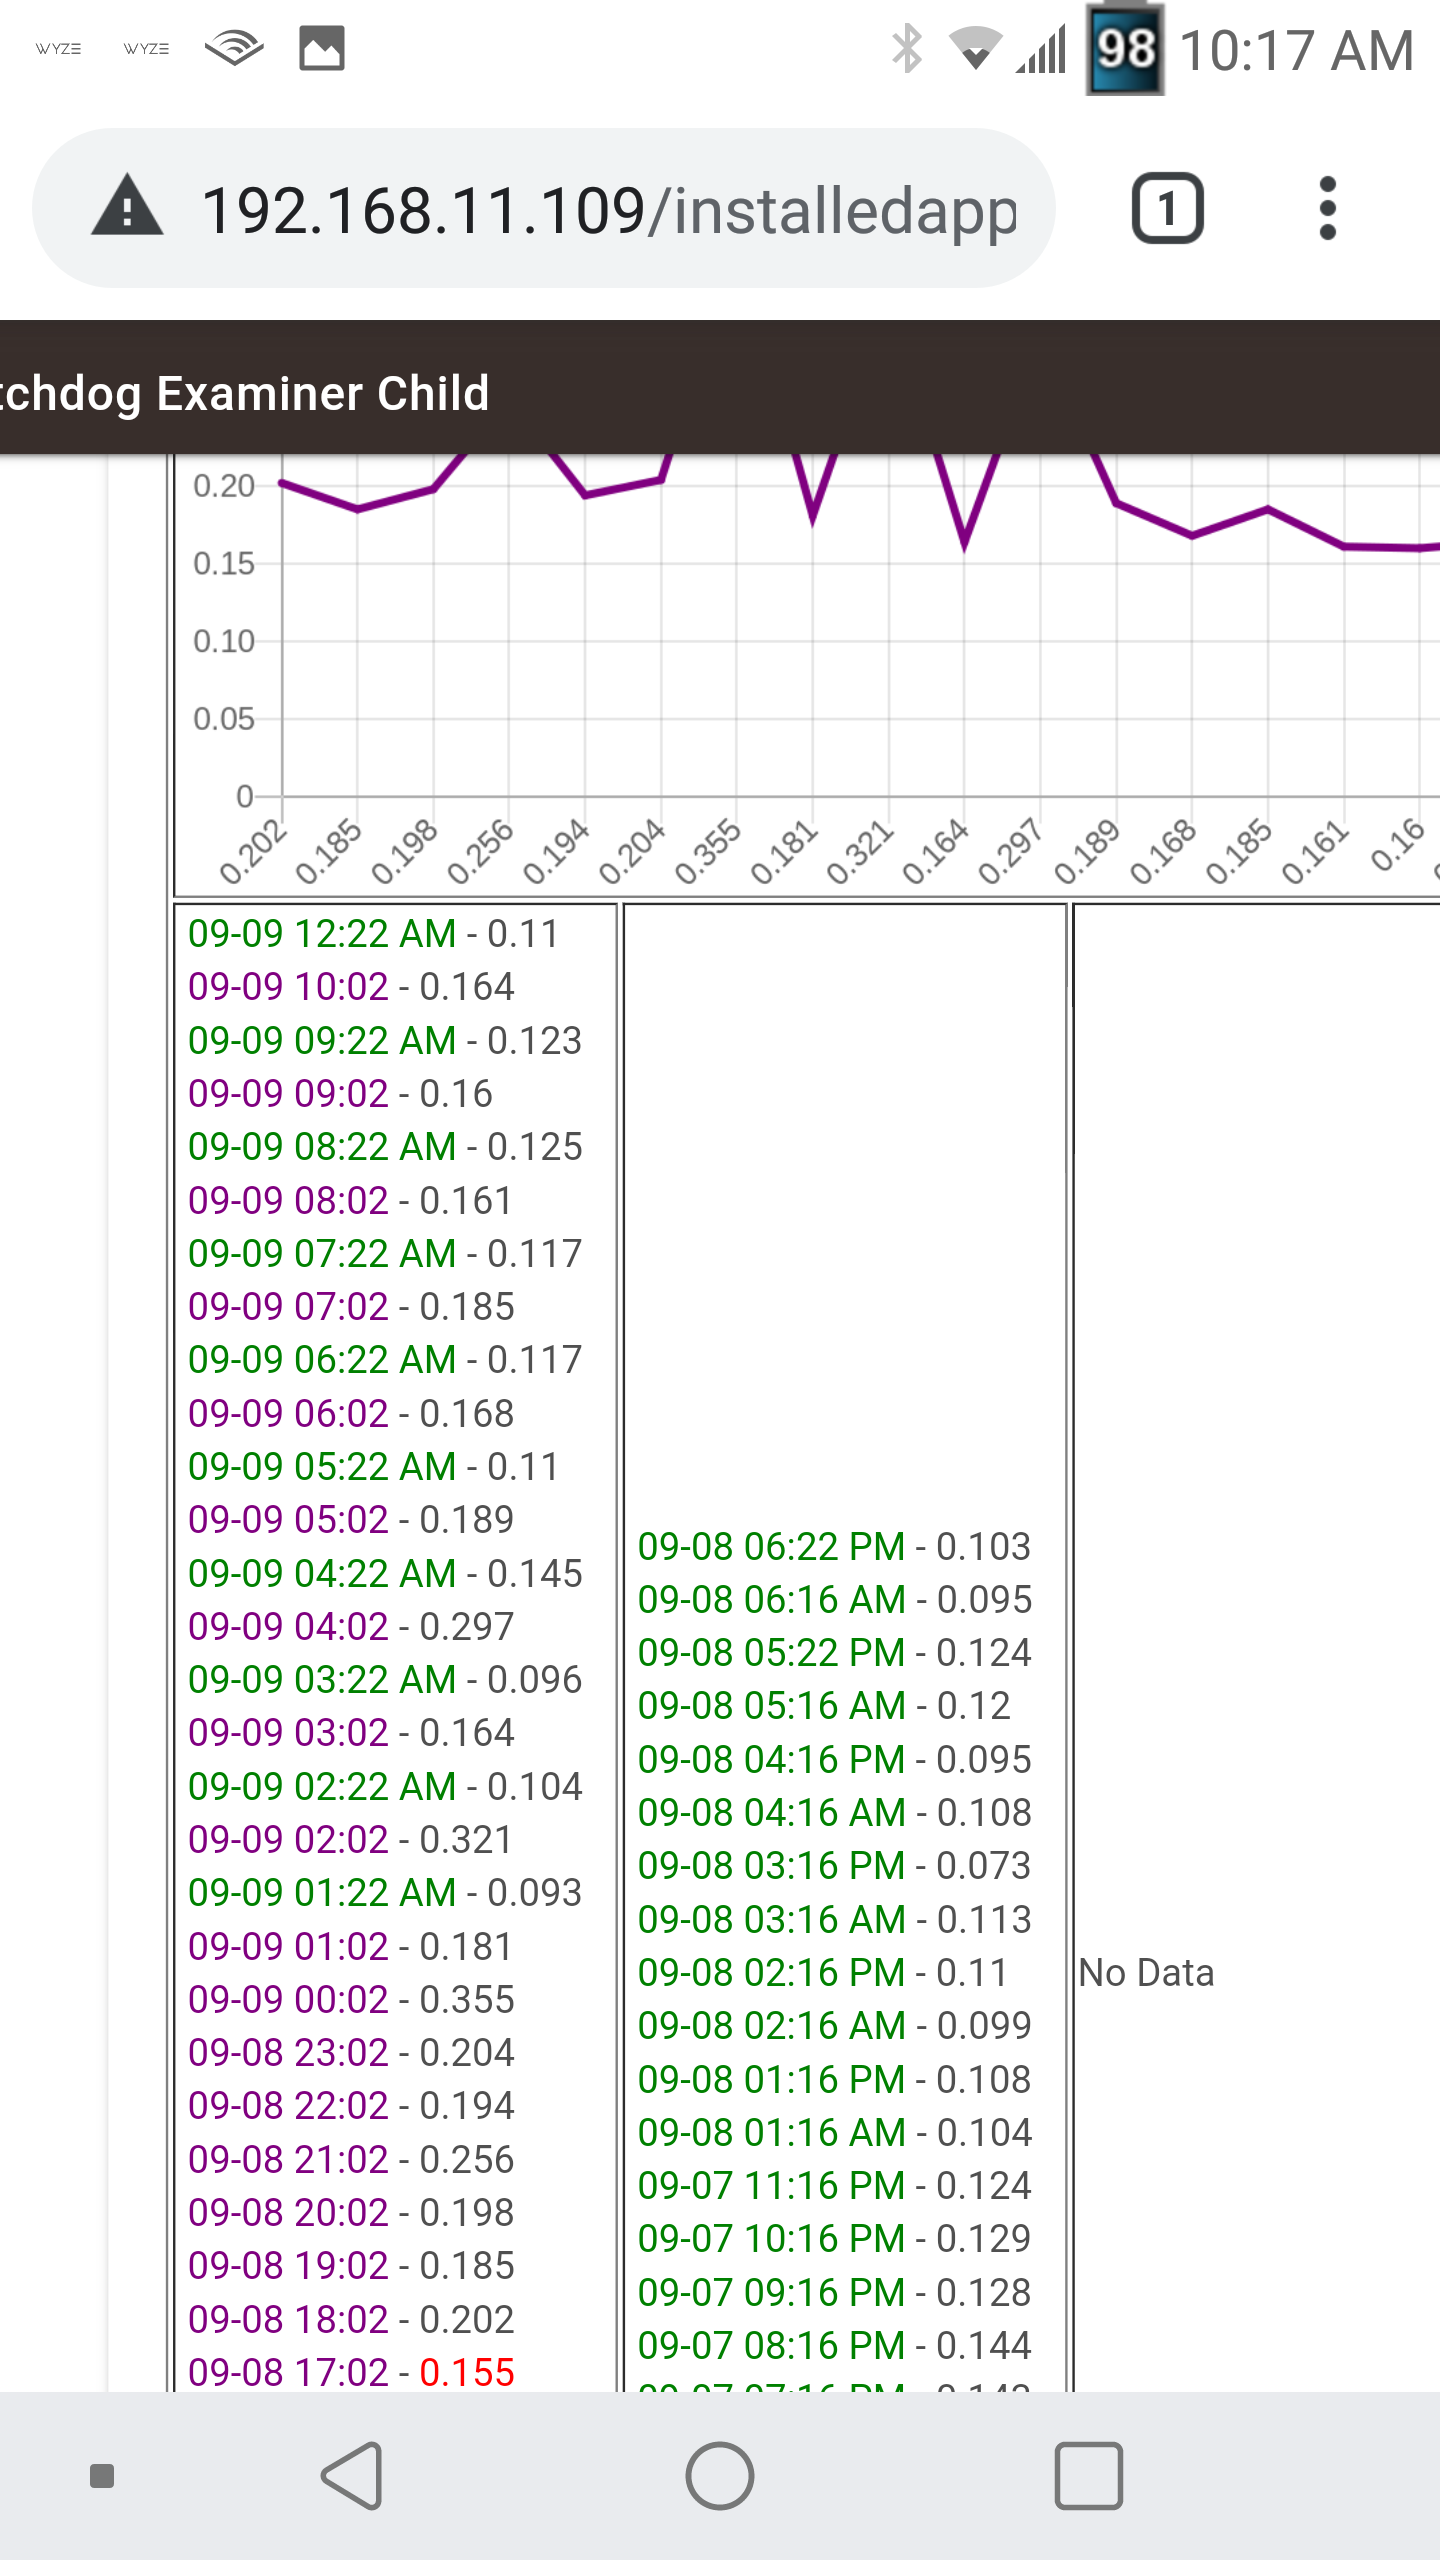
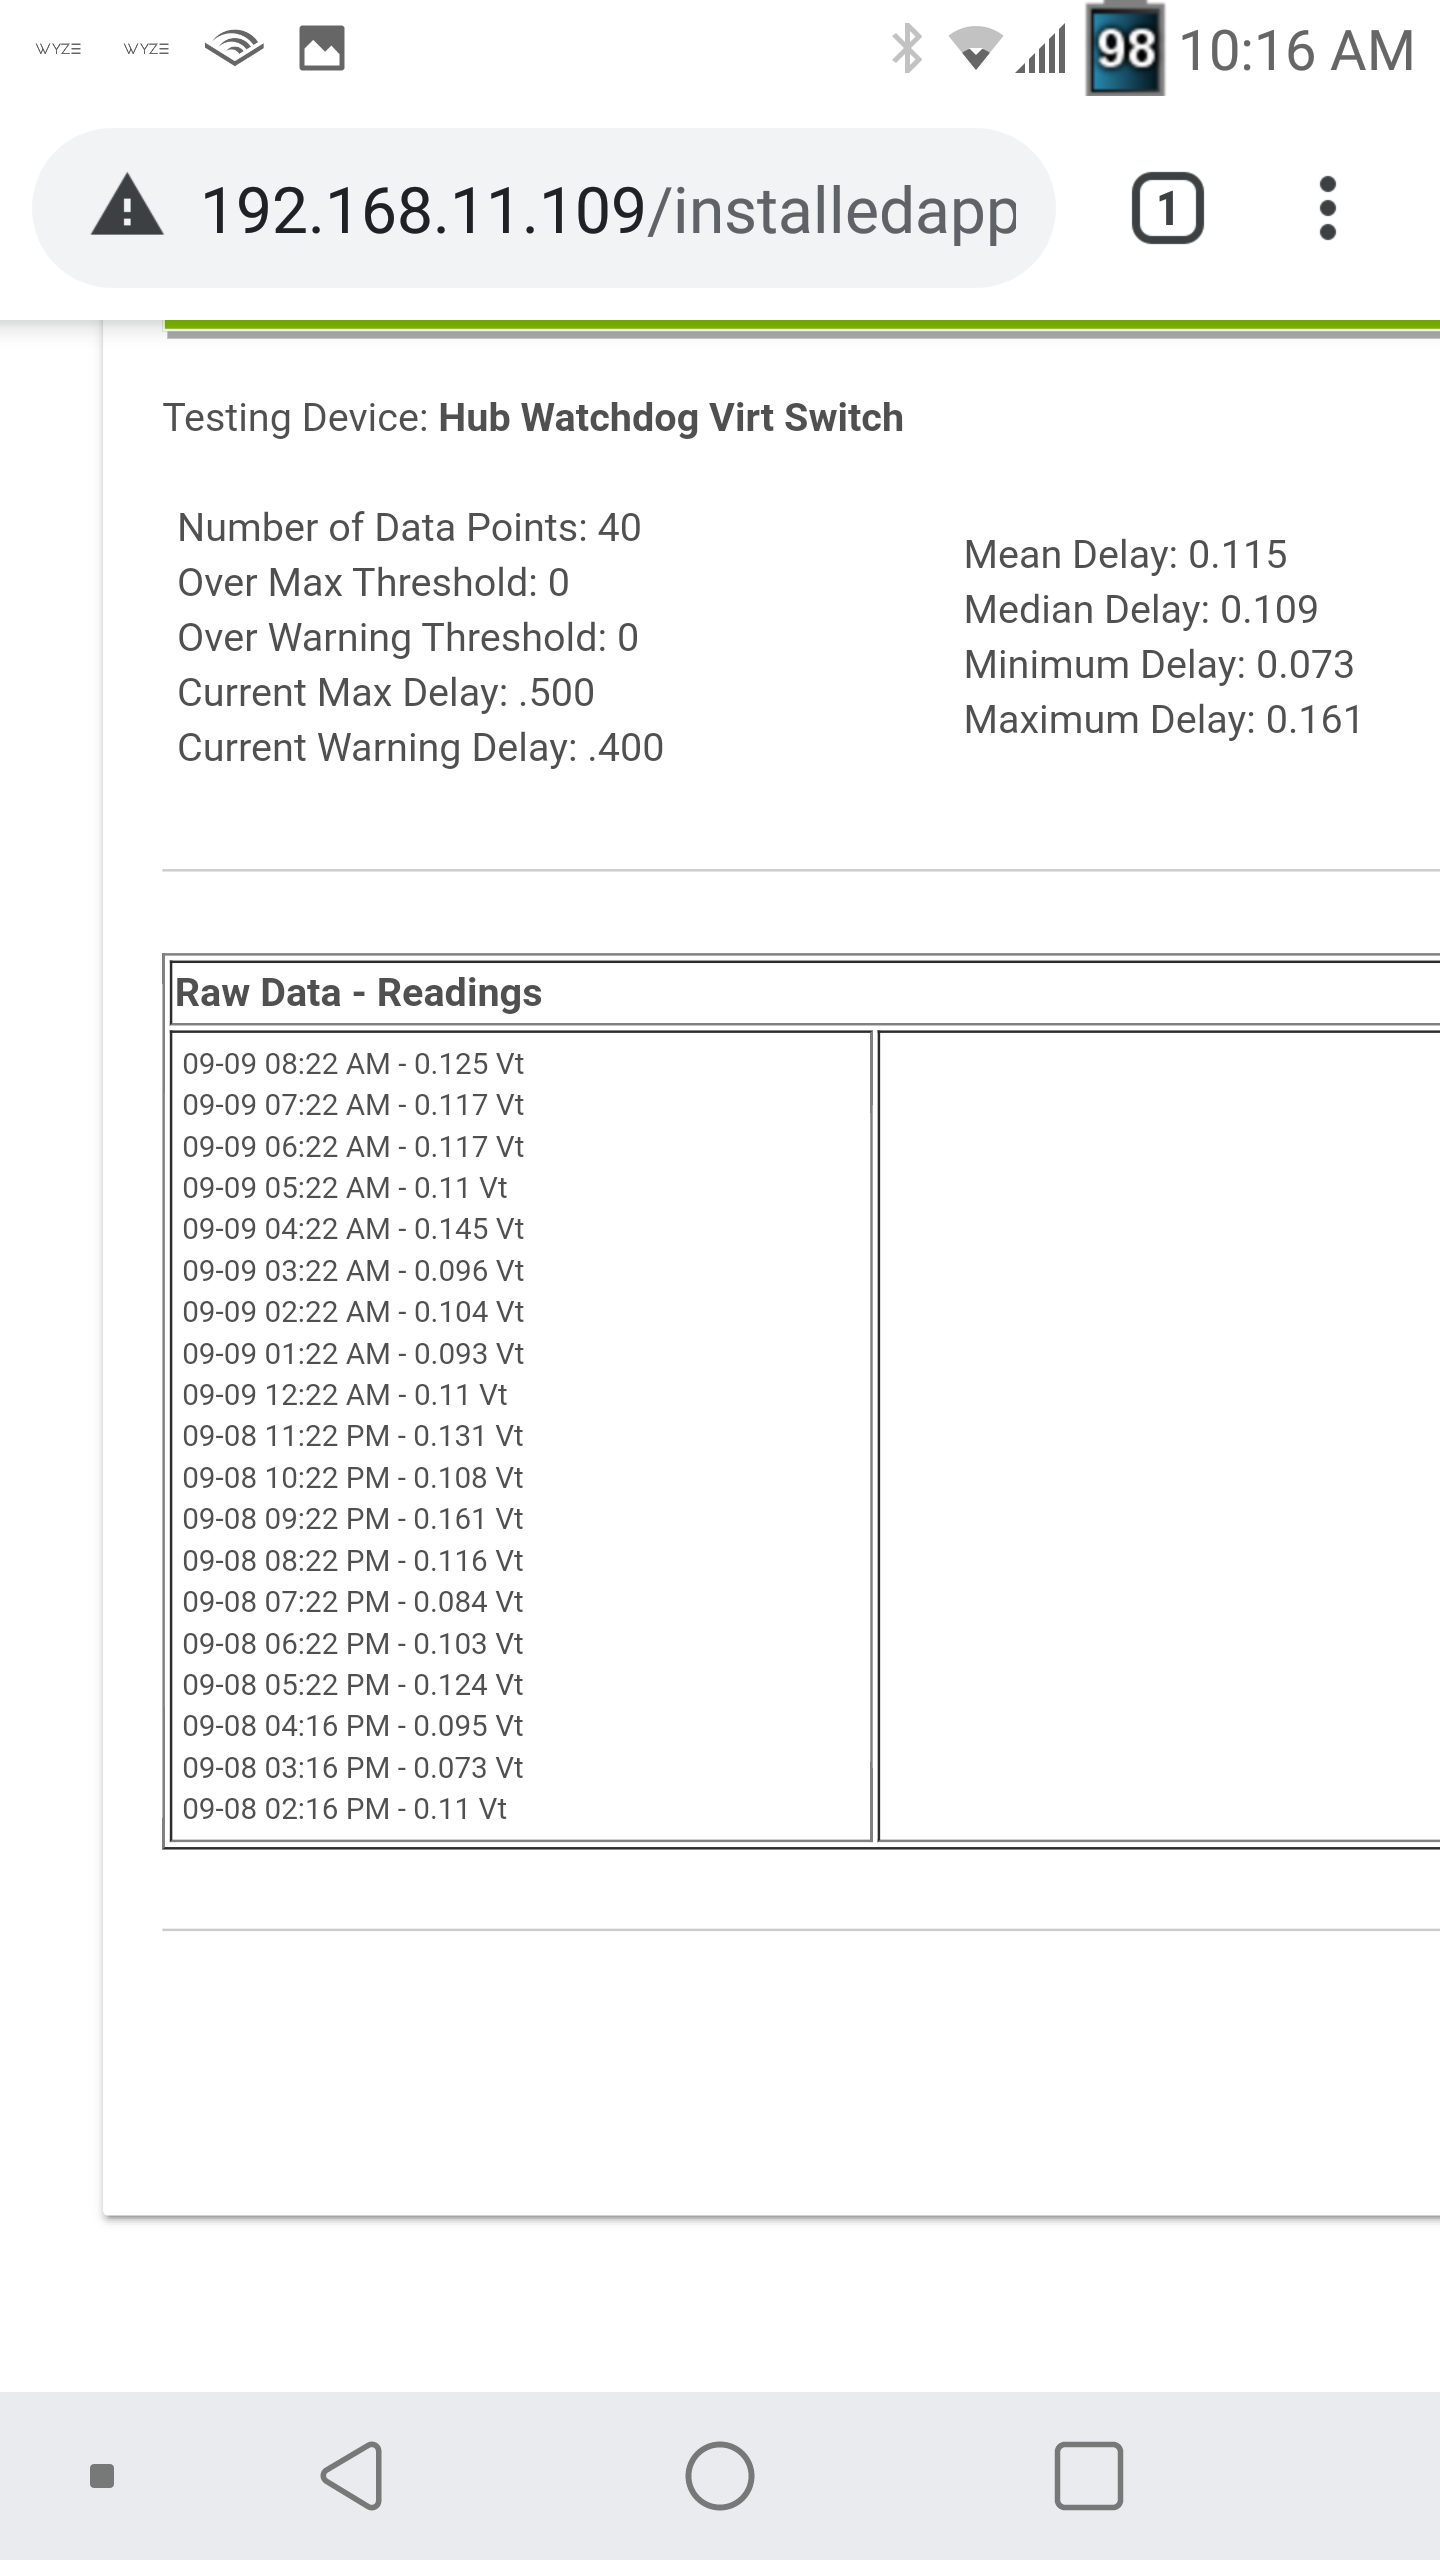
So, ever since the update to Hub v2.2.3, my virtual device has been throwing occasional values that seem like they are the correct value + 5 s. For example my readings1 values are :
0.078, 0.099, 0.076, 0.136, 0.09, 0.133, 0.098, 0.111, 0.087, 0.104, 0.07, 0.095, 0.1, 0.111, 0.102, 0.106, 0.108, 0.107, 0.092, 0.082, 0.142, 5.171, 0.114, 0.1, 0.201, 0.082, 0.078, 0.067, 0.088, 0.09, 0.085, 0.109, 0.089, 0.11, 0.09, 0.112, 0.09, 0.084, 0.094, 0.085, 0.097, 0.112, 0.084, 0.108, 0.094, 0.116, 0.087, 0.085, 0.091, 0.153, 0.072, 5.171, 0.106, 0.104, 5.143, 0.112, 0.101, 0.069, 0.097, 0.122, 0.109, 0.103, 5.167, 0.091, 0.109, 0.1, 0.091, 0.092, 0.083, 0.12, 0.1, 0.099, 0.116, 0.095, 0.109, 0.101, 5.134, 0.14, 0.103, 0.219

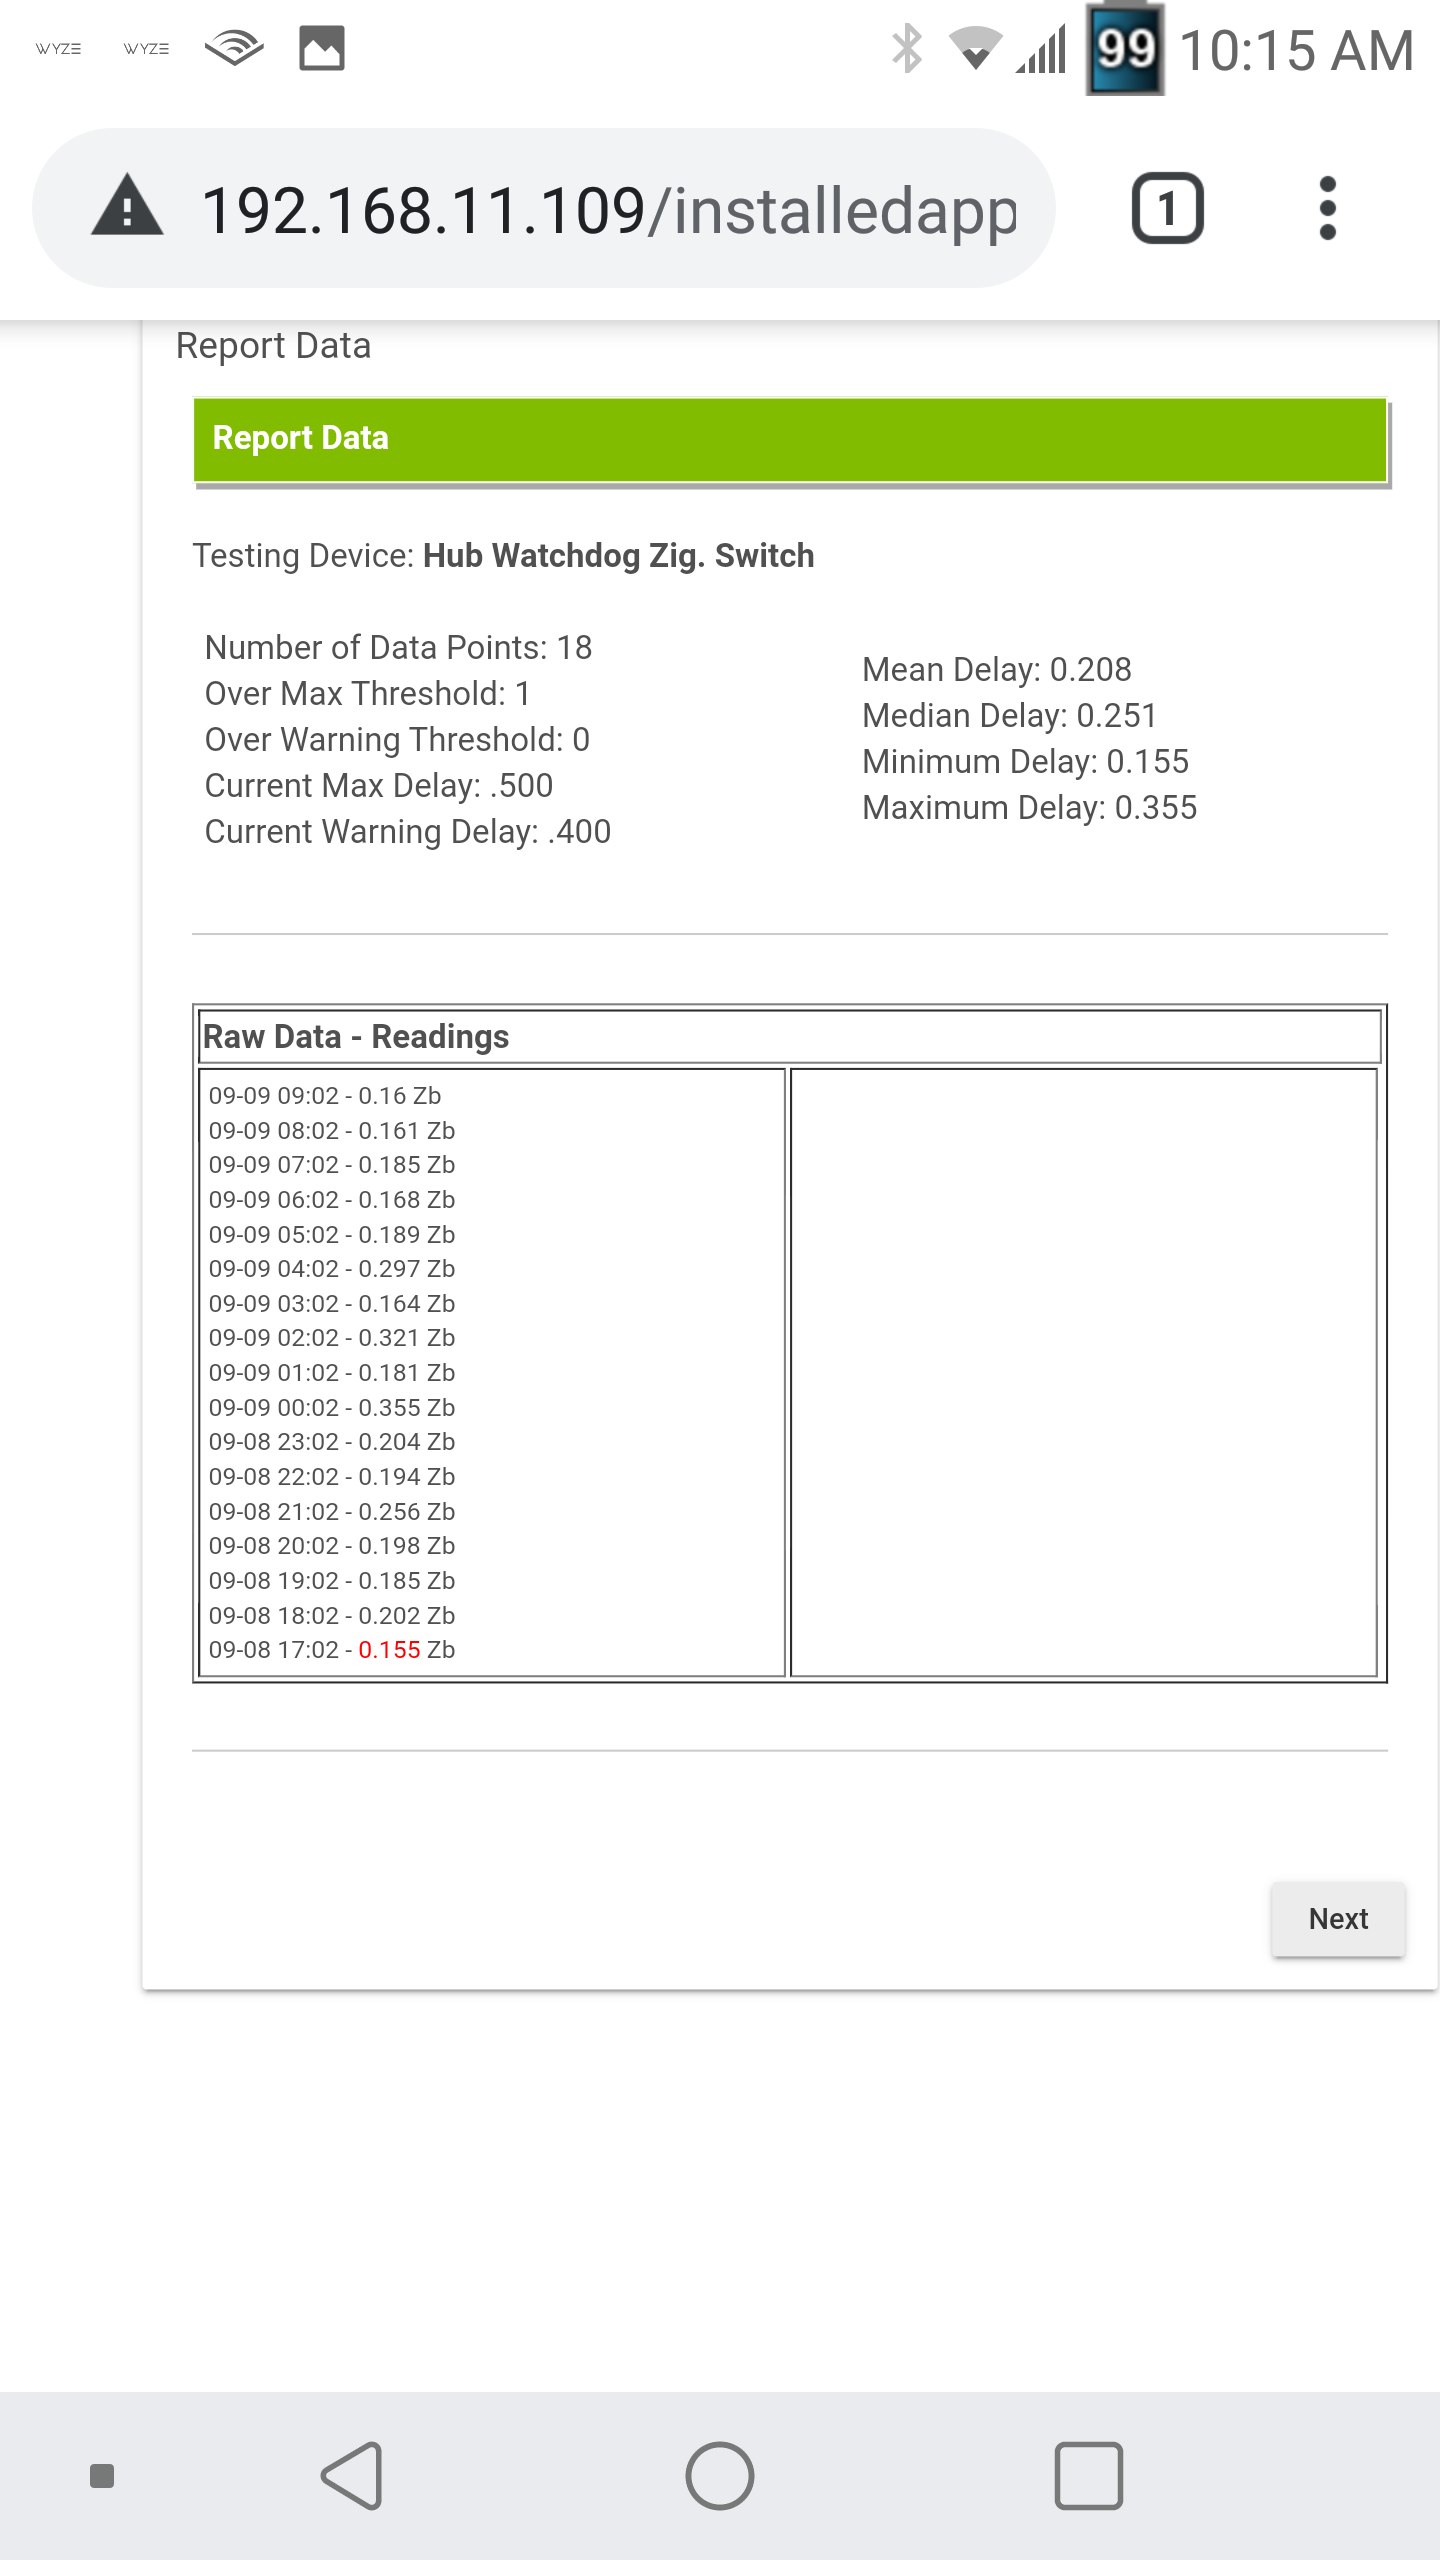
The next point is a quick test to make sure it's actually slowing down, and that goes back to being about a tenth of a second.

I saw something in the code about waiting up to 5 s and then giving up (I looked a bit ago, maybe last week). I'm guessing that's happening for some reason, but I am not sure why.

Does this happen to anyone else? Is there anything I can do to fix that?

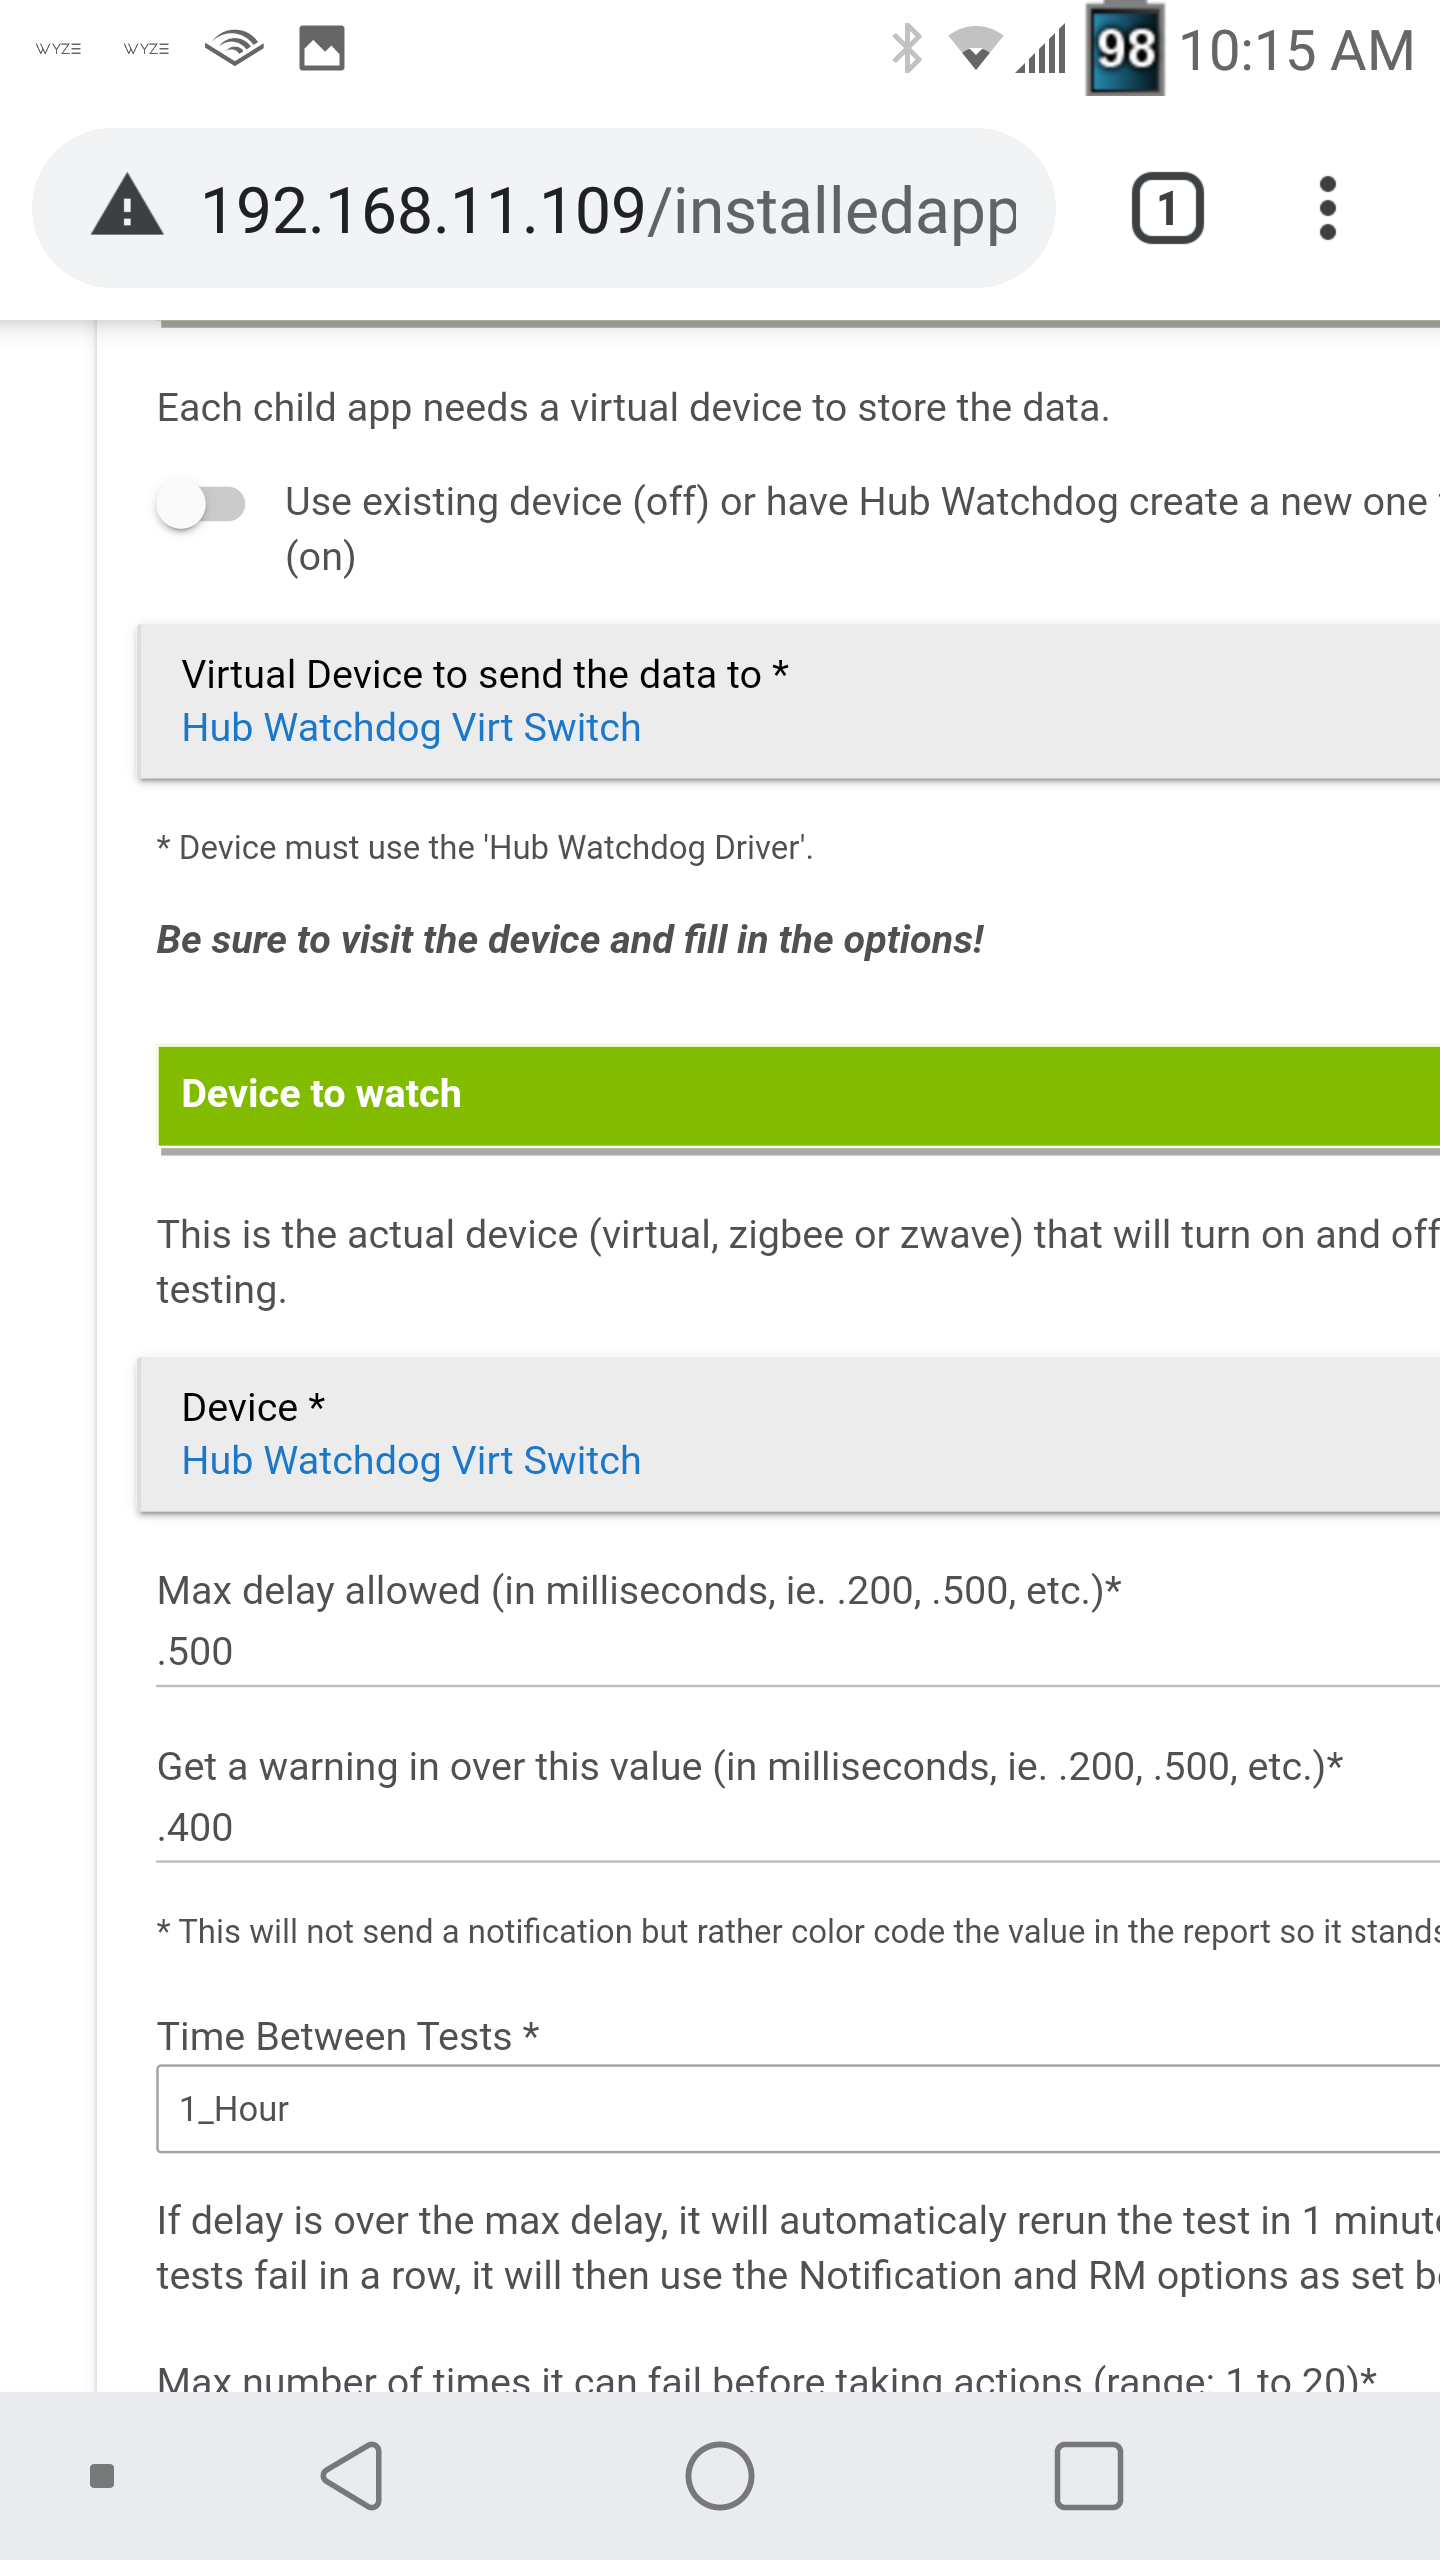
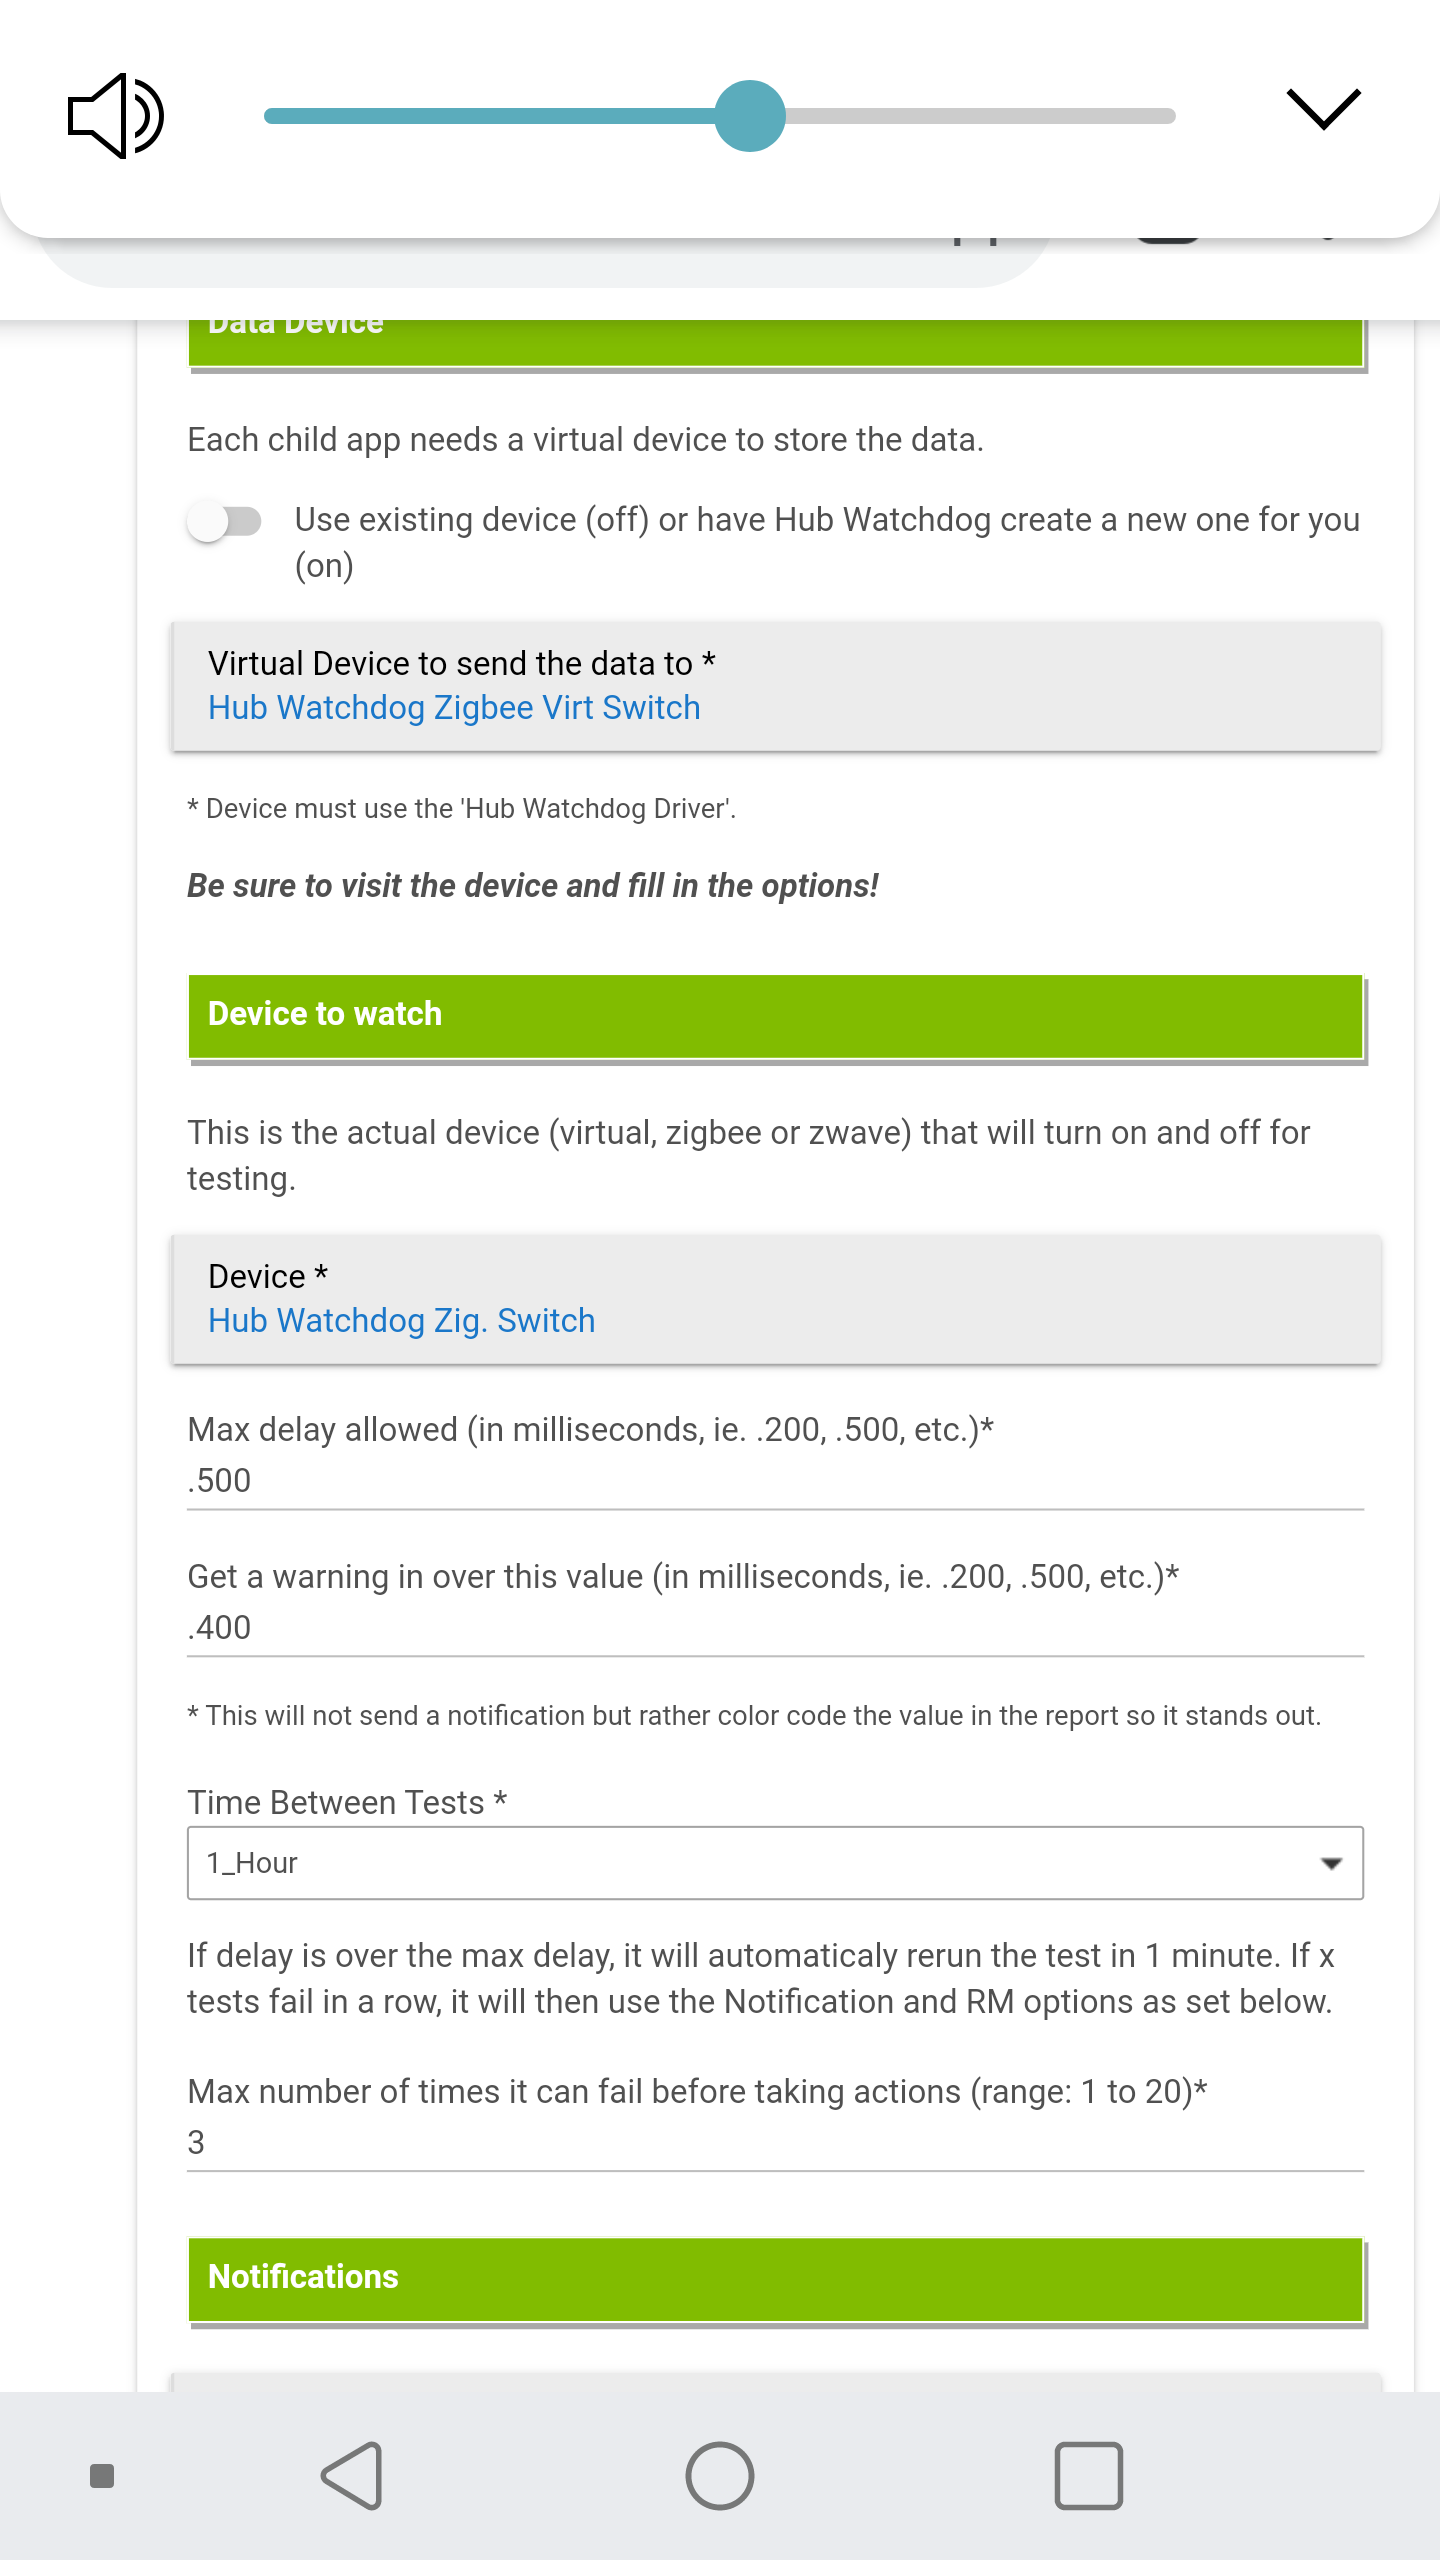
I haven't looked at logs yet, as I know it's set to re-test after a minute (I have max number of fails set to 3 before notifying me), so it doesn't really bother me. Just wondering if I should look into why that is happening on my hub, or if that's just normal behavior. A minute later, I'm back to about a tenth of a second, so no notification/action.

My hubs are having the same issue since 2.2.3 was installed. I believe others have also reported seeing this in other threads. I haven’t noticed any slowdowns with the hubs other than what watchdog reports so I haven’t actively troubleshot the issue myself.

Thanks, I wondered if it was a new feature...

I'm not worried about it either, so I'm just going to live with the spikes. I have a plot on my dashboard of the last 24 h of readings, and it shows the range and last reading. it's often off-scale with 5+ s for upper range, but I also haven't seen any slowdown issues, so I'm going to ignore it. I may get rid of the plot, anyway, so no big deal.

How do i set the warn and maxvalue in the driver.. the current driver seems to not allow me to enter a number and only sets them to the words..

ie

You set both in the app.

1 Like

got ya it update eventually.. I went through the whole post.. but cannot find docs on what the reporting child is for.. thanks

lol, you got the wrong developer if you want docs. This is for fun, not a job. :wink:

Follow the prompts within the app and it'll all work out.

What's a 'reporting child'? If you mean the device, it's to hold the data for the Examiner child app.

1 Like

ya what is the hub watchdog examiner child app. i have not set one up..

It's used to compare the data between devices. (virtual, zwave, zigbee)

1 Like

Unless I'm missing something the reporting is backwards the virtual switch has been running longer 40 data pts vs 18 for the zigbee one I set up yesterday. Seems correct in the chart but backwards in the detail report?

Other than dropping from 80 data points down to 40 per device (see discussion above - I'm not going back into that), reporting hasn't changed since this was first created.

Ya what I see in the chart is the chart looks backwards the purple is the zigbee with less data points but purple is showing on the vt chart instead of the zigbeeb chart

I keep seeing this red blip on my data points and noticed that it occurs at the top of the hour every time... then I remembered I have my Full Kiosk refreshing every hour when there's motion in the area. :face_with_symbols_over_mouth:

image

Seen a couple people having issues with FK. One user it completely locks up their hub.

Hmm, it wasn't my FK refresh that was causing it, something else is. I will have to watch the logs at that time period to see what's doing it.

Depending on which firmware I believe there is database cleanup once an hour as well as hourly zwave repair -

Ah, I haven't read anything about hourly database cleanup, I'm on a C7 with .145. I pulled up my past logs and there was nothing that stood out of the normal during the time frame where it has been spiking.