im having trouble with the hub watchdog reporting child..
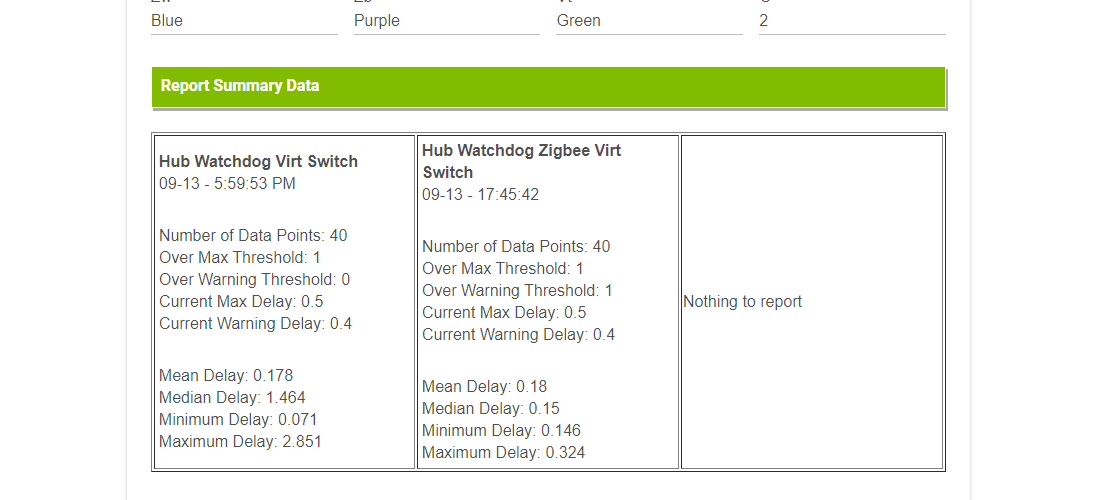
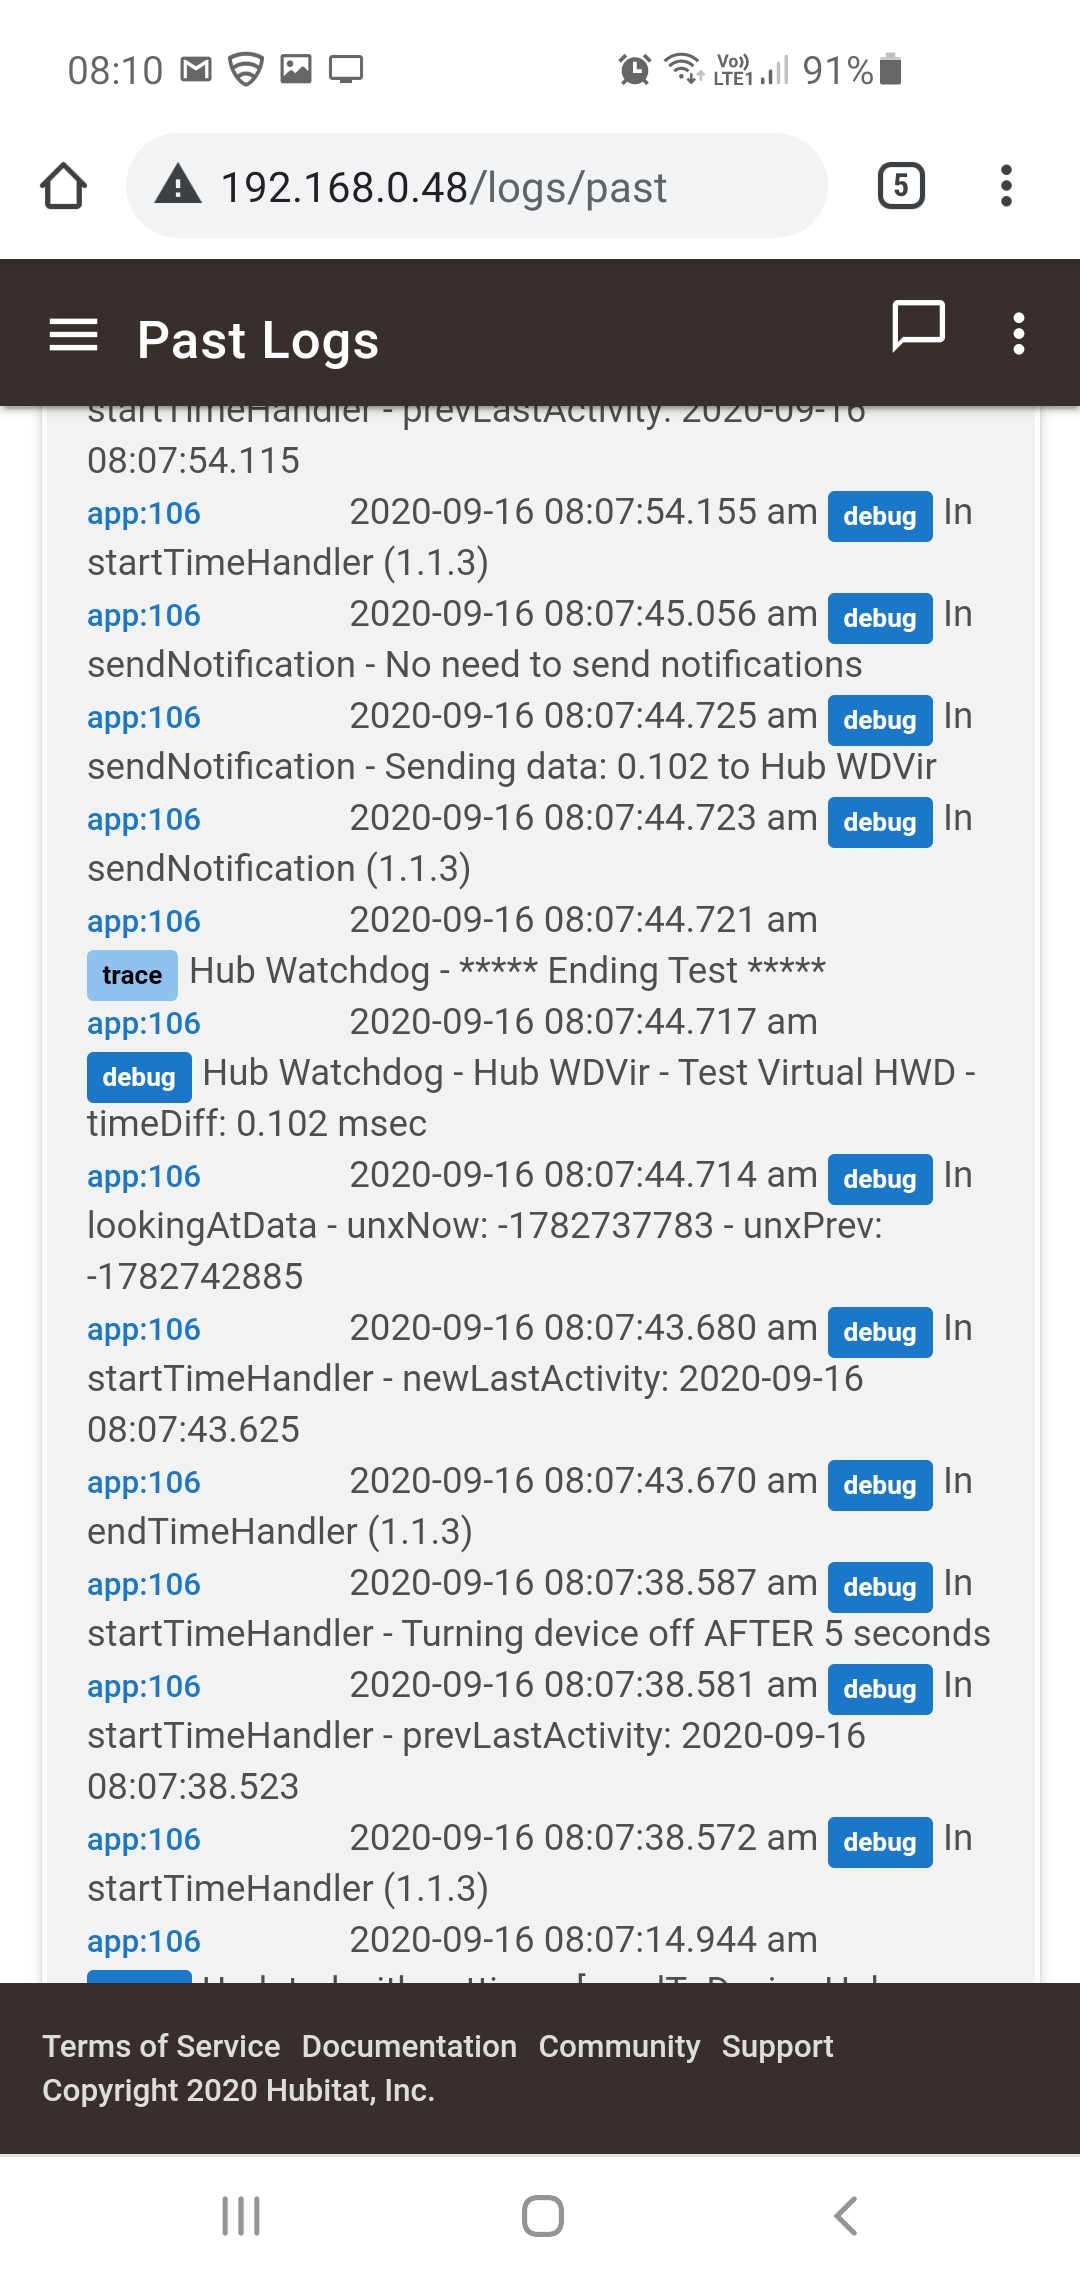
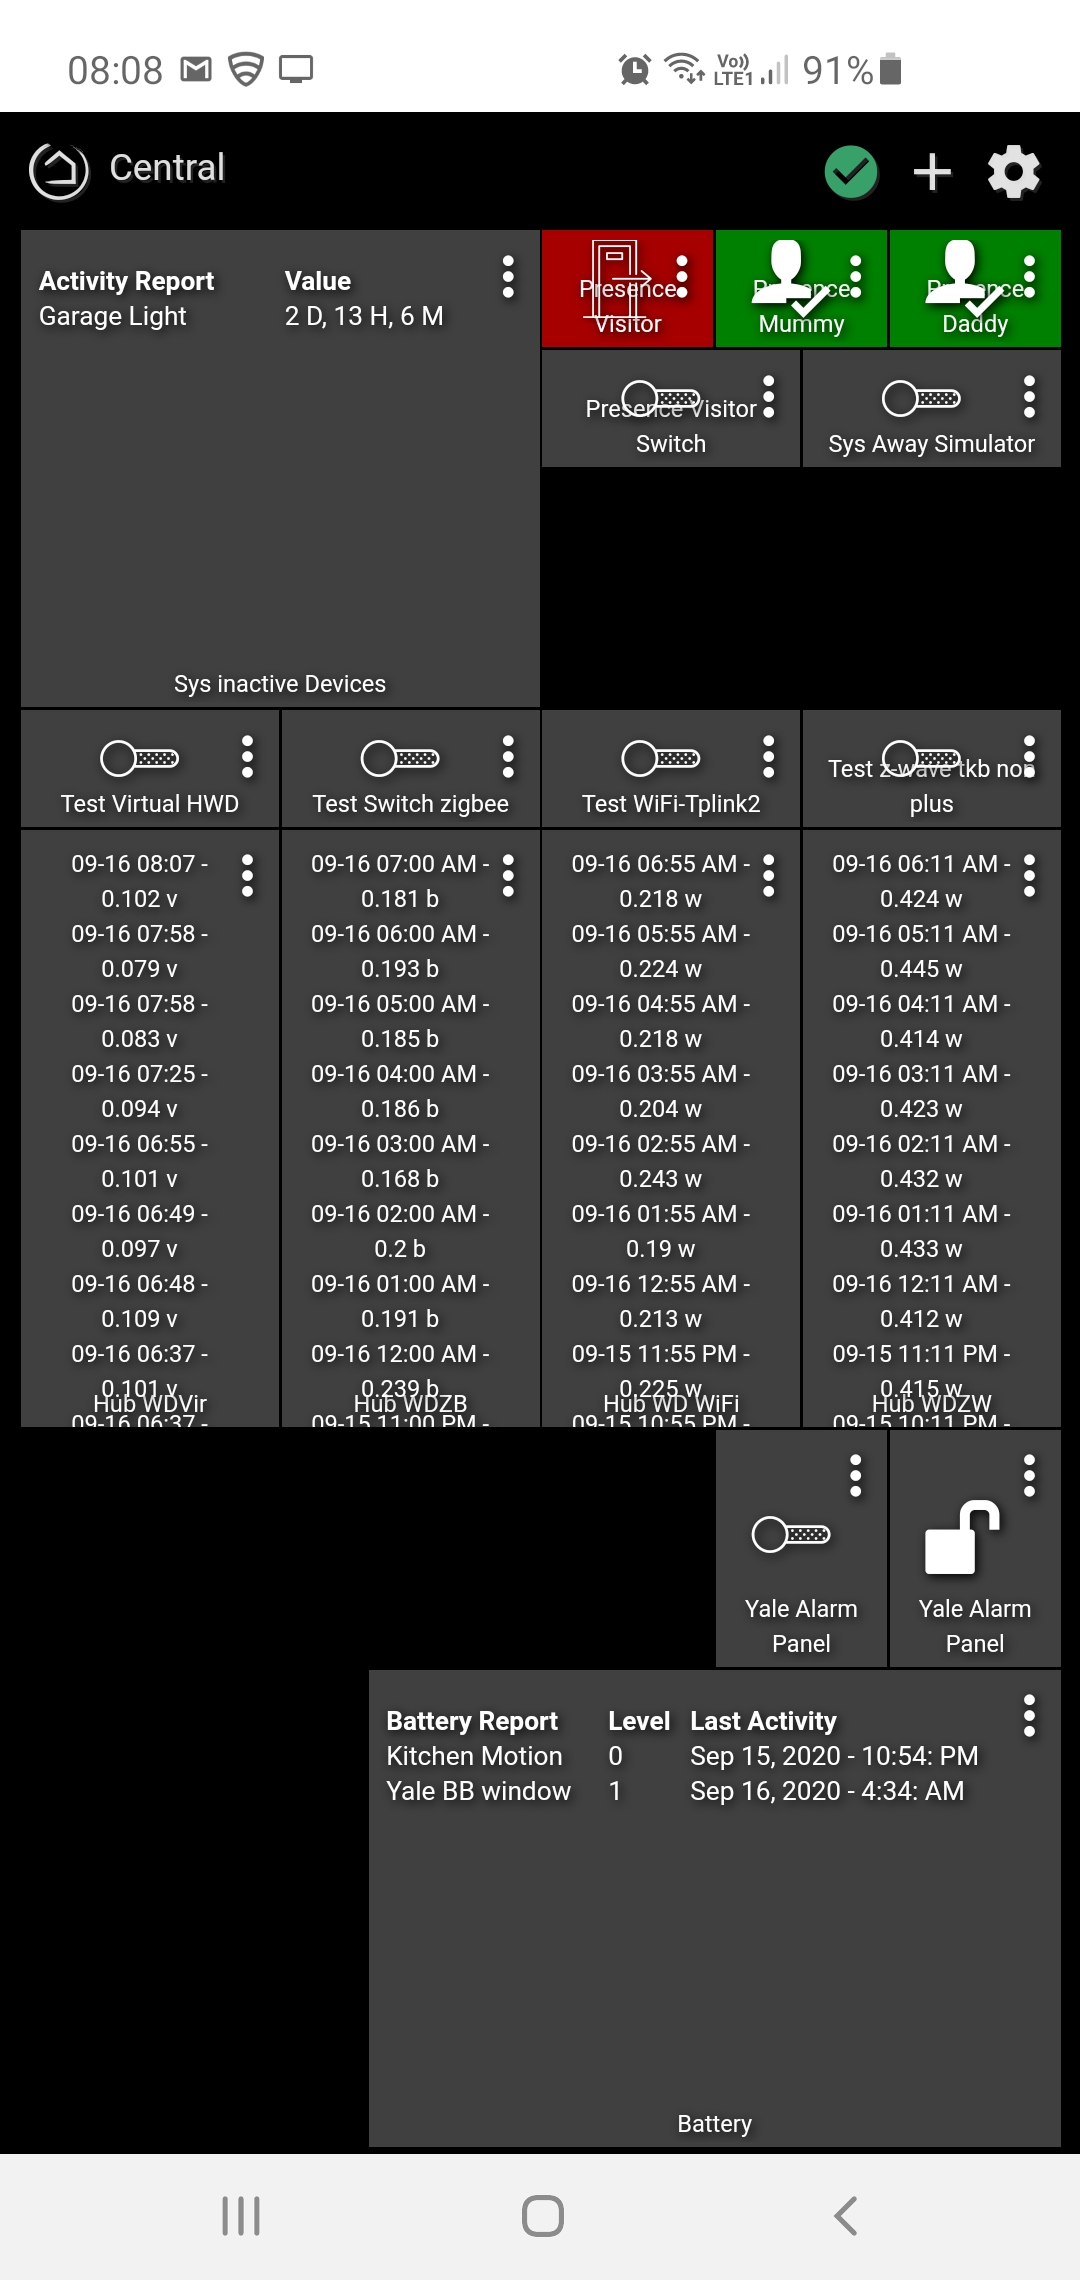
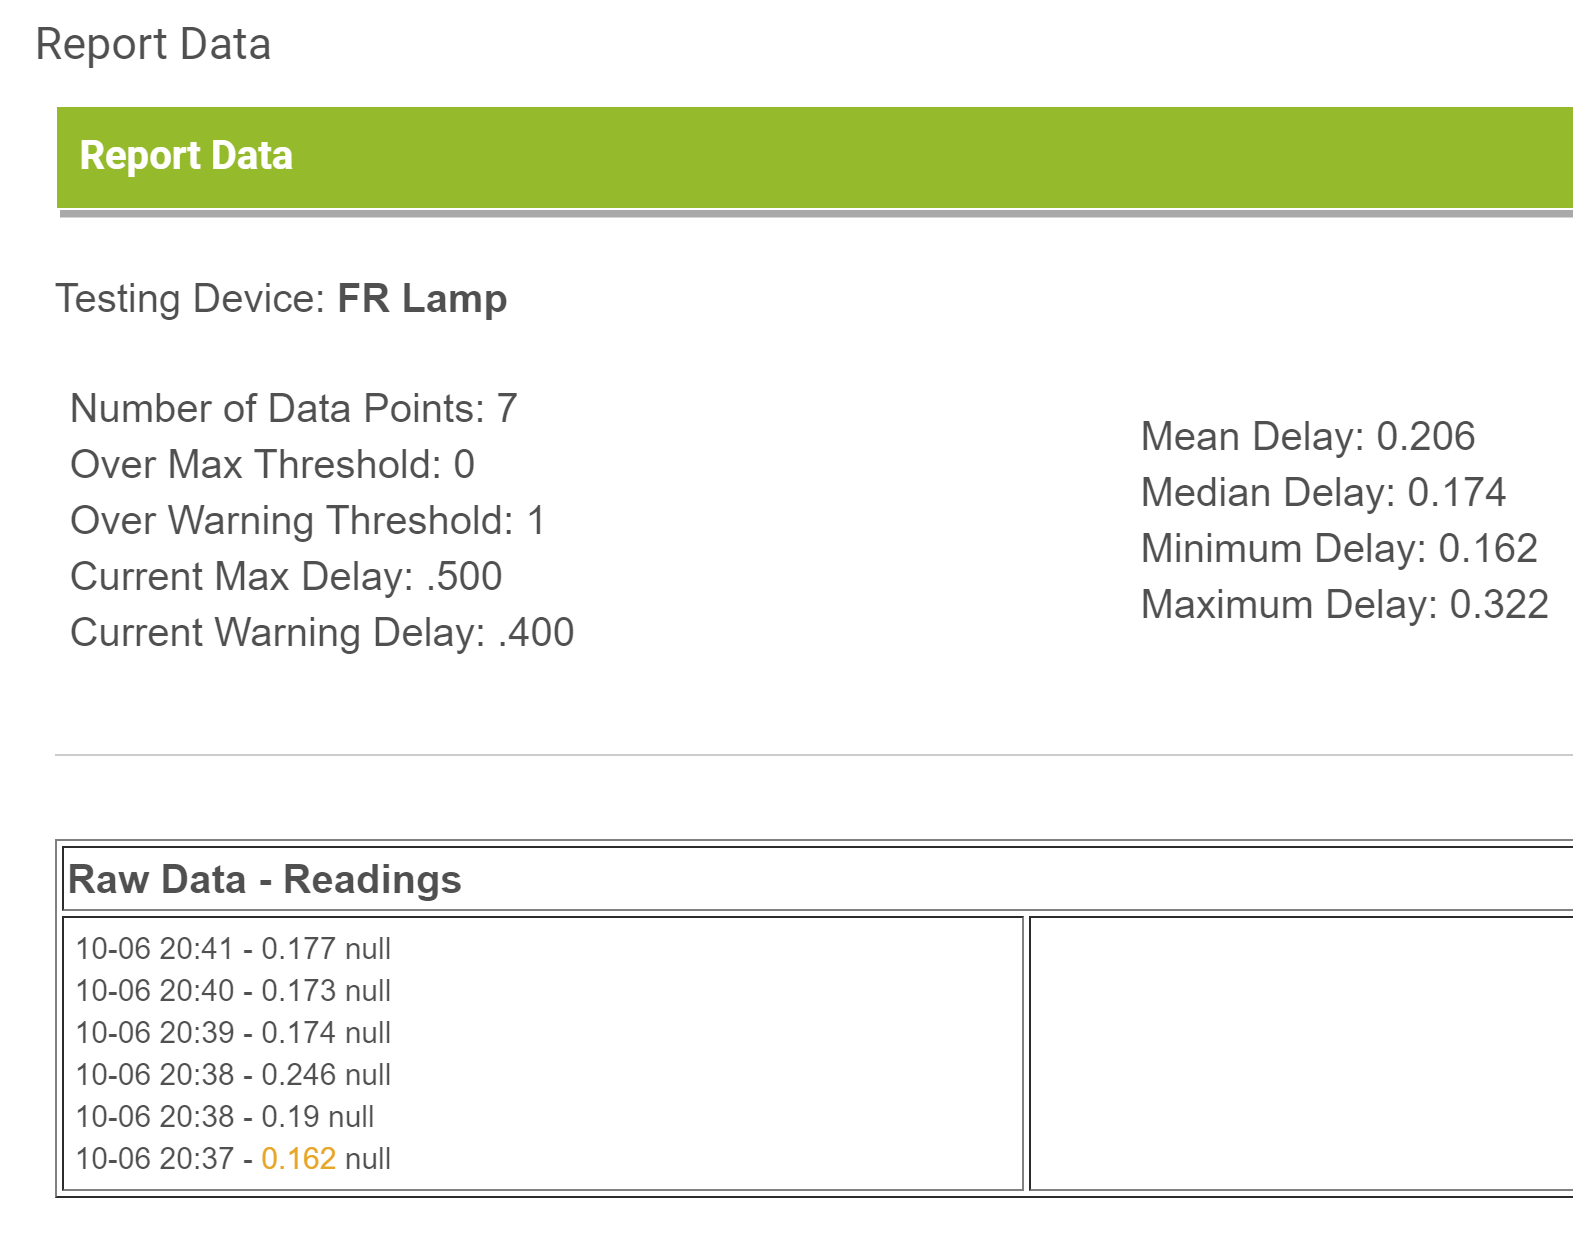
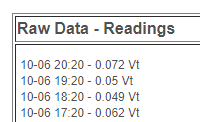
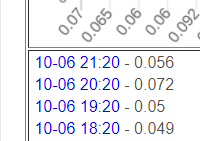
see the screnshots the virtual device is still being tested every hour and the landing page on the reporting device shows that..
But in the details it is not showing any data since 12:59
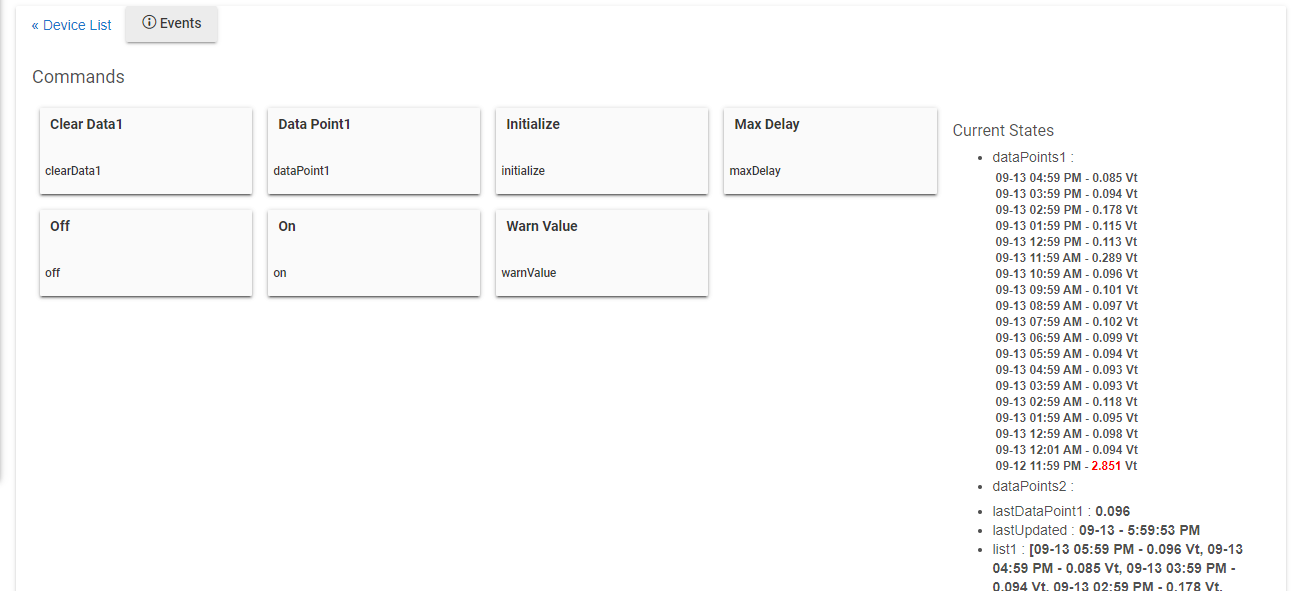
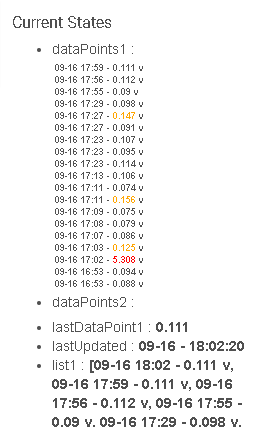
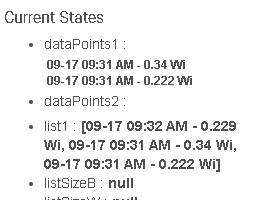
ok changed the attribute to list1 and its there but the font size control dsont effect list1 only datapoints, thats why i used that as the attribute on the tile
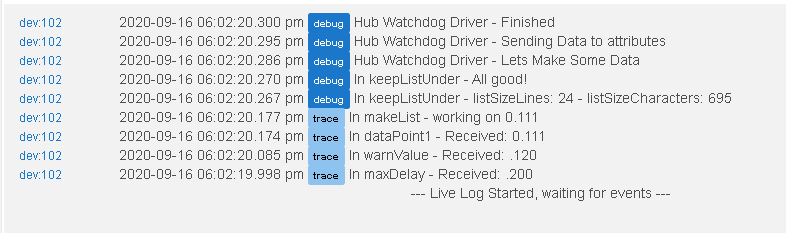
this is whats confusing me, list1 IS being updated where as datapoints1 is always 1 event behind, so shouldnt the list/data your using in the tile be current
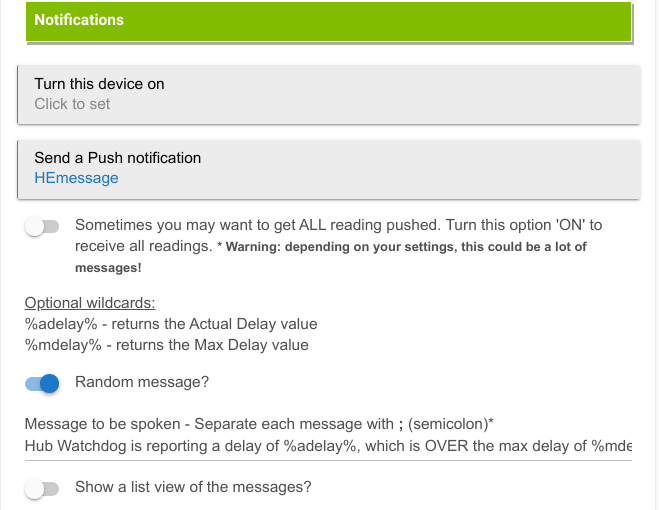
@bptworld, I'm not getting only warning messages but if I turn on the "Sometimes you may want ALL..." switch then I do get all. Bug? I just checked and I am running the latest version.
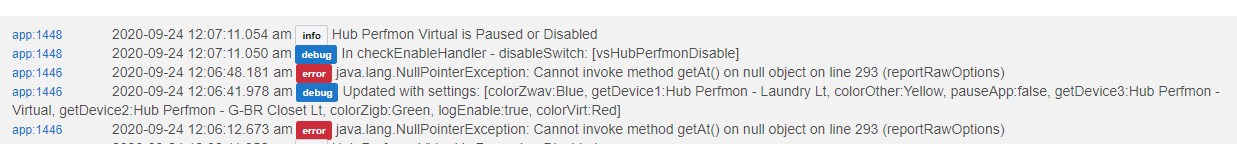
I'm having troubles when I point to a switch to pause the app. It seems that it wants to claim the app is "paused" regardless of the on/off position on the switch.
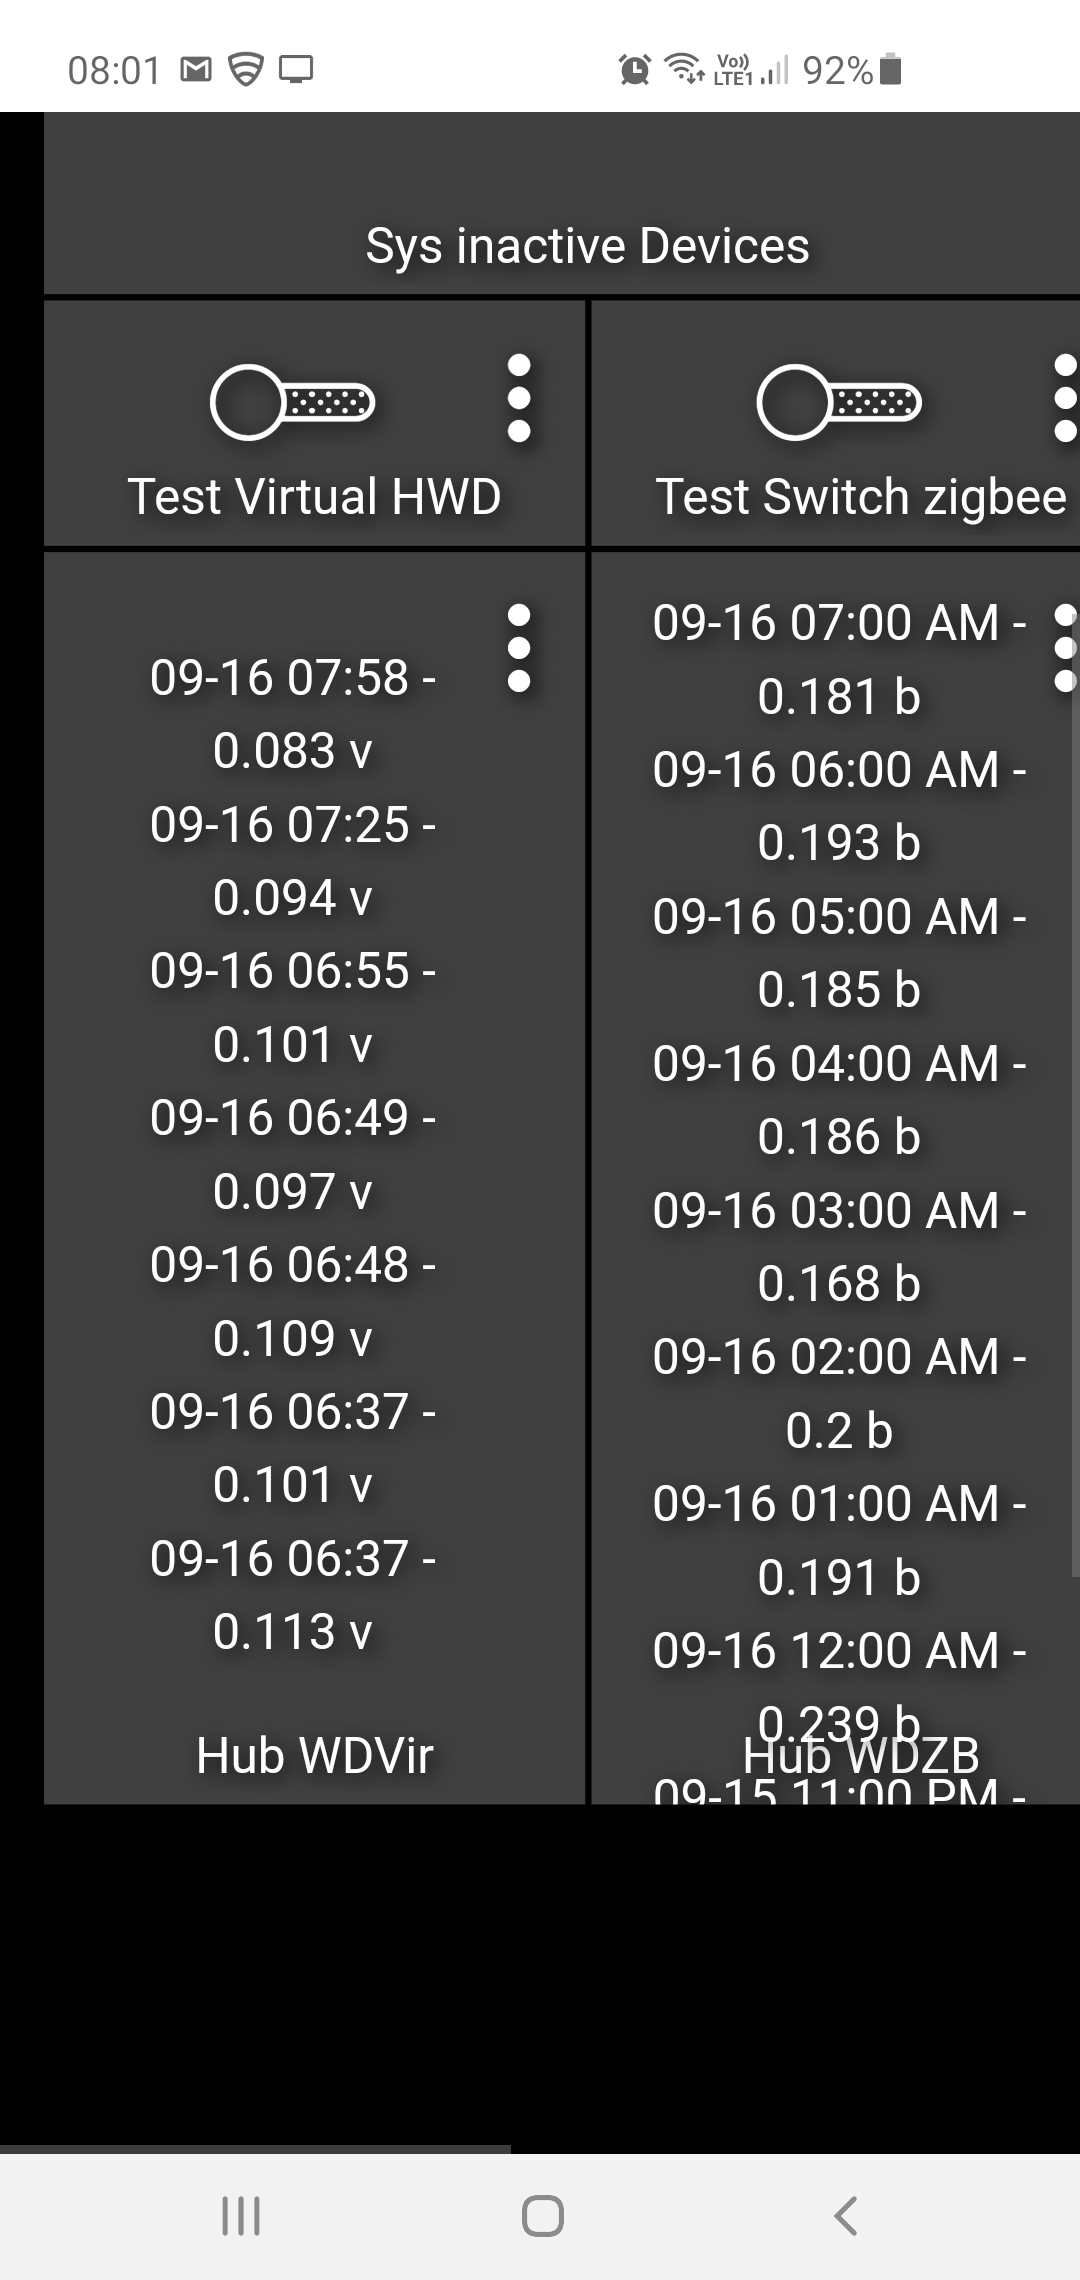
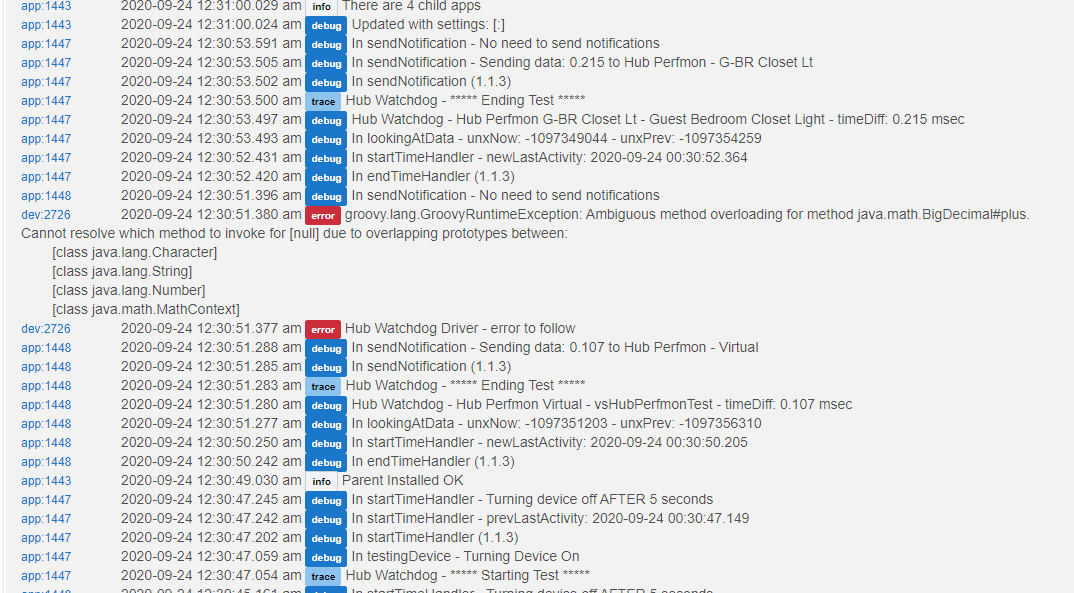
I guess I don't know what the "Examiner" child does--I can't figure out how to make it do anything. I created three Hub Watchdog children to test 2 zwave devices and a virtual one.
I listed those in the 3 slots in the Examiner. When I run a raw report, I get an error.
The "paused or disabled" was there because I pointed that child to a switch--it goes away when I uncheck the link to the virtual switch I used to pause it.
[Update] It seemed to start showing stuff sometime after I created the 3rd device. It doesn't seem to work with only 2.
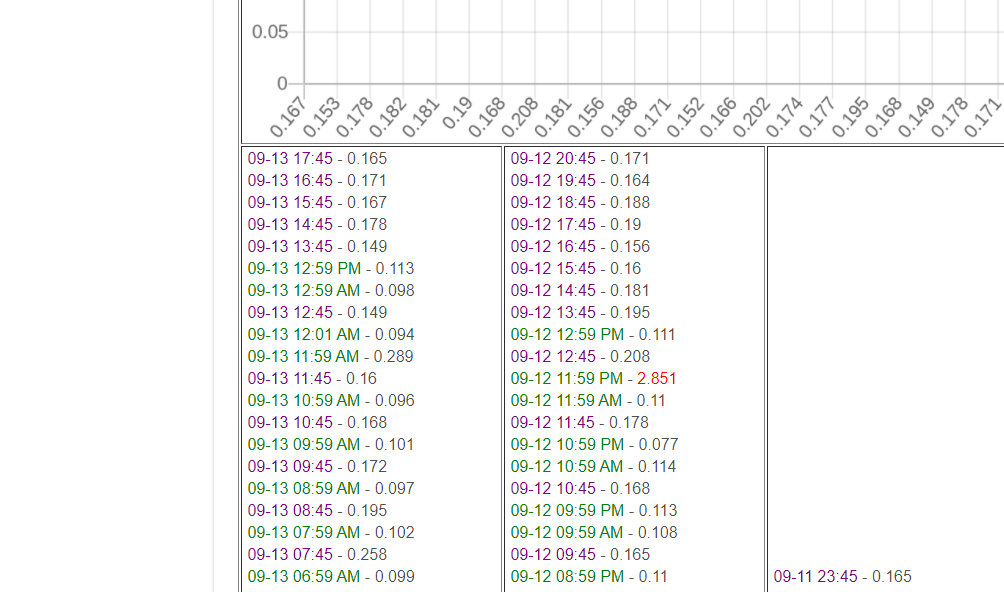
The latest one seems to be related to my having clicked on one of the buttons in the driver to clear/set values (it put a "null" in the datapoint1 list).
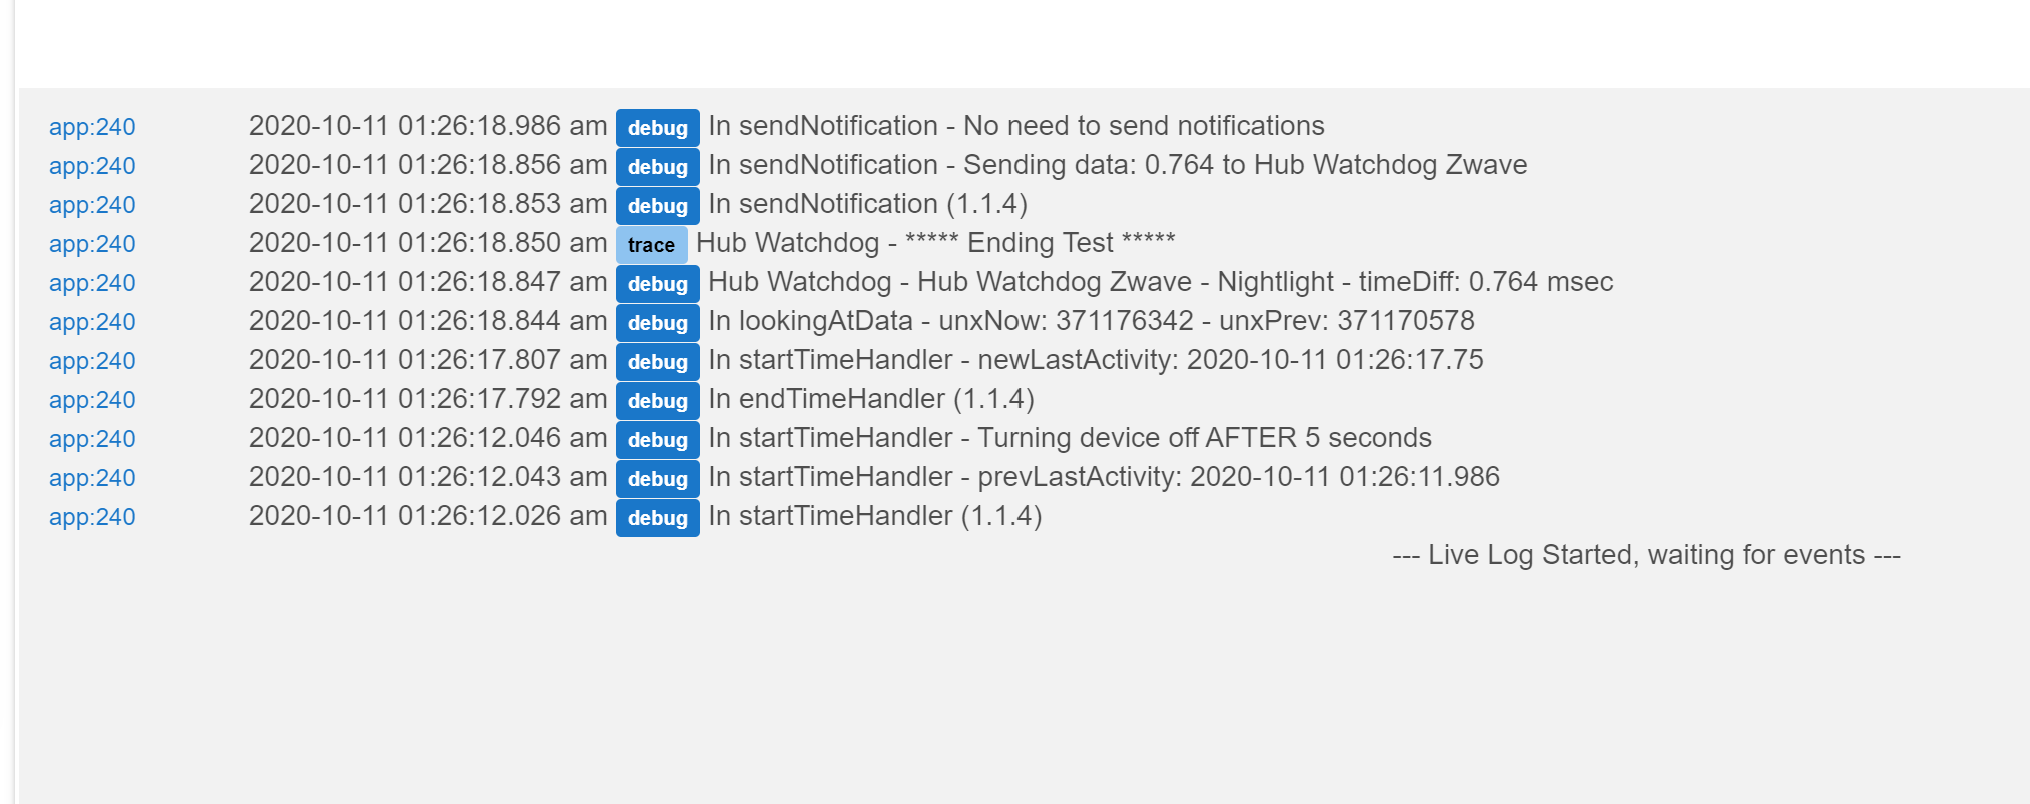
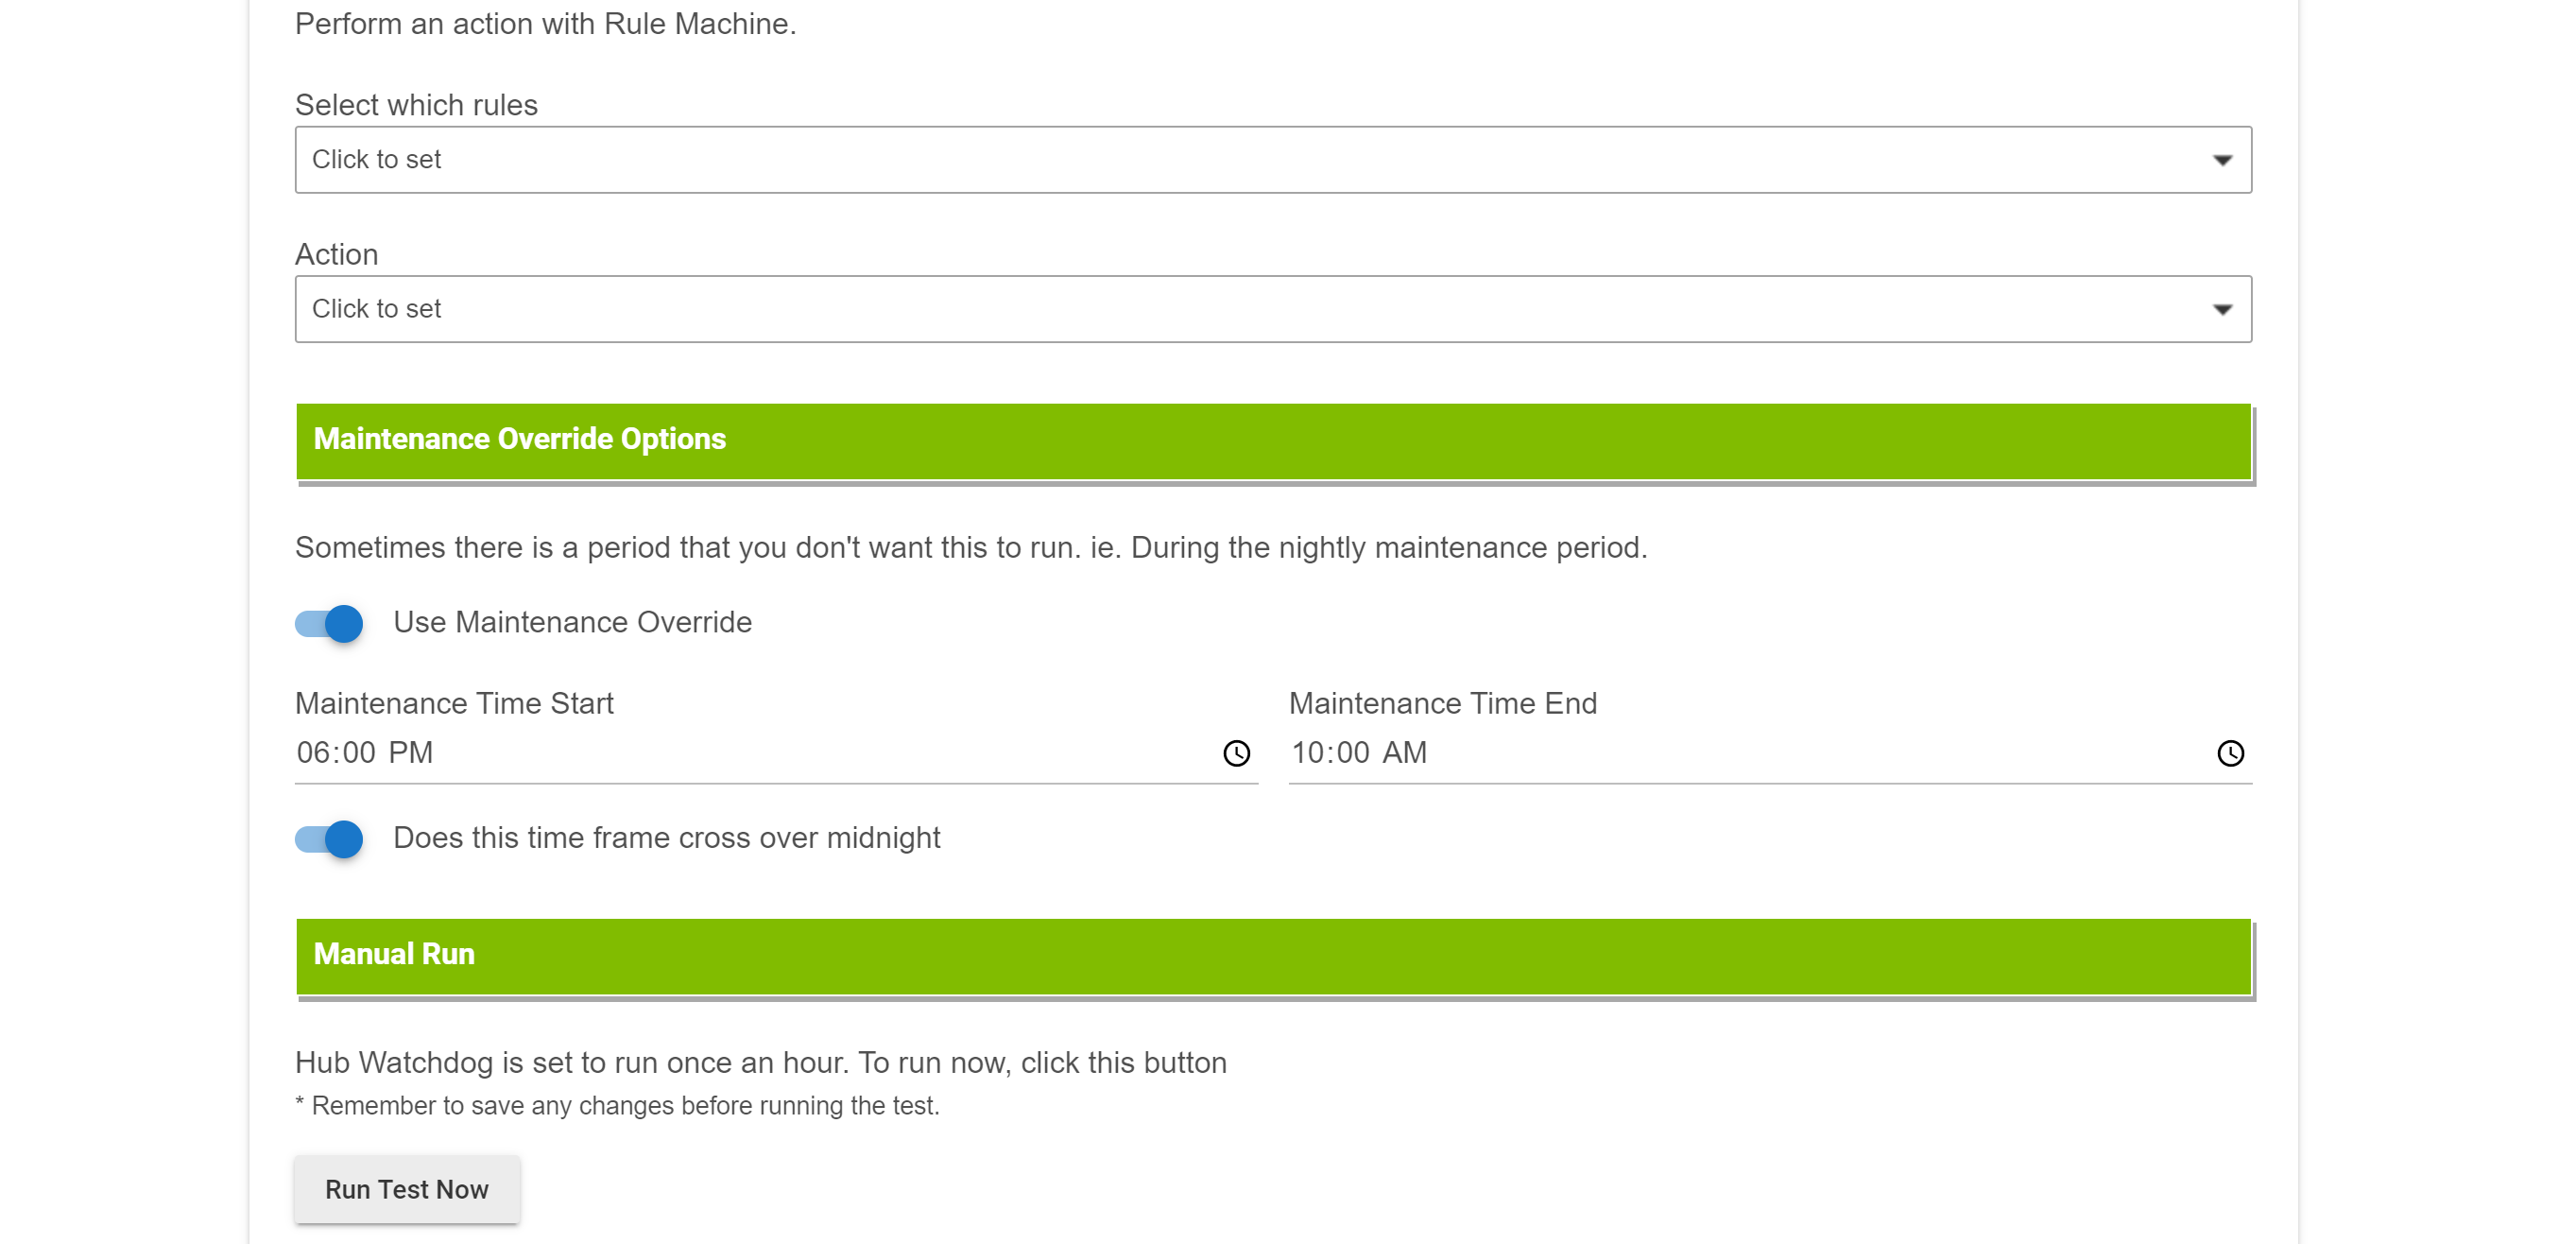
There is a bug in the hub watchdog code.. I am trying to use a switch for double duty it is used to turn on a night light at night and off in the morning so I added the times for maint. mode. but it is not enforcing it.. Whenever the switch is turned on during the maint. times. the test to turn off fires and turns it off.