Just in case the time stamps help @thebearmay - the below shows the error was first, followed by system start 12 secs later, then Hub info initialised 7 seconds later:
OK, I must be blind or stupid (more likely the latter). I've looked through everything and can't find how to do this.
I'm trying to use it in a rule machine rule for my UPS monitoring (NUT) to shut down the hub on low battery.

And you're not stupid at all. It's not exactly intuitive!
1 Like
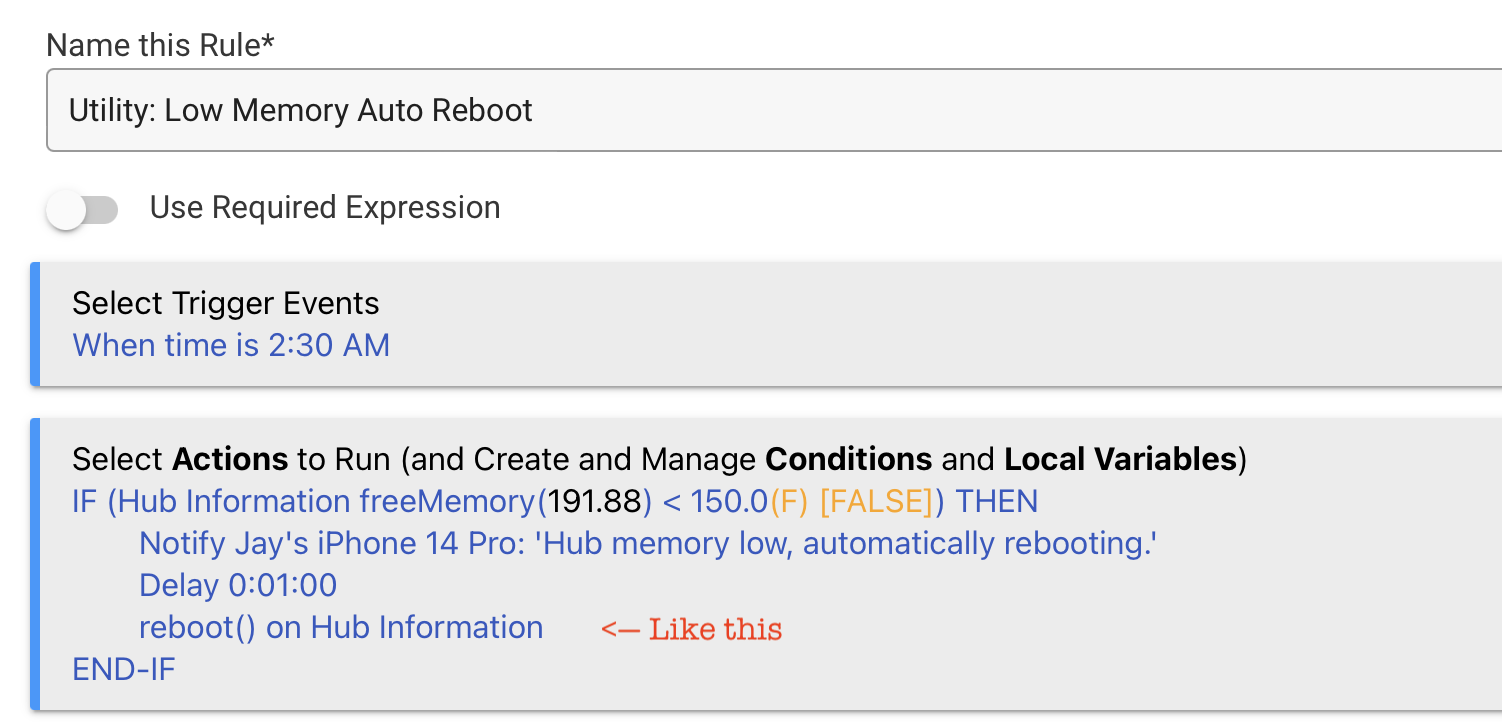
Assuming you can get your battery level to use as a trigger your action would look something like this:

Thanks, the actuator is what I wasn't finding.

I'm mimicking @jtp10181 awesome rule and not good with RM. I have a few that I'm still trying to figure out and this was one of them.
Coming late to this party. Is there a workflow that takes all the data collected here and sends it to a grafana dashboard via influxdb? I have seen mention of nodered etc. but will like to get a birdseye view of what that workflow will look like. Data from here - > node red -> influx -> grafana? Any custom scripts in the middle?
Perhaps this is also not the possible but is prometheus a possibility in this scenario? Just poking around to see whats possible. Thxx
Generally people are using MakerAPI (w/Node Red) or InfluxDB Logger to get data into Influx or another DB and then use Grafana to do the visualizations. If you are using webCoRE it can also access and graph the data using its long term storage option.
As to Prometheus, no reason you couldn't send it there also, but not aware of a direct integration currently. My initial thought would be to use MakerAPI to do the extract, NodeRed to do the transform and load into Prometheus (assuming there are nodes available).
As a new user it wasn't obvious what tile template to use. After some trial and I error I discovered "Attribute"
Maybe you can add to the NOTE FOR NEW USERS:
1 Like
I believe that information is in the first paragraph of the first post in this thread:
4 Likes
Thanks for the quick reply;
I was looking for a statement like:
When adding a dashboard tile for this device and it asks you "Pick a Template" then choose "Attribute". It then gives you a choice "Pick an Attribute".
Maybe this will help some others.
Thanks
Herb
1 Like
Here is a direct link to a post about getting InfluxDB Logger setup. You will need to enabled the advanced mode to send the attributes you want.
Here is some dashboards I have been working on, one of which uses the this driver:
3 Likes
Hi,
Thanks for this driver. I've been wanting to track hub attributes for a while now.
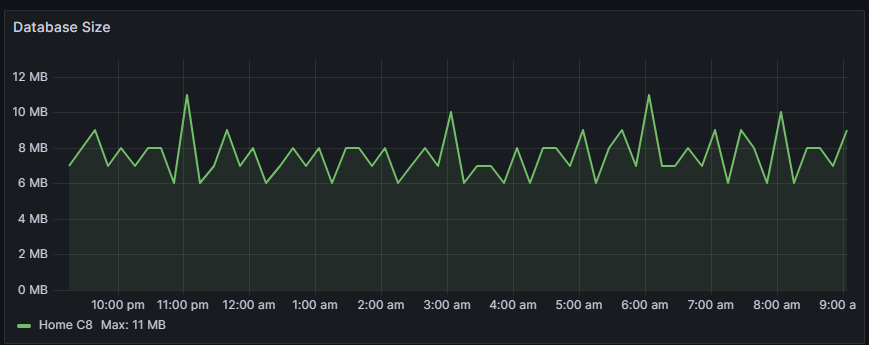
One question, for DB Size, is it normal that it seems to be an integer, and it varies widely between 4 and 14MB ?
Yes thats similar to my hub, it will spike up and down a lot as data gets logged and then the cleanup runs.
lol 4 to 14 is teeny. i remember 200+ days...
Ok, thanks. I guess I don't understand what "dbSize" is... I would expect the size of the database to be rather constant (or growing)...

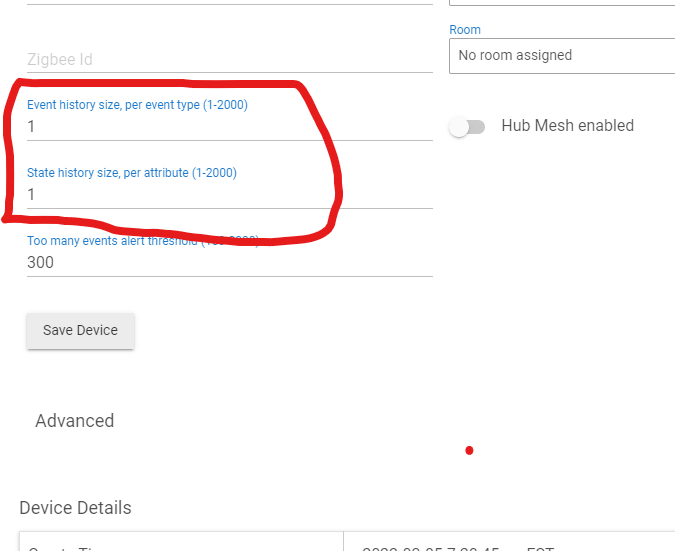
Database holds all of your app and device settings as well as events. The events get trimmed to the max setting you've designated once an hour, thus the DB grows and then shrinks over time.
Where is that setting ?
Is this the size of the logs ?
It seems to get trimmed a lot more frequently than once an hour.