Using HPM download InfluxDB Logger from the Community github Repository.
Once you have InfluxDB Logger loaded via HPM you will need to add the app to the hub by clicking on the "Add User App" button in the upper right corner and select "InfuxDB Logger" from the list that appears. This will install the smartapp on the hub and take you into the initial setup screen shown below
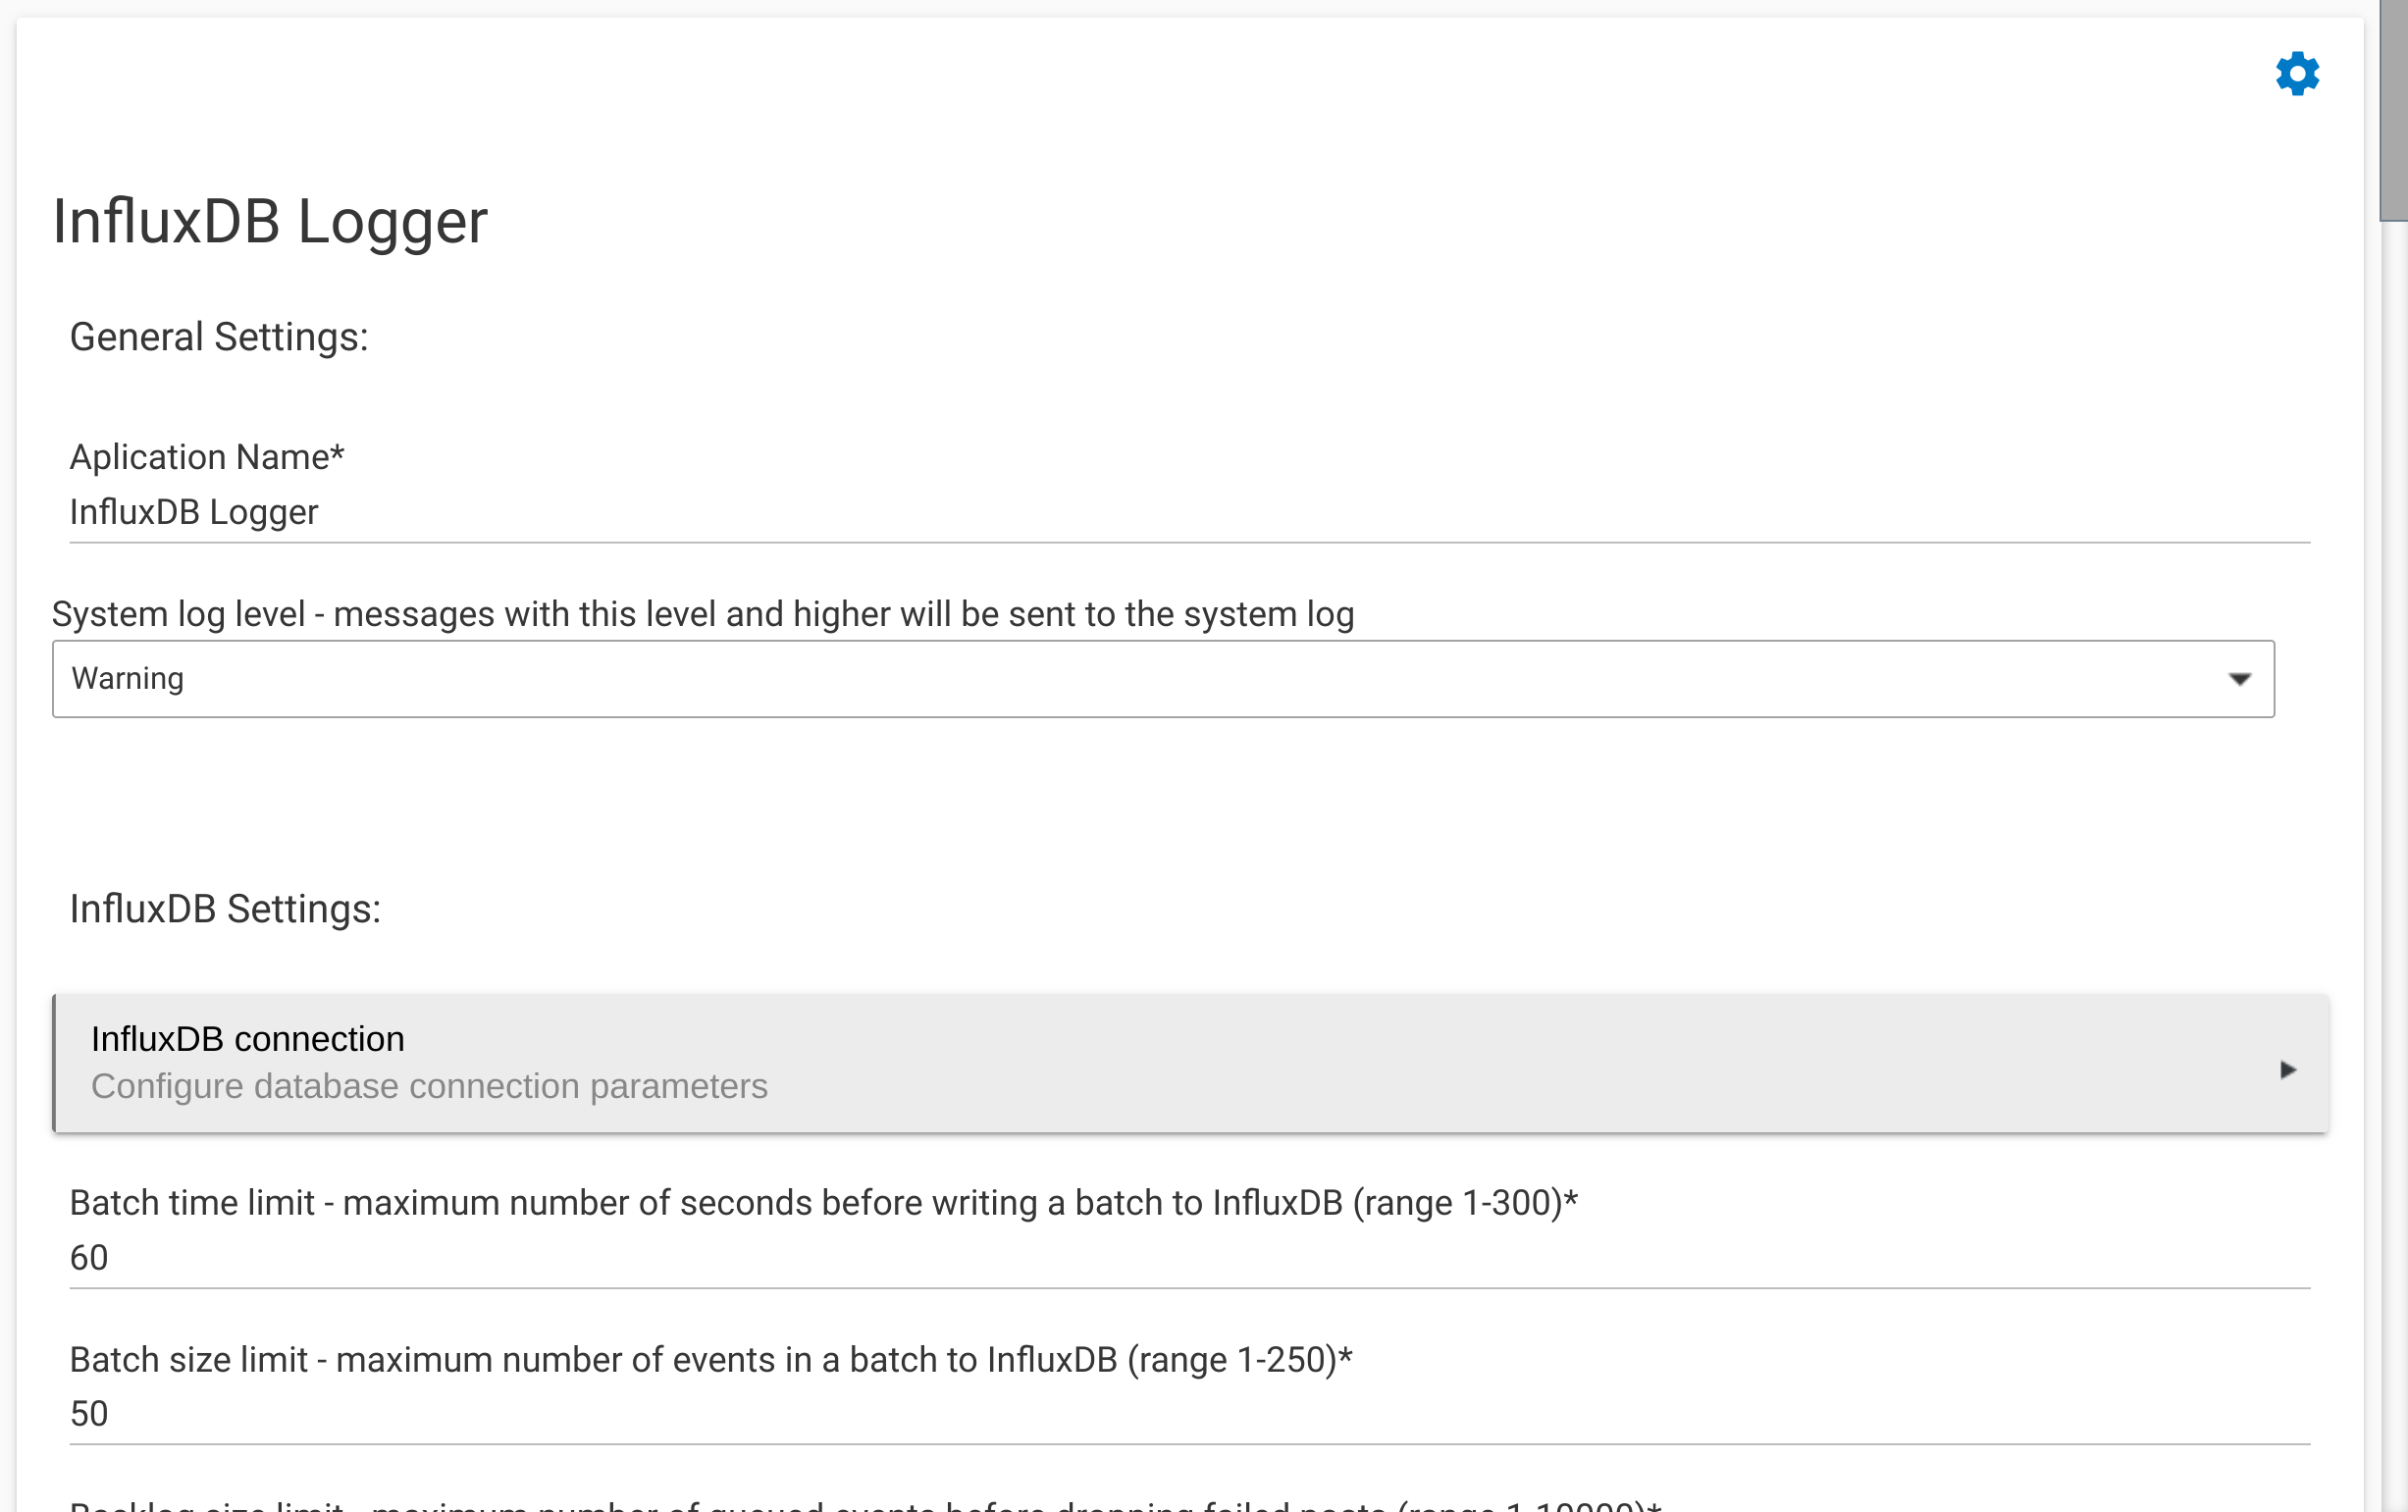
So lets us step through the setup of each part of the app.
The application name will default to InfluxDB, but can be modified if you need to run more then one instance.
"System Log Level" will default to "Warning" level which will help minimize logging and can probably be left along. If you ever run into issues with the app you may be asked to increase this.
Next is the Influx DB Settings section.
Now we get to the connection Settings. Clicking on this box will load up a new screen that has the breakdown of all of the connection options. This will vary a little bit depending on if you are using the cloud or local setup. Below is an example of what it will resemble if you are using a InfluxDB Cloud setup.
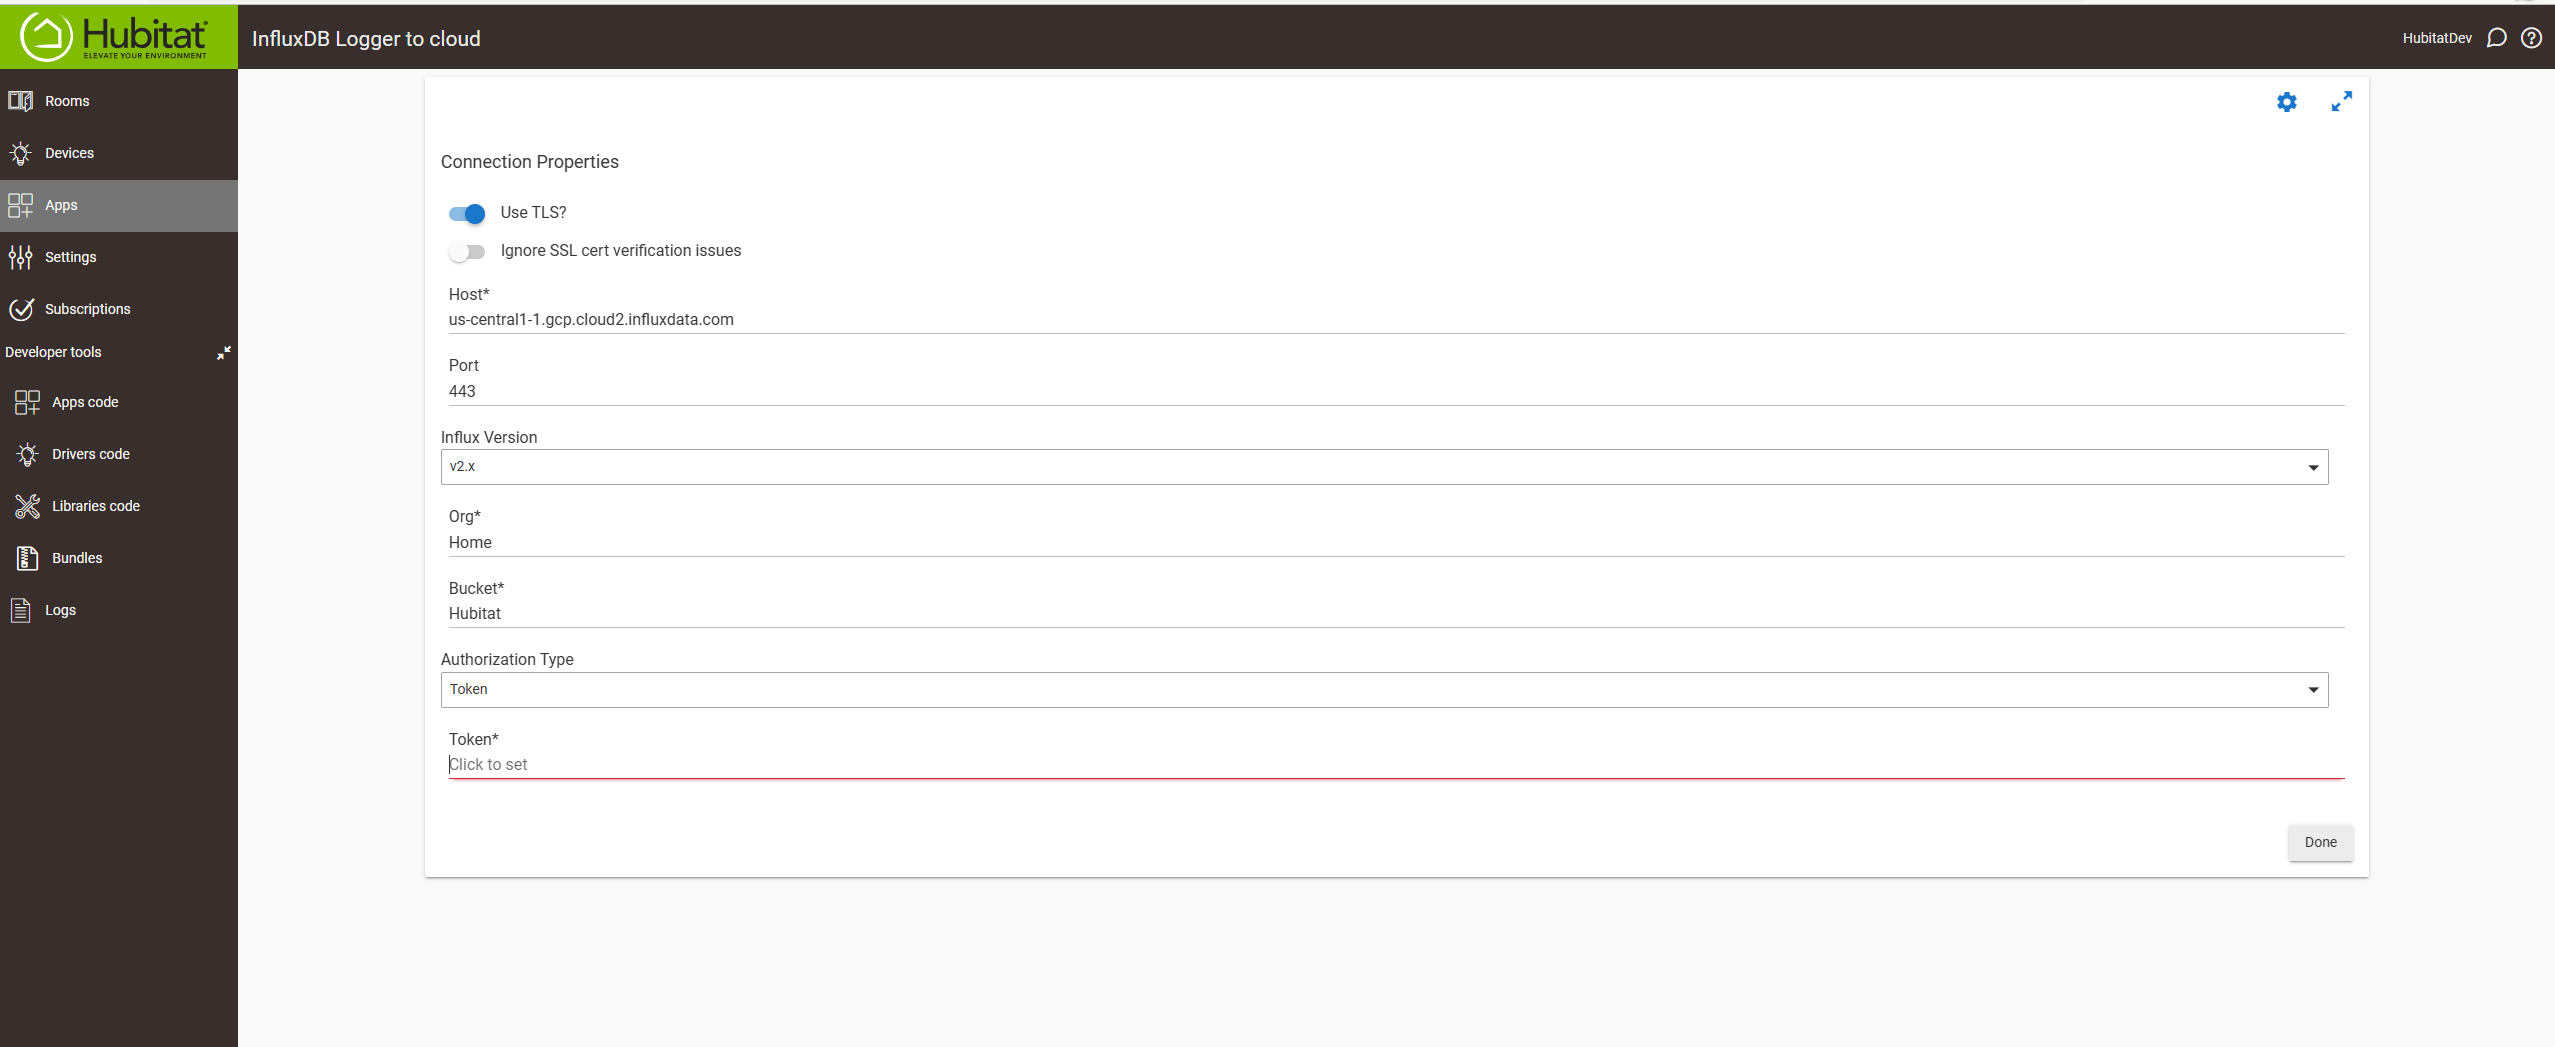
The key is to select "Use TLS" at the top. Use just the Host name from the URL obtained earlier. Specify Port 443.
If you are using a Local install you will leave the "Use TLS option" off. Specify the database server's IP address for host and use port 8086.
Then you need to select v2.x for the influxdb Version and enter the Org, and Bucket you setup in your database. Lastly select token for the "Authentication type" and enter your token
Once these options are setup click on done and return to the previous screen. If you populated everything here properly HE will be able to communicate to InfluxDB.
Batch time Limit, Batch Size Limit and Backlog Limit have to do with how records are handled as they occur.
Batch time limit determines how much time to wait after a new event occurs for more events before posting those records to the database. This doesn't effect the time for the event that is recorded just how long it takes to get into the DB.
Batch Size Limit indicates a max size to be queued up before a post is made. Think of this as just another way to determine how frequently data is written to the DB.
Batch Time Limit and Batch Size Limit function independent of each other and either can trigger a post to the database depending on how your environment is running.
"Backlog Size Limit" determines when a records may be droped to prevent Hub performance problems. This is used for those cases were for whatever reason your DB becomes unavailable for a period of time. InfluxDB Logger will start to build a backlog of events and hold them until it can post them to the DB. If it gets to the Backlog Limit it will start to prune the oldest records to prevent Hub performance issues.
It should be noted that the "Batch Size Limit" could potentially impact recovery time if you have a prolonged DB outage.
The default values for those settings are very reasonable.
That completes settings related to InfluxDB and we can now move onto "Event Settings"
InfluxDB Logger has a concept of "Keep Allve Events" which is the first setting in this section. The simplest way to explain this value is to ensure data is posted to the DB even for devices that rarely trigger an event. This can be useful if you want to graph states in shorter intervales that may not ever appear or change on a certain graph. A default value of 15 min's ensure you will get data for each device you setup every 15 min reguardless of change.
Next you have two values relate to includeing hub specific data with the event and if it should post a soft poll even if the device was updated in the last soft poll interval. The default value on for these values is probably prefered in almost all aspects
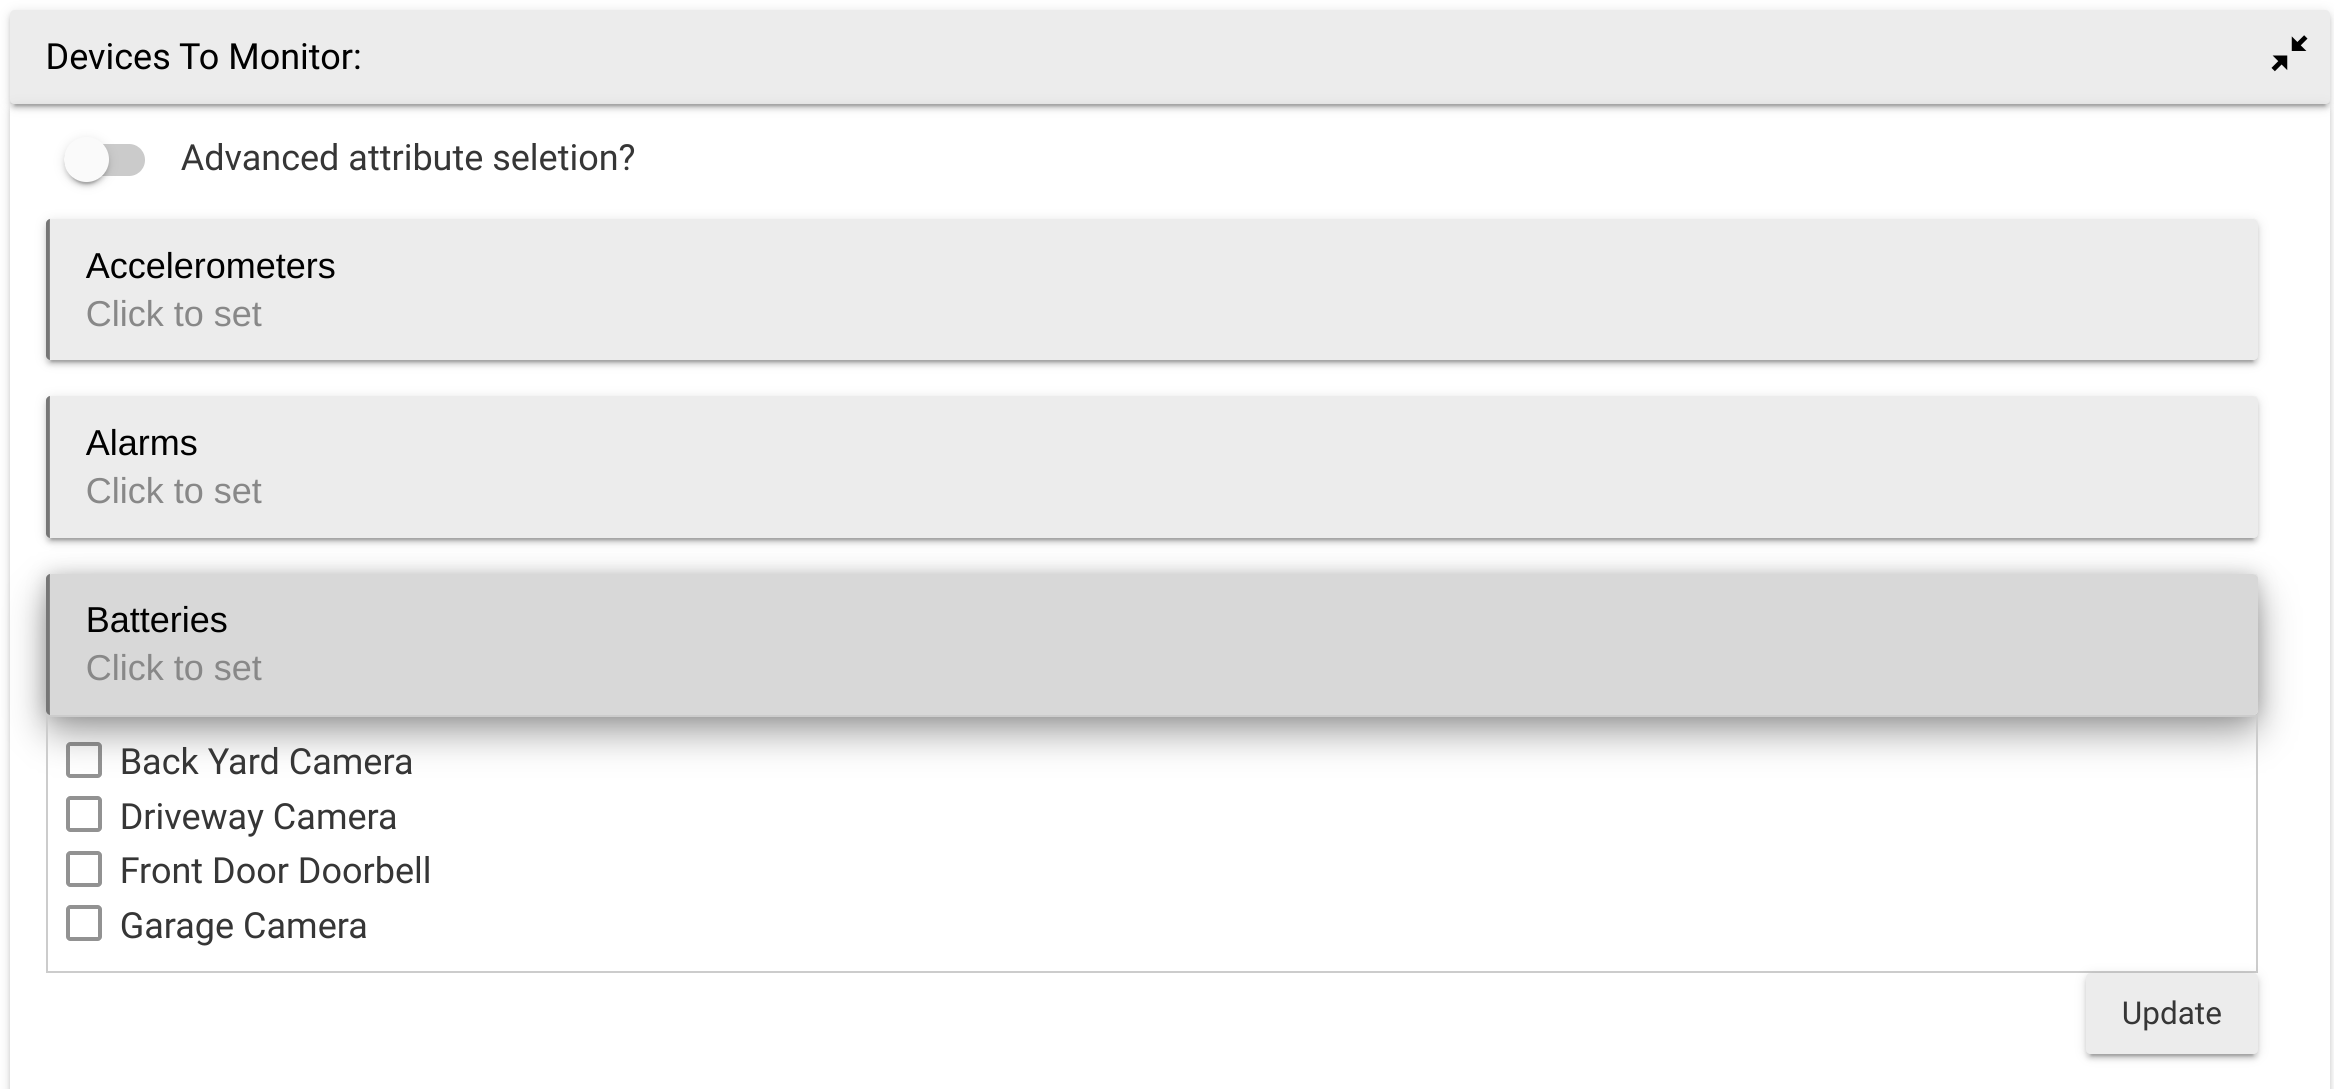
The last section is "Devices to Monitor" and this is where you decide what devices you will track for visualization. Hubitat has the ability to use custom attributes that can be unpredictable. For that reason the default options here are based on documented predefined capabilities that are part of the HE environment. These entries are pretty much guaranteed to work and is what i would suggest you use first. To enable devices to be captured and sent to InfluxDB you will select the individual capability which will then display a list of devices. Then select the devices you want to capture.
Here is an example where I click on devices that have Batteries, and then could select the individual devices.
In some advanced situations there may be things you want to capture that are not standard capabilities/attributes. This is where the option for "Advanced attribute selection" comes in. This kind of flips things around and will allow you to select any device and then the specific attributes you want as shown in this picture. I this example I enabled the Advanced Attributes option to select the cpuPct, and dbSize attribute.
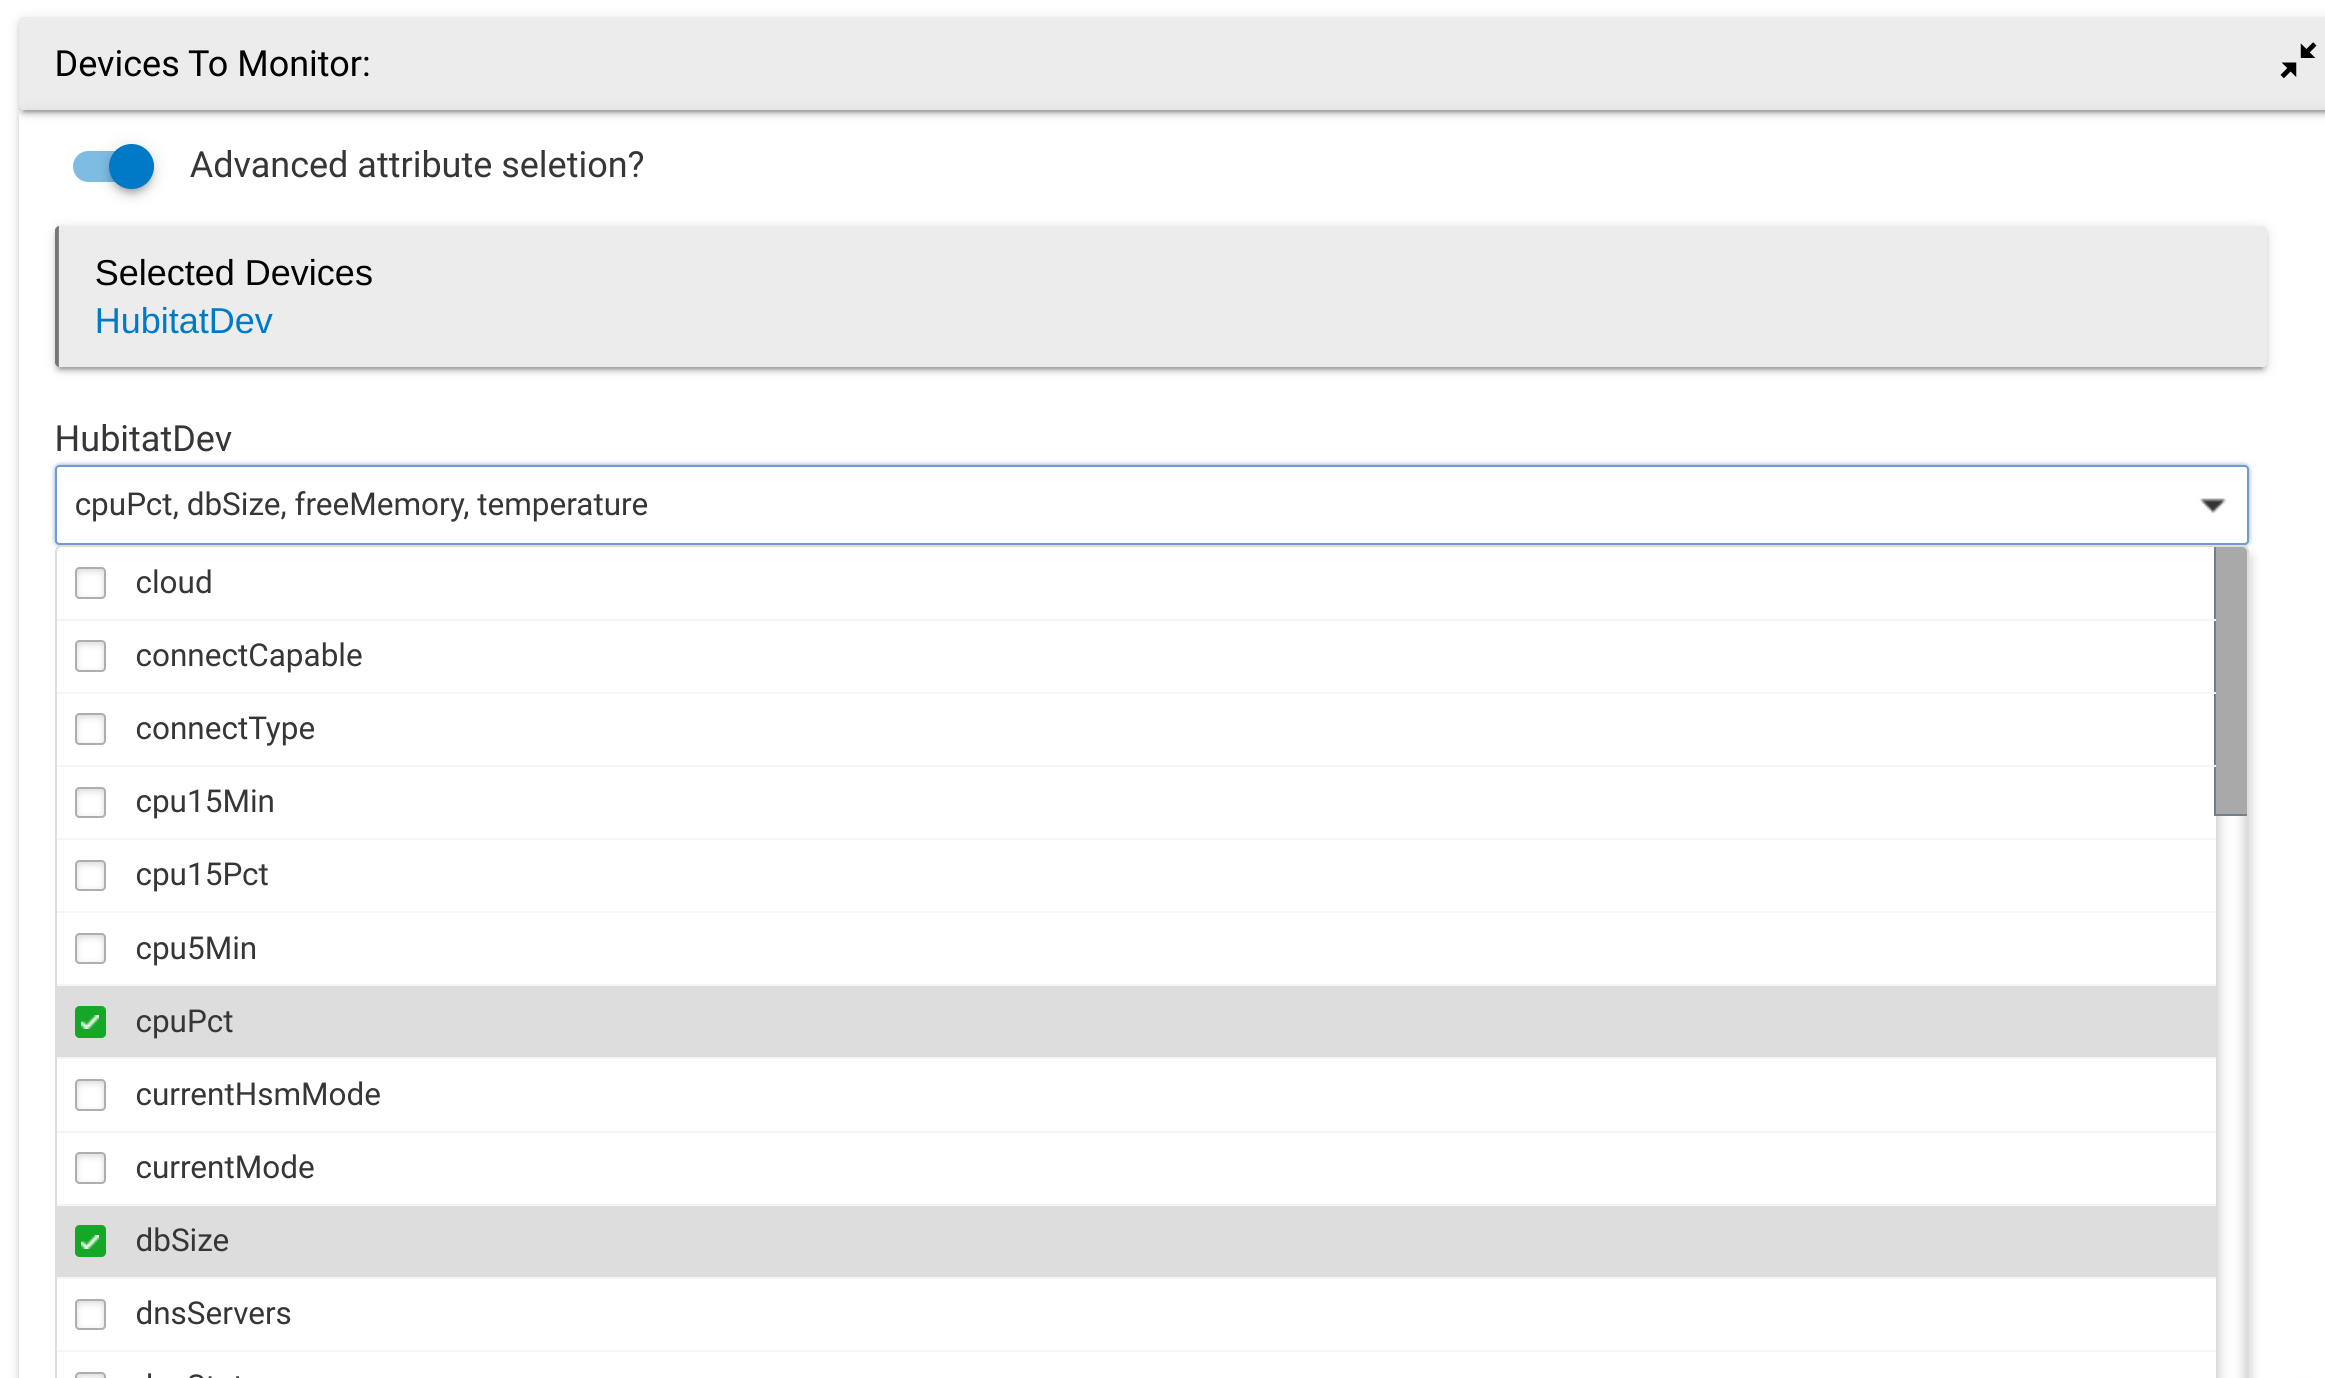
Using the "Adavanced Attribute" option can be a dangerous action though as improper data can cause your data loads to InfluxDB to fail. I would suggest you do what you can in the standard method and then use a second instance for the Advanced Attribute captures you need to do. This will alteast ensure most events flow with no issues.
Once your selections are made click done. Because this can potentially touch many 10's of devices this last done click can take a bit on the hub. There are allot of things behind the scene that are getting setup at this point.
Now you can go look at your logs and you should see no errors from INfluxDB Logger as it processes yourn events.

