Lately I've been working to track down what exactly has been causing my hub to slow down at times. As part of the troubleshooting, I wanted to maintain some graphs and logs of hub response times, and also to be notified when the hub begins acting up.
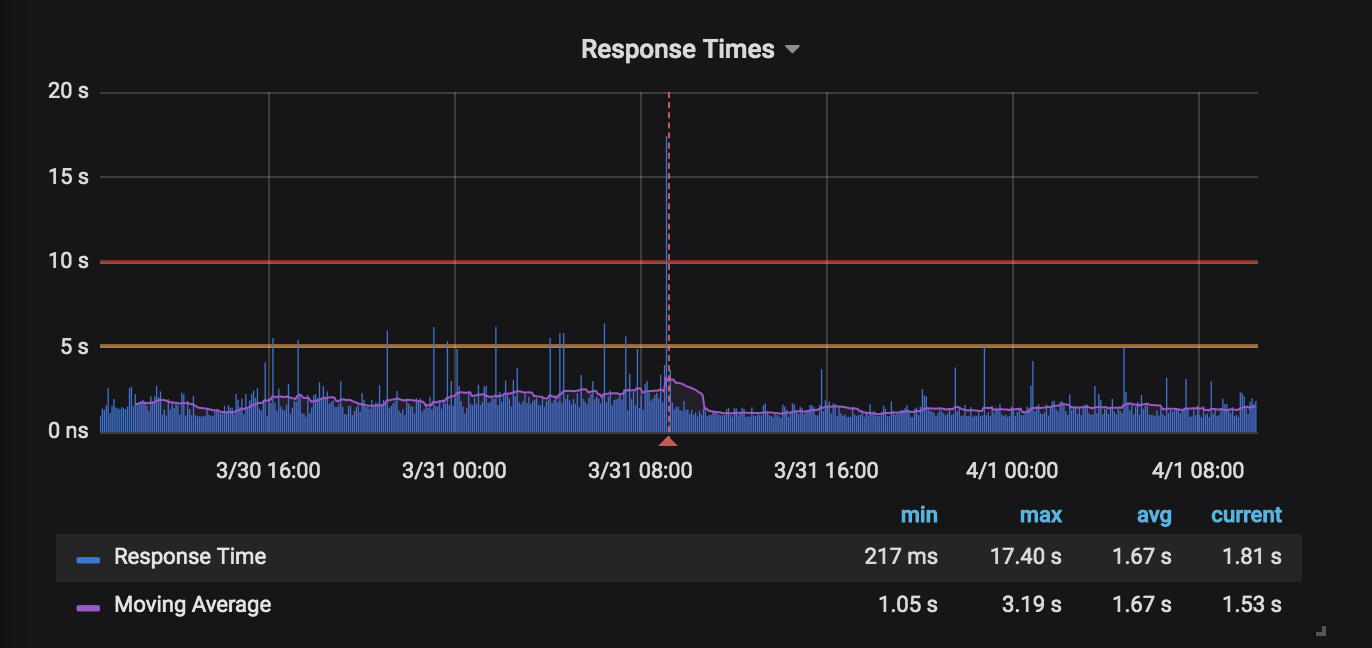
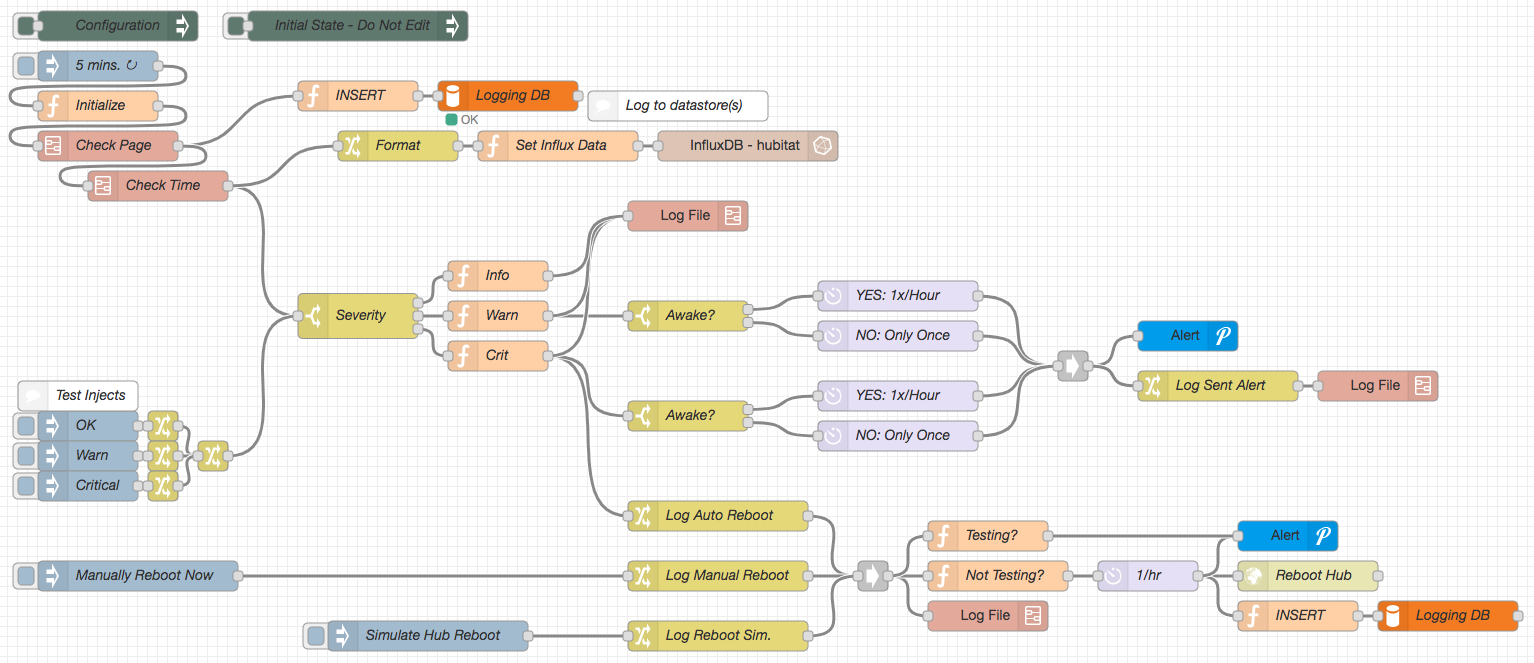
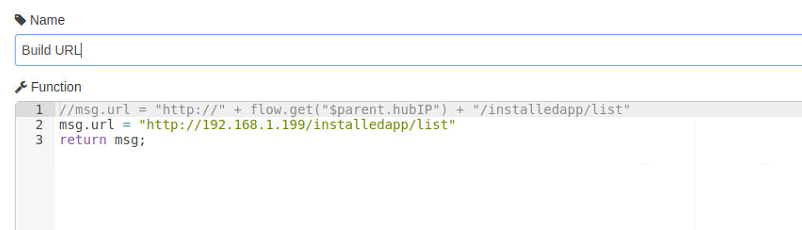
The flow makes an HTTP request to the hub's App List page every five minutes and calculates the response time.
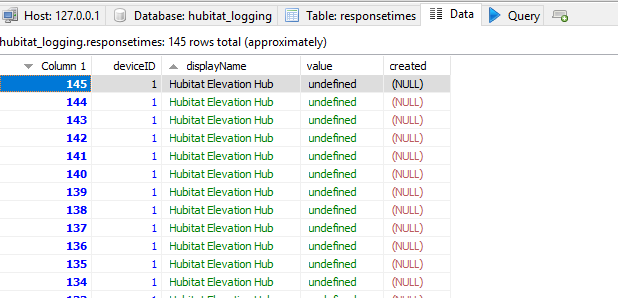
The response time is written to MySQL, InfluxDB, and a JSON log file on disk.
If the response time is between the warning and critical thresholds, a Pushover alert is sent
Notifications are sent only once per hour during waking hours and only once during the night.
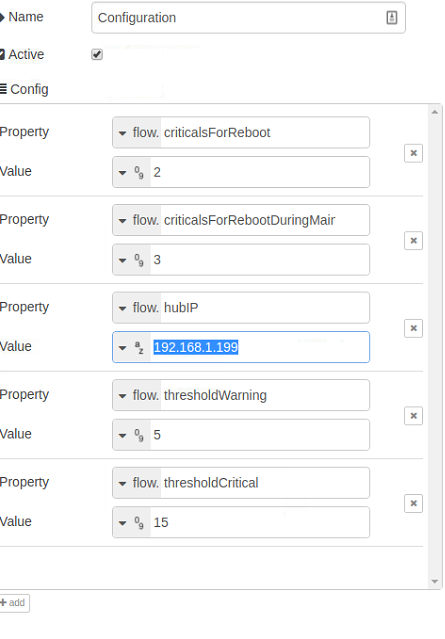
If the response time is over the critical threshold, for 2 consecutive polling intervals (3 during the nightly maintenance window), the hub is rebooted.
To prevent continuous loops, a check is done to ensure that the hub is rebooted no more than once per hour.
Additional manual injection nodes are provided:
Manual hub reboot
A set of test injection nodes, one for each tier of response times
A simulated reboot of the hub for logging/testing purposes
I'm also working on a flow to toggle a virtual switch via the Maker API and listen for the event to come back over the websocket. I'm wondering if there will be a corellation with the times that this flow shows and which one turns out to be a better predictor of hub issues. Stay tuned!
Its odd there doesnt seem to be any kind of slowdown at the 2am database rebuild on your chart. that's a known event where the hub slows down, I would expect that be evident on the chart, but yours doesnt seem to show it.
Looks solid. Try clicking on the little green square that's attached to the left hand side of the config node. That should force the config data to be updated.
Thanks for this. I'm new to node-red, and linux in general.
Any chance you could show me what format to create the table for the database? I've got it all set up, but for that. Appreciate your work here. It's awesome!
Thanks, yes I had already added the table responsetimes to the DB hubitat_logging, I was meaning the format of the table. At present, I'm getting this: