You're welcome! I hope HE support takes notice and makes more external tool support tools available to us.
Glad you have it working well for you. And yeah, this is just the top of the rabbit hole. Wait until you start having NR organize your file systems and rotating logs.
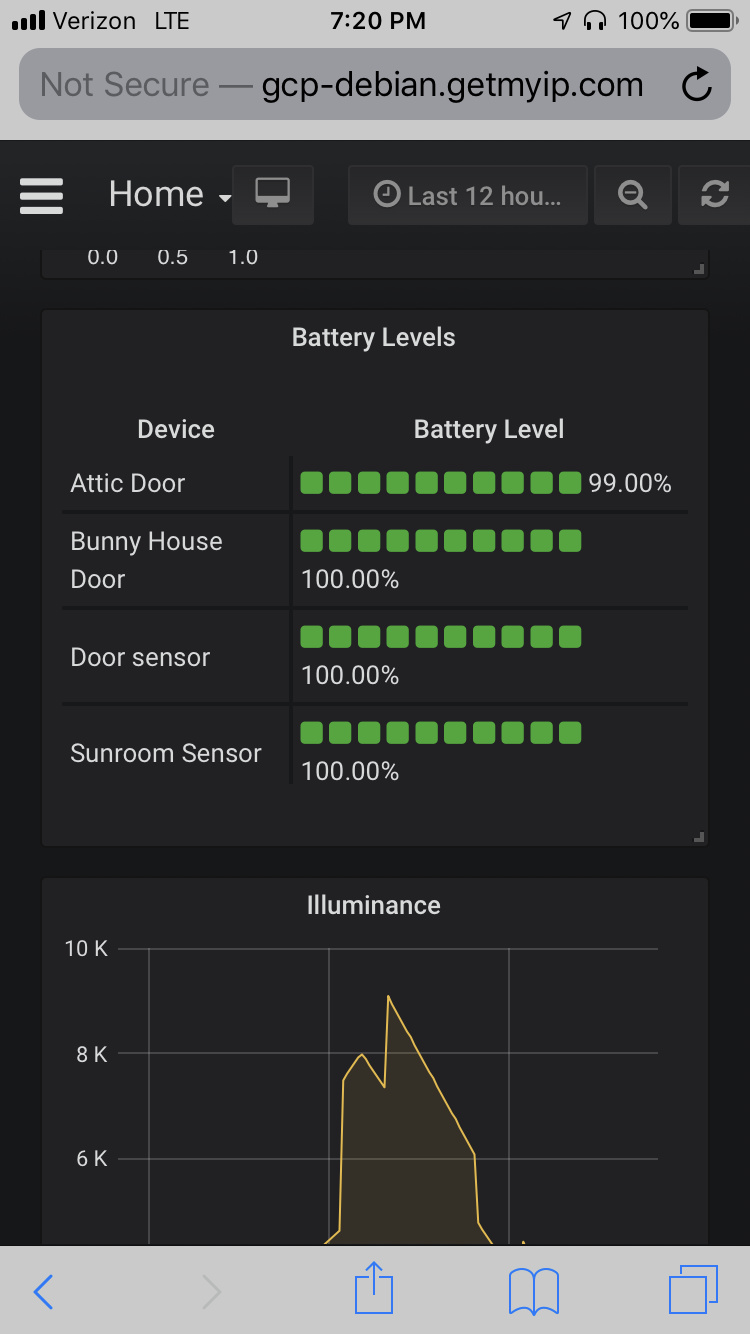
I have a boom table setup in Grafana for battery monitoring but I noticed only a couple devices show up and some actually drop off. Anyone else have this issue?
I've seen this and I think it's because battery devices report when they want to (it seems). That's why I have a timed flow that grabs the battery data every few hours. It might be slightly stale data depending on when they last reported, but it works better than relying on events/logging.
What I do not understand is if I refresh a device I can get the battery levels to report, but then they are dropping of Grafana after some time. Once a level is received should this not stay in the InfluxDB until the next reported level? Just not sure why devices are dropping off my Grafana boom table after they have reported. These devices should show the last reported battery level until a new change is reported, they shouldn't just disappear.
Yup, I'm seeing the same. I looked at the influxdb code and I see there is a softPoll() method that writes the last value to the database on a schedule. It was probably done for this very reason. It seems to be essentially creating fake events that just rewrite the last event received to the database to avoid gaps in the graphing.
The way Hubitat works is based off events. An App or a driver can send off an event when it does a refresh or actions take place. This event first goes to the Hubitat core. The platform checks of there is a change to the previous value. If there is, the platform stores it in into internal DB and sends that information to all the apps that subscribed to that event and also sends this information out over the websocket that the Node-Red flow listens too. If there is no change in value, the platform core will not send that event out. Therefore the anode-Red flow never sees the event and doesnt Store anything in Influx. At least that is the way I understood on how it works.
Now, the “old” InfluxDB App did a softPoll, meaning on a scheduled basis it went through all of the devices and their attributes and stored those to influx. No matter if there was an actual event or not.
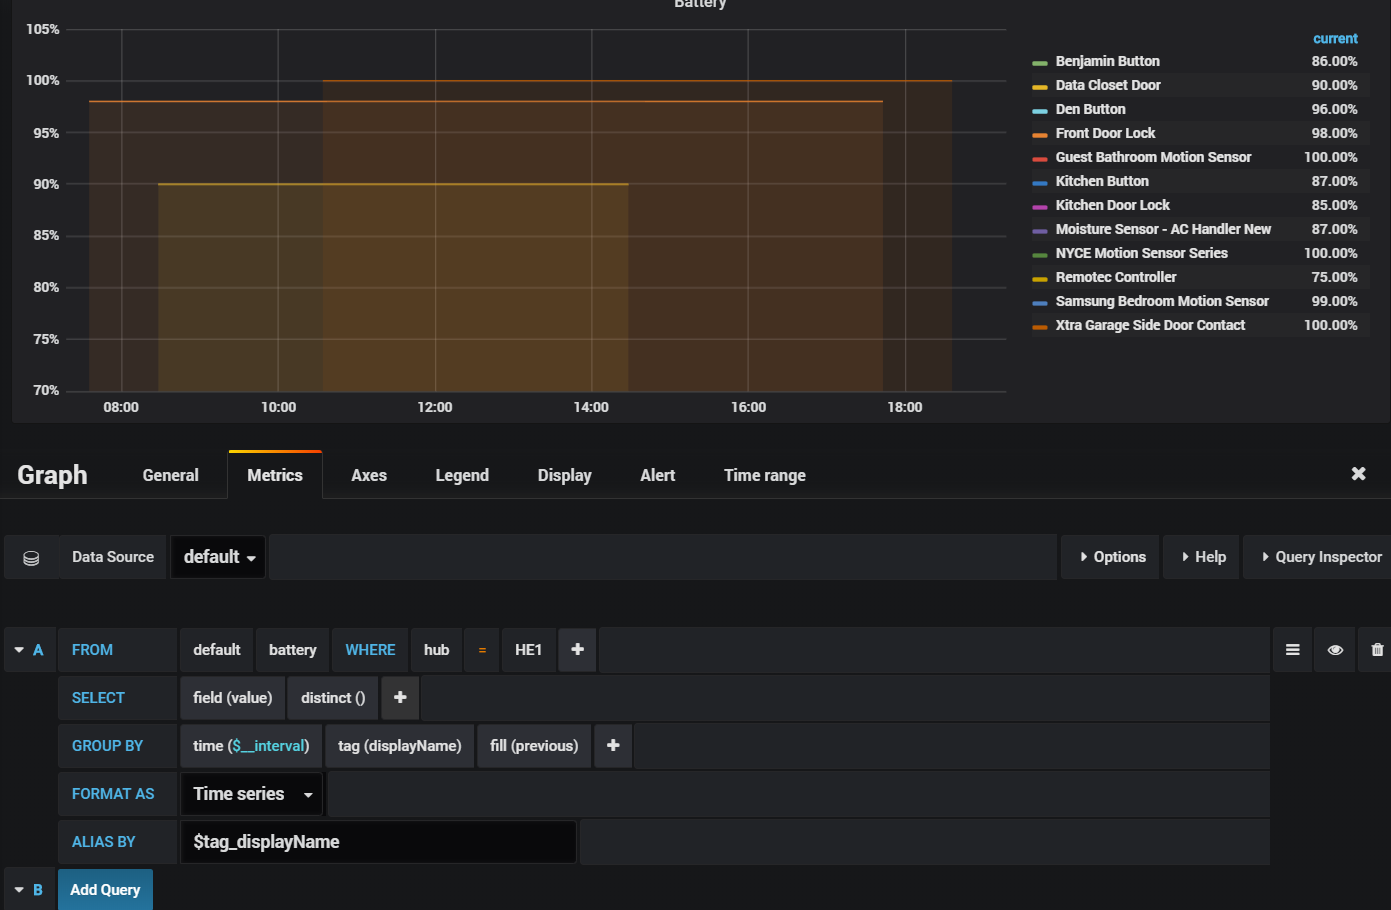
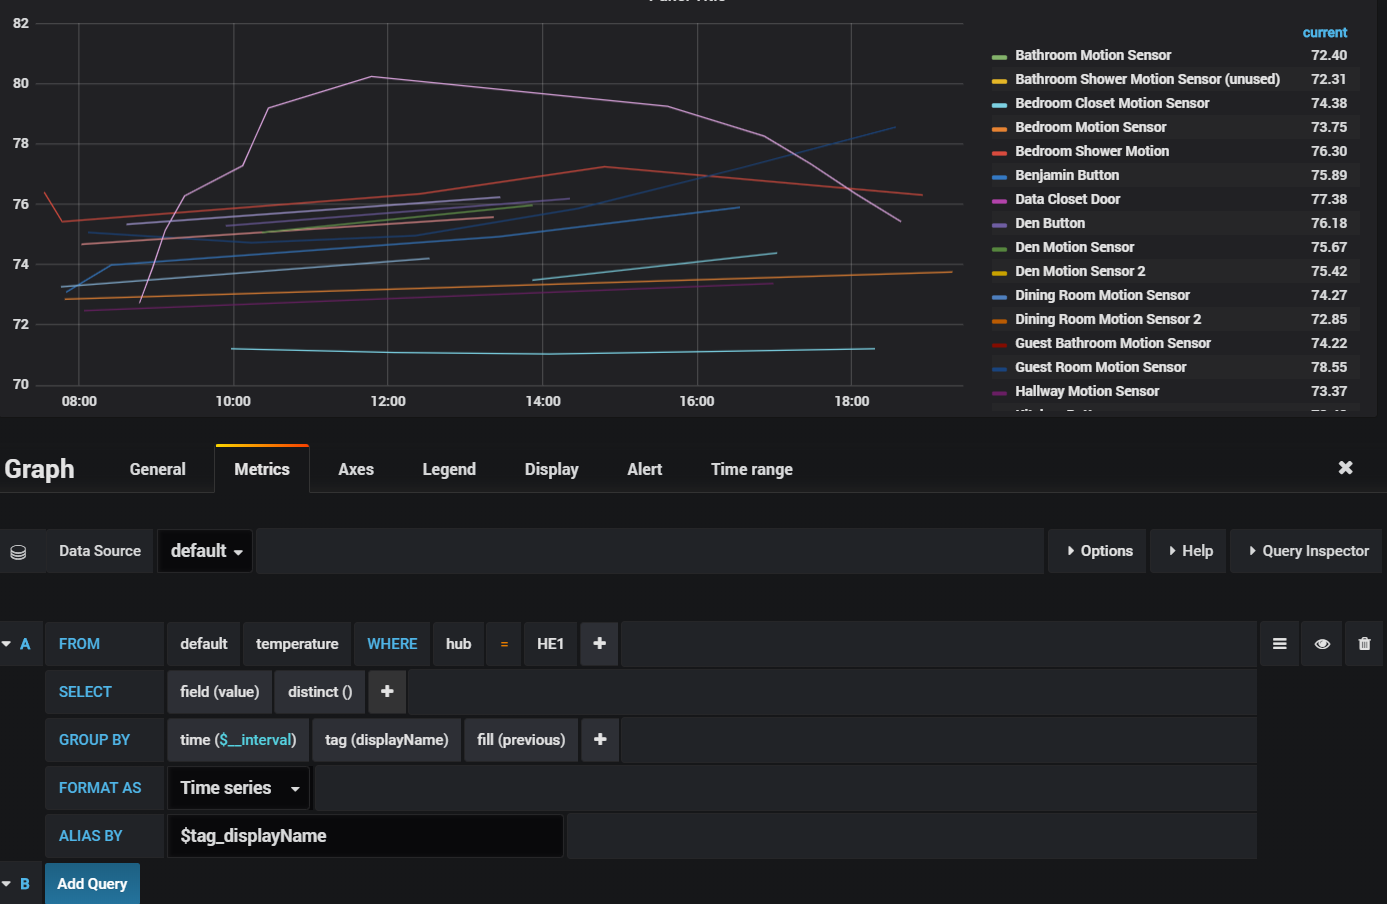
The Node-Red flow doesn’t and can’t do that, it doesn’t have that level of access as there is no App installed anymore. I worked around that by using the fill(previous) option in the query within Grafana. So far, I have not seen anything drop off.
There is a potential second flow that could be developed with the MakerApi. By using the MakerApi, you could consume on a regular basis the current attributes and store them within the InfluxDB. I really don’t see a need for this on my end as my Graphs still show the right data with the option mentioned above.
Of course, I could be completely wrong about this, but I am sitting on a train an d can’t really look at my Hubitat system right now....
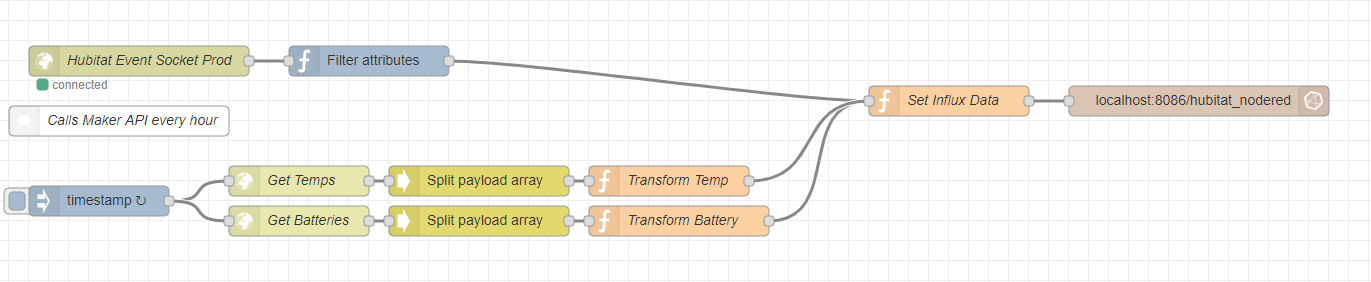
Actually, I got around that with the Maker API. I have two calls to get temps and batteries once an hour and store those in InFluxDB. The same can be done with anything that has an attribute using the /attribute:attribute endpoint in the Maker API.