What I do not understand is if I refresh a device I can get the battery levels to report, but then they are dropping of Grafana after some time. Once a level is received should this not stay in the InfluxDB until the next reported level? Just not sure why devices are dropping off my Grafana boom table after they have reported. These devices should show the last reported battery level until a new change is reported, they shouldn't just disappear.
maybe post your query and visualization setup?
1 Like
I'll have to verify if this is happening to me when I get home. It "may" be a grafana issue.
Yup, I'm seeing the same. I looked at the influxdb code and I see there is a softPoll() method that writes the last value to the database on a schedule. It was probably done for this very reason. It seems to be essentially creating fake events that just rewrite the last event received to the database to avoid gaps in the graphing.
@corerootedxb, @dan.t, @btk....any thoughts?
I might....
The way Hubitat works is based off events. An App or a driver can send off an event when it does a refresh or actions take place. This event first goes to the Hubitat core. The platform checks of there is a change to the previous value. If there is, the platform stores it in into internal DB and sends that information to all the apps that subscribed to that event and also sends this information out over the websocket that the Node-Red flow listens too. If there is no change in value, the platform core will not send that event out. Therefore the anode-Red flow never sees the event and doesnt Store anything in Influx. At least that is the way I understood on how it works.
Now, the “old” InfluxDB App did a softPoll, meaning on a scheduled basis it went through all of the devices and their attributes and stored those to influx. No matter if there was an actual event or not.
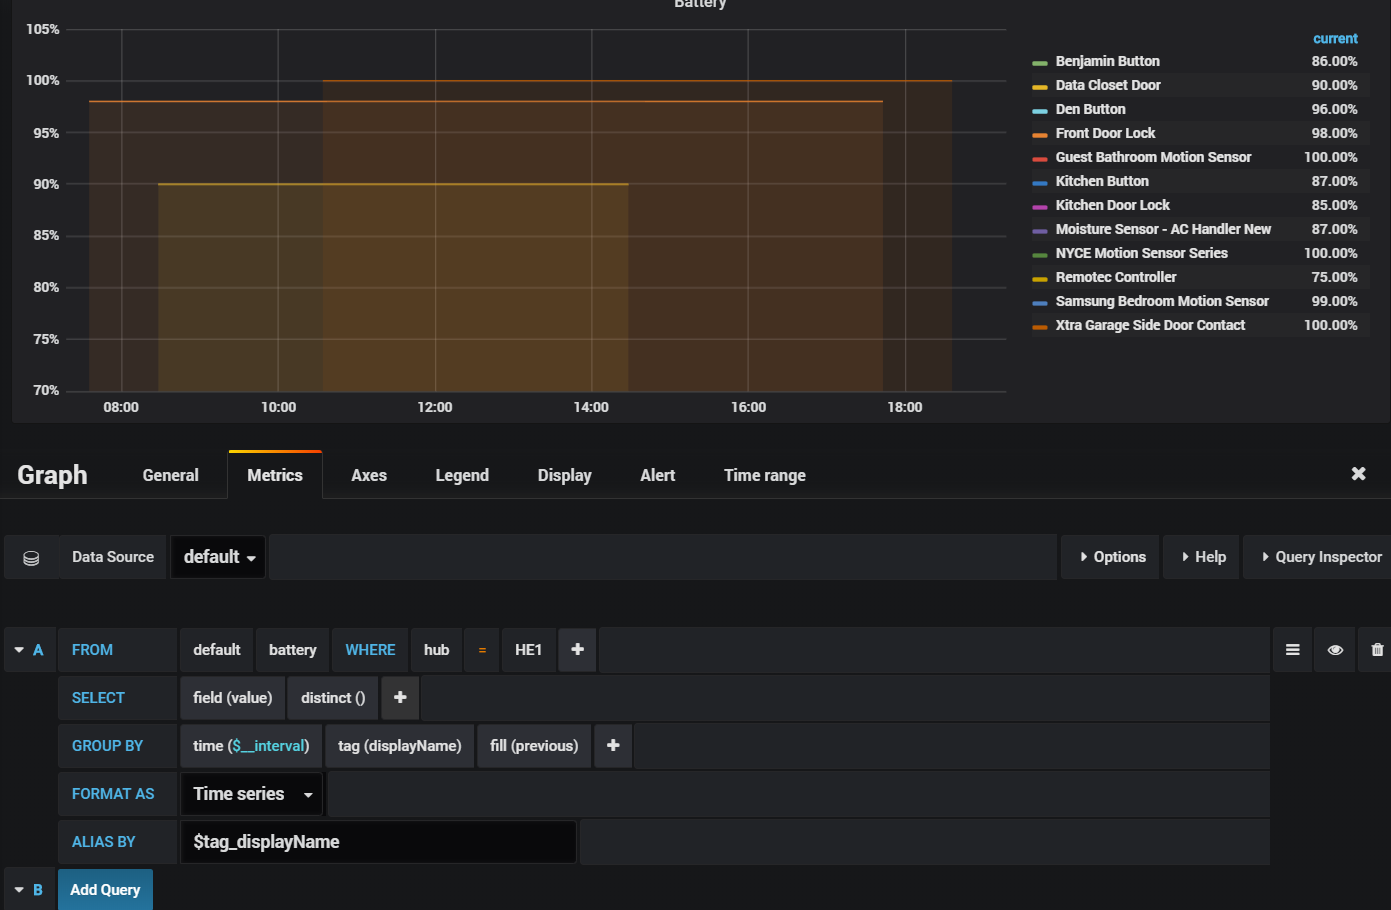
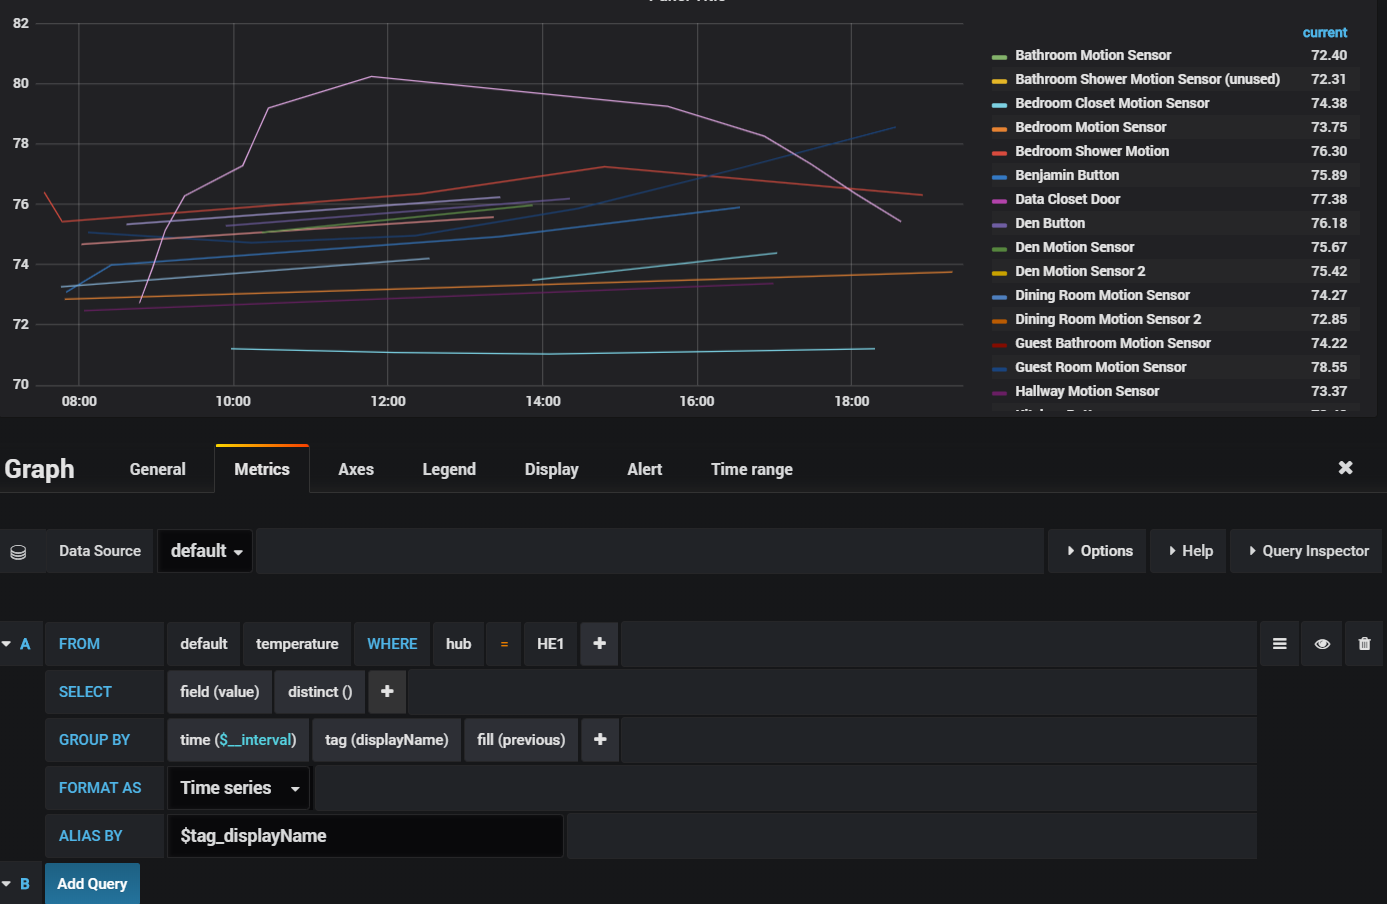
The Node-Red flow doesn’t and can’t do that, it doesn’t have that level of access as there is no App installed anymore. I worked around that by using the fill(previous) option in the query within Grafana. So far, I have not seen anything drop off.
There is a potential second flow that could be developed with the MakerApi. By using the MakerApi, you could consume on a regular basis the current attributes and store them within the InfluxDB. I really don’t see a need for this on my end as my Graphs still show the right data with the option mentioned above.
Of course, I could be completely wrong about this, but I am sitting on a train an d can’t really look at my Hubitat system right now....
1 Like
I just read this in the HA forum
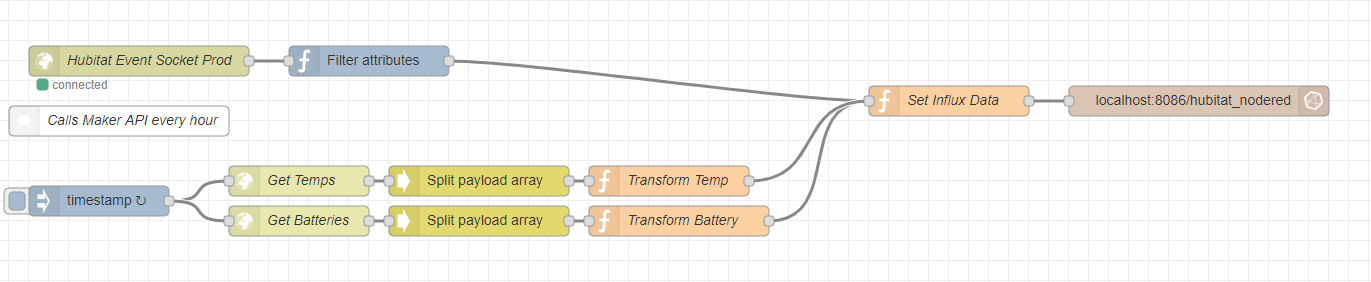
Actually, I got around that with the Maker API. I have two calls to get temps and batteries once an hour and store those in InFluxDB. The same can be done with anything that has an attribute using the /attribute:attribute endpoint in the Maker API.
So you did as I said: ![]()
1 Like
Yes, that is a correct limitation. @corerootedxb shows in his rely on how you change that.
Ha! Damnit!!! I did. Lol.
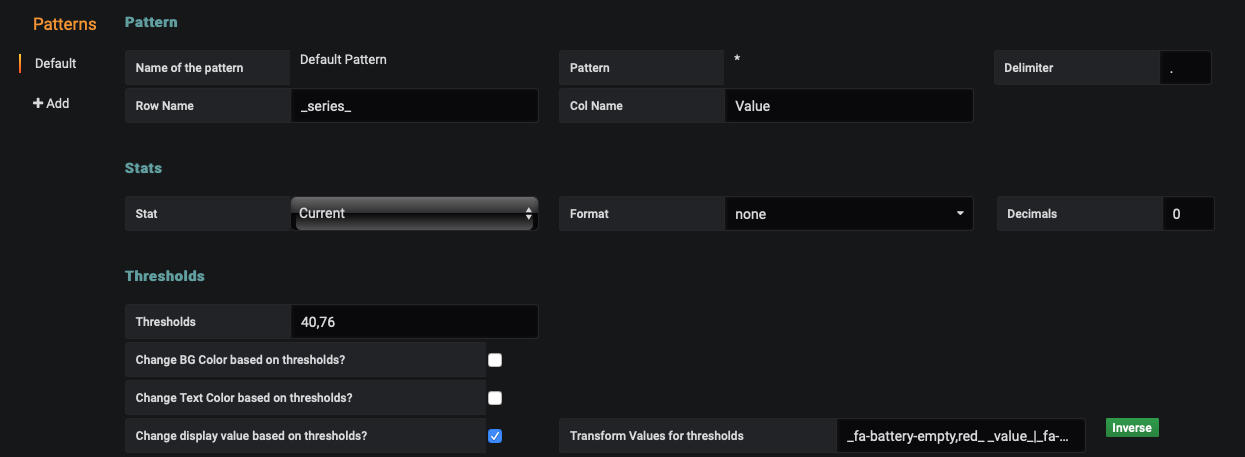
I use a complete different view for my battery levels as I am only interested in the last value not the value over a timeframe.
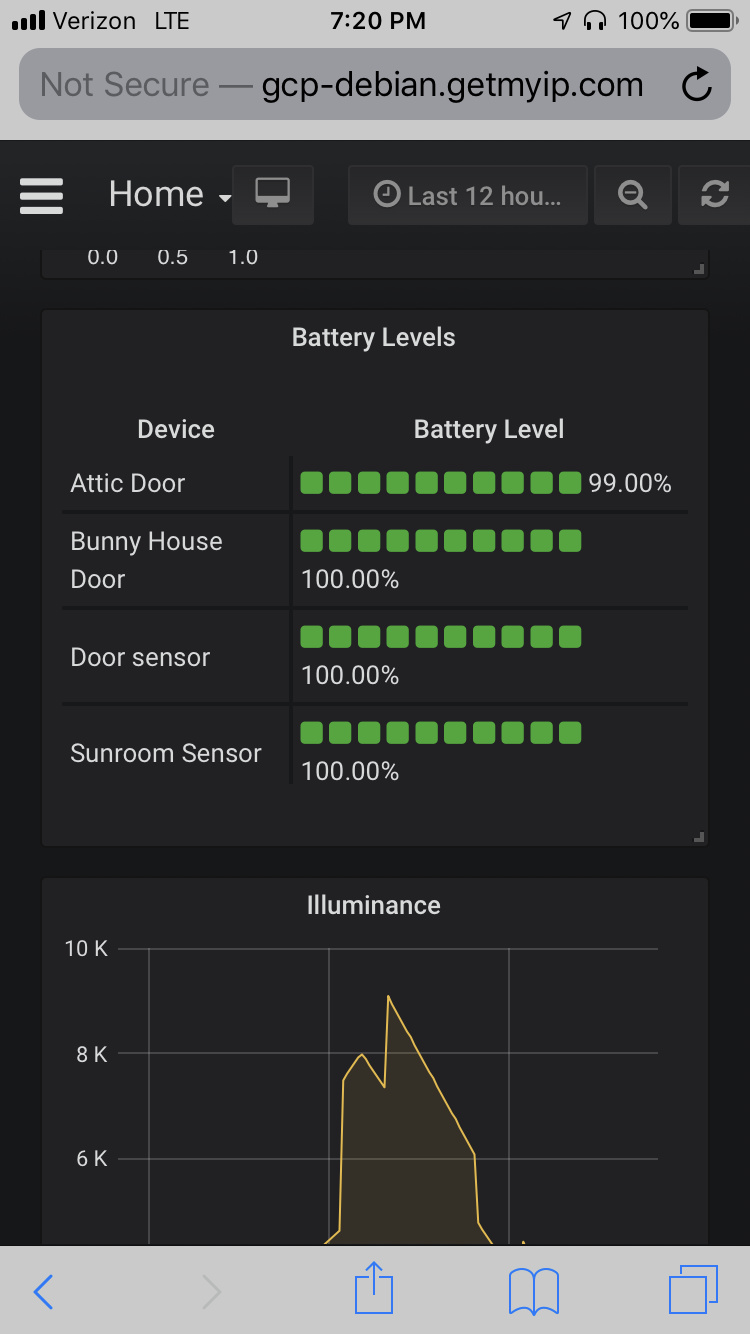
The picture is a bit weird as I am doing it from my phone right now.
@dan.t, I am seeing similar issues with temperatures. Are you graphing temps?
I think I see why you were asking about 2 instances of Maker Api in a previous thread.
That is how I have it setup, but I did not have fill previous enabled. So I will see if that makes a difference. As long as I get last reported level that is all I need to know.
I am also interested in this, if there is a particular flow that works for updating temps with InfluxDB.
Apparently, the only way to accomplish this would be to follow @corerootedxb's lead and pull the data from Maker Api on a schedule. I was going to ask him to share his flow but I figured I would try to learn a bit more about NodeRed on my own.
So far I have the battery data and have split it up for each device. I'm trying to rename the keys so they match what the "Filter attributes" pushes out to Influxdb. Almost there, but I'm curious as to what type of node @corerootedxb is using to "Split Payload Array". Something tells me it is a lot more efficient than my method so far.

I'm using the influxdb feeder app and I have the battery boom table set like this, and dont have the issue. Not sure if this helps with NodeRed method this thread is about.
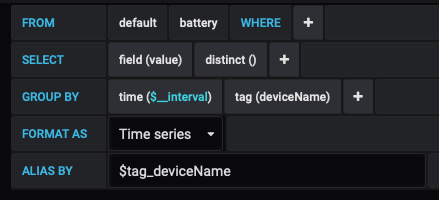
The issue isn't with Grafana or with Boom table setups.
The issue occurs if you want to graph battery levels over time (not just current values). The same with temp values over time. The Influx App creates fake events that just resend the last value received on a schedule so there aren't any gaps in Grafana if the device hasn't sent a real event in a long time. It essentially fools the database into thinking the device is sending regularly scheduled reports of battery events (in reality HE only sends an event when the battery level changes...which can take a long time).
This requires a bit more work in NodeRed because there is no easy way to store the previous events and resend on a schedule.
@stephack: node-red-contrib-splitter is the node I'm using.
Sure there is. NodeRed has the capability to store anything in memory (be it flow., node., or global.). So, we could follow the same route as the InfluxDB app. I use this method as it was easy for me to throw together and I still use MySQL as my main reporting backend.
1 Like

