Same here, but I figured there might be upcoming updates to this and didn't want to have to always remember to have to edit the template.
I just deleted the threeaxis from the filter node instead.
Same here, but I figured there might be upcoming updates to this and didn't want to have to always remember to have to edit the template.
I just deleted the threeaxis from the filter node instead.
The bigger problem is how it does work in the Groovy code (which I pretty much directly ported from). It might be that InfluxDB has never liked the data OR the http post that the Groovy code does just swallows any errors that might get returned. I honestly don't know.
Or it could be one of the reasons Influx is considered a "bad app" that can cause lockups.
Hey guys,
sorry, it took a while, was travelling for work yesterday.
I updated my code (here) to store a threeAxis event in influx. I had to make it a special case and store three individual variables (valueX, valueY, valueZ).
Please give it a try as I only have a virtual device to test with.
Do you guys have a node to convert the output of logsocket back to regular logging formatting? I have a flow that log the logsocket to a file but I am just logging the raw logsocket data which doesn't look sexy at all 
Try this here: Logging
Is that sexy enough? Just threw it together quickly...
You can specify in the logger to write it to a file.
Has anyone seen a performance impact on their hubs with all of this logging? I'm still trying to track down what's causing my hub to slow to a crawl every night.
Also, if I duplicate a websocket connection in my flows, does that make two separate connections, or is Node-RED smart enough to use the same connection for both inputs?
Actually, I have seen the opposite, my HE is quicker than before! [EDIT]: I had the InfluxDB app running, which is on the bad list and can now do my metrics without it!
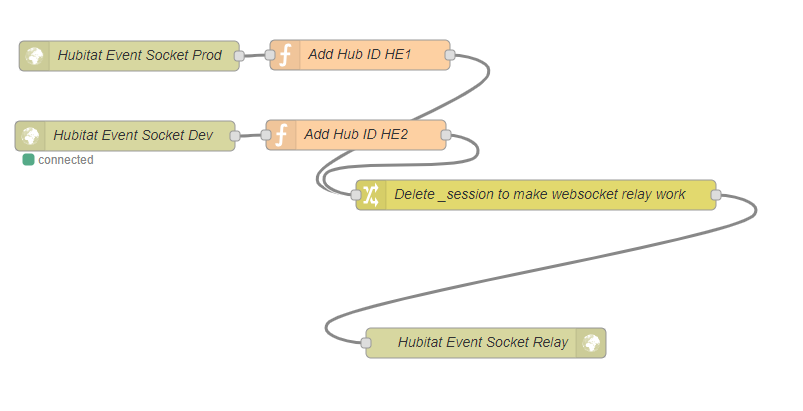
I was worried about this too. Therefore, I have only 1 node-red websocket connection to my HE and broadcast that message over another websocket in node-red. All of my other node-red flows just connect to that one internal node-red websocket. Something like this:
This way I can make sure that I only have one active websocket connection to HE open at any given time
Good. That's what I expected as well when I ditched the "evil" InfluxDB app, but I'm running out of non-standard stuff to disable.
This is smart. I like you. Still curious about the inner workings, but this definitely ensures there's no additional load.
Do you have custom drivers running?
here is a link to my Node-Red json: Eventsocket Relay
I do, and now that my apps are trimmed down to the bare minimum that's where my focus is turning.
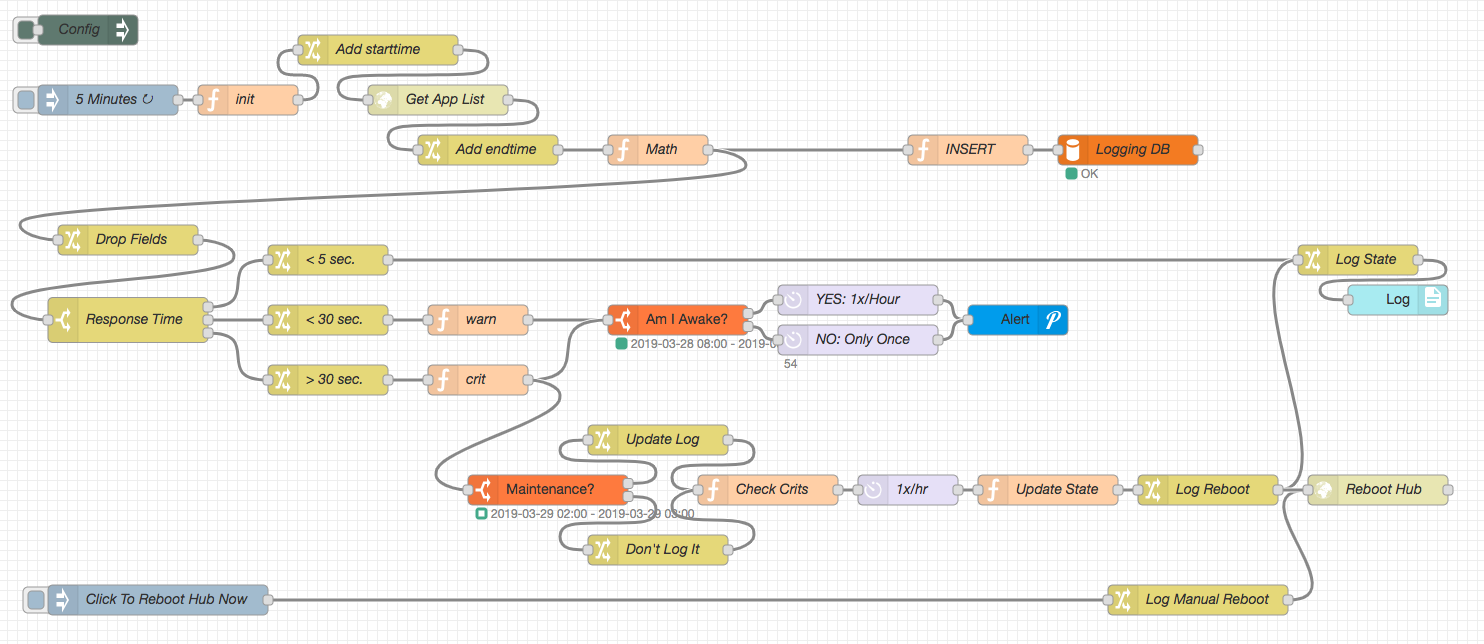
My performance monitor flow continues to evolve. Still plan to publish it at some point, but there are still a few bugs in some nodes that I need to squish first.
Errors are gone now 
Looking forward to it, nice setup!
@corerootedxb @dan.t
Thanks for getting me to finally jump in the Node Red rabbit hole. It's still a learning process but I'm finally getting some logging done the way I want it. I'm sure I'm doing a lot of stuff inefficiently but I'm just glad it's getting done.
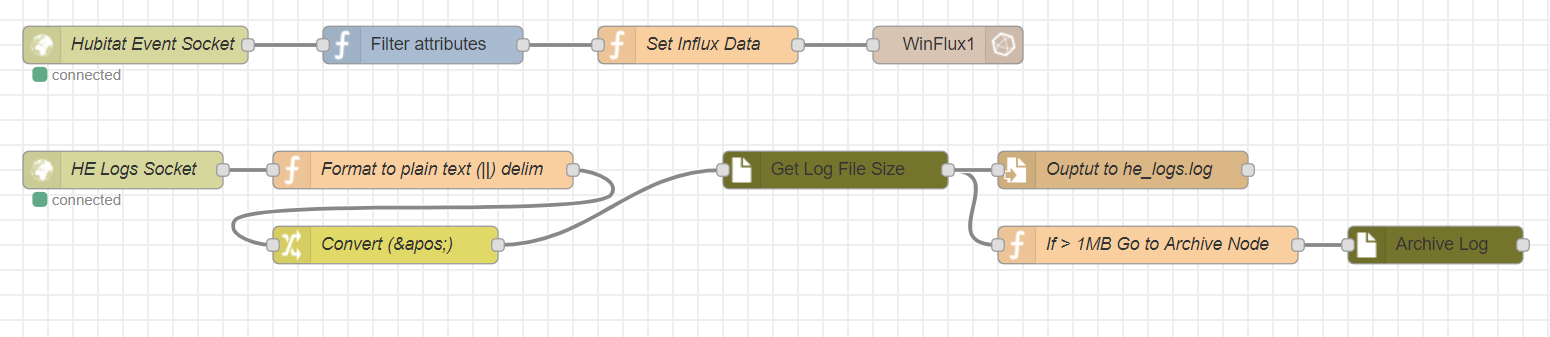
I now have my events going to Influxdb for graphing (top flow)
and I have my logs outputting to a text log file with only the info I need (bottom flow).
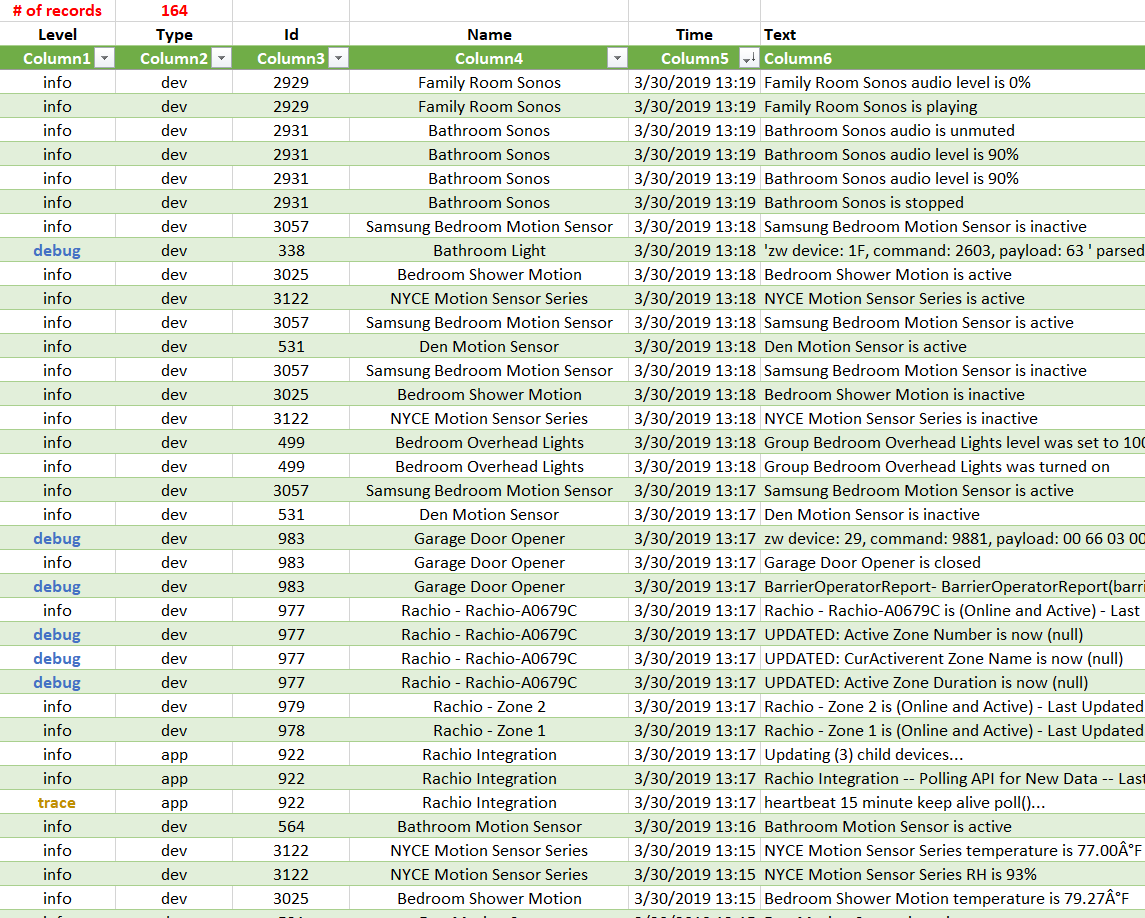
I wanted my log data to import easily into Excel but the advanced logger insisted on adding it's own timestamp, logLevel and other info that made it unnecessarily complicated. Instead I just stripped out the data I needed into a delimited text file that could be easily imported into excel.
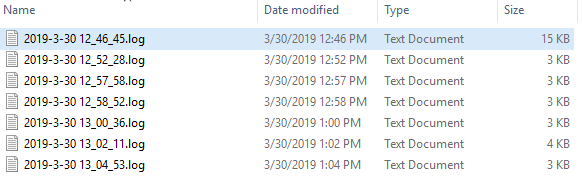
I was also able to a manually create a rolling log that archived after it reached 1MB in size (3K below for testing).
Node Red is AWESOME!!
You're welcome! I hope HE support takes notice and makes more external tool support tools available to us.
Glad you have it working well for you. And yeah, this is just the top of the rabbit hole. Wait until you start having NR organize your file systems and rotating logs. 
I have a boom table setup in Grafana for battery monitoring but I noticed only a couple devices show up and some actually drop off. Anyone else have this issue?
I've seen this and I think it's because battery devices report when they want to (it seems). That's why I have a timed flow that grabs the battery data every few hours. It might be slightly stale data depending on when they last reported, but it works better than relying on events/logging.
I believe that the battery data is reported frequently but it only creates an event if the value changed since the last report.
Ahhhh, that makes sense! Why waste processing time updating a value that hasn't changed! Clever.
The massively-overgrown performance monitor flow is alive! I split it off to its own thread to avoid cluttering this one any further.
Download the Hubitat app