Hubitat > NodeRed > MySQL > Grafana (LONG READ)

A couple of questions:

  1. Did you install node-red-contrib-filter and node-red-contrib-influxbd?
  2. Did you enable the flow (double click on the tab with the flow name and click on Enable)?
  3. Did you change the IP for the Hubitat Event Socket Prod?
  4. Click on the Debug tab (after you deploy it) and see if there are any errors showing up?

(ok, 4 == couple in my world :wink: )

I think I just got it working by changing the message from "payload" to "entire message"
I had the socket already created and was just copying the rest of the flow from @dan.t.

But thanks for the steps above...didnt know about 2 or 4

1 Like

I guess @corerootedxb beat me to it.....

Sorry! I was copying @btk's code when @stephack sent the post. LOL

Edit: BTW, LOVE the code sir!

Found one bug (which I never fixed in my nodejs code either :frowning: )

Line 202: Change to value: (Array.isArray(v.value) ? v.value.join(',') : v.value),

This is to correct for threeAxis devices. Otherwise, InfluxDB throws a 400 error.

@dan.t for contact sensor, are you able to show in grafana both open and closed state? I am only seeing the close state only. I think the code is sending the status for both open and closed events right?

Hey @cuboy29,

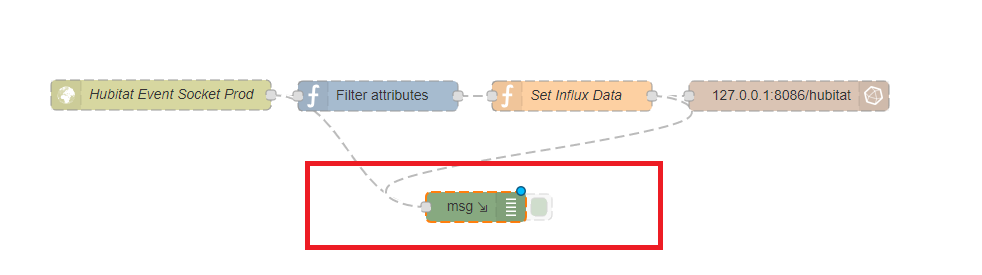
yes, I do get my contact sensors reported correctly. You could temporarily add a debug output to your Node-Red flow and see if it gets reported correctly on your end. Something like this:

Thanks for that @corerootedxb! I updated the flow in my github repo

1 Like

@btk, your HE performance monitoring is awesome! Thanks.

One suggestion: I would add a time filter in front of the reboot action to exclude any time between 02:00 am and 03:00 am. HE does it's housekeeping and backups during that time and might be slow responding. You don't want to restart the Hub during a backup.... Happened to me last night

1 Like

Good idea. I'm adding a bunch of extra logic to this flow like requiring multiple consecutive >30s response times for a reboot. I'll take this into account as well.

@dan.t, I'm still getting errors with 3 axis after updating to your new flow. Are you seeing the errors still?

Not near a computer right now but will check on it ASAP. I don’t have the need to record a 3 axis device so need to play with it for a bit. Only added it for completeness in the first place.

Stay tuned

Just to confirm, the only changes you made was to the Set Influx Data node...correct? I just copied that one over to my flow.

Yes, that is correct

@stephack
Do you have the error message that is thrown when a 3 axis value is attempted to be stored?

Somewhere. Give me a sec to find it.

[ EDIT: EDIT 2:

Error: A 400 Bad Request error occurred: {"error":"unable to parse 'threeAxis,hub=HE1,deviceId=37,displayName=Back\\ Screen\\ Door\\ Contact\\ Sensor,unit=null value=[object Object] 1553693949022000000': invalid boolean"}

]

Basically, I commented out lines 155-163 in the Set Influx Data node:

 /*var vz = msg.value.split(',');
    var x = vz[0];
    var y = vz[1];
    var z = vz[2];
    v.value = {
        x: vz[0],
        y: vz[1],
        z: y[2]
    };*/

That z: y[2] doesn't look right

1 Like

Yeah... fat fingered. :wink:

I changed that section as showen below and still get errors. Any suggestions?

else if(msg.name == "threeAxis") {
    var vz = msg.value.split(',');
    var x = vz[0];
    var y = vz[1];
    var z = vz[2];
    v.value = {
        x: vz[0],
        y: vz[1],
        z: vz[2]
    };
    v.isBinary = false;
}

Not yet. For now I just commented out the if section until I can troubleshoot it a bit more. Personally, I could care less about my three axis data in InfluxDB. I only have two sensors that report it right now anyhow.

1 Like